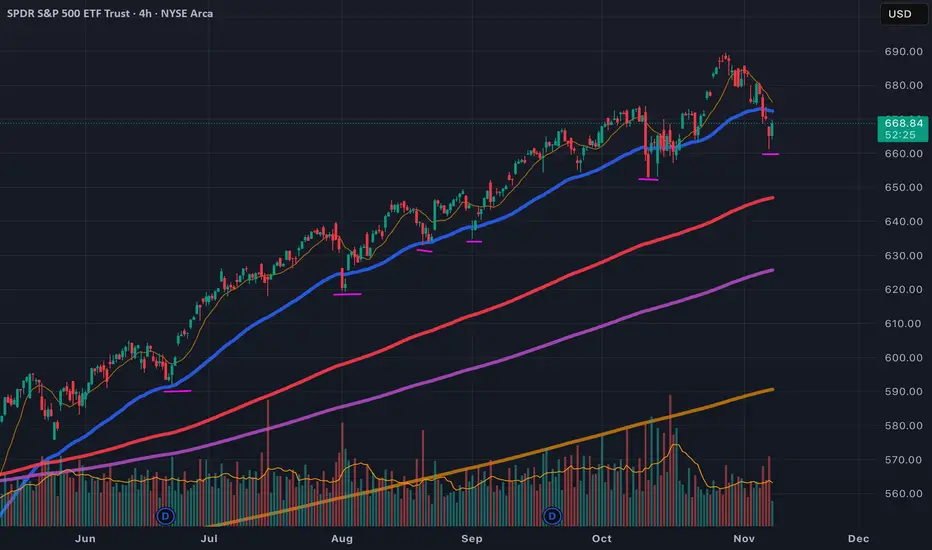
MAJOR BEARISH WAVE STRUCTURE CYCLES TOPPINGThe chart posted is the etf SPY ,I am now as bearish and if not more that my work 11/29/12/6 2024 . I am of The view that the bull market that started on march 23 2020 is at the END That low was 2191 and we are now almost equal to the rally from AUGUST 11 1987 to the August 25th 1987 high o
Key stats
About SPDR S&P 500 ETF Trust
Home page
Inception date
Jan 22, 1993
Structure
Unit Investment Trust
Replication method
Physical
Dividend treatment
Distributes
Distribution tax treatment
Qualified dividends
Income tax type
Capital Gains
Max ST capital gains rate
39.60%
Max LT capital gains rate
20.00%
Primary advisor
SSgA Funds Management, Inc.
Distributor
ALPS Distributors, Inc.
ISIN
US78462F1030
SPDR S&P 500 ETF Trust is an Exchange traded fund. The fund seeks to provide investment results that, before expenses, correspond generally to the price and yield performance of the S&P 500® Index. The S&P 500® Index is composed of five hundred selected stocks. SPDR S&P 500 ETF Trust was founded on January 22, 1993 and is headquartered in New York, NY.
Related funds
Classification
What's in the fund
Exposure type
Electronic Technology
Technology Services
Finance
Stock breakdown by region
Top 10 holdings

SPY: First week of November and Seasonality!Hey everyone,
The obligatory SPY post has arrived.
In it, I talk a bit about seasonality and some outstanding high probability targets on SPY, as well as the levels for next week.
Hope you enjoy! And as always, safe trades!

SPY to 730 by January: The Great Eruption of 2025You ever look at a chart and feel like it’s whispering to you? Not in a calm, analytical, “buy-low-sell-high” way — no, I mean a chart that’s practically begging to burst through resistance like a teenager discovering caffeine and leverage at the same time. That’s exactly what SPY looks like right n

SPY: Second week of NovemberPretty original title huh.
Lol, here are my thoughts on SPY generally going into the next week.
Expect tons of volatility!
Safe trades and enjoy the rest of your weekend!

The similarities...Does anyone else see this? The most hated v-recovery, has happened before back in 2020 (5 years ago, which is how long bull/bear trends last). Will it play out the same?

Time to buy SPY? This is the SPY 4hr chart. As you can see in the chart, in the latest trend, the price hasn't gone below the initial impulse move low below the 50 MA Blue line. We now have a bullish engulfing candle. You could buy now and put a stop below the recent low. Let me know your thoughts!
Sell signal on the SPXWe hav brokend support overnight. Any bounce should be sold into unless there's another bear trap in the making. Vix above it's 18ma. Gold bear flag broken. Oil still holding above it's 18ma. BTC probably will test 100k but not much support until 97k

Spy Bullish Daily CloseSpy closed the week out bullish as it closed green and up over 670 and is at 672 in after hours. If you look at the chart you will see that that wick on the daily trapped about 1% of the friday bears. Today was the highest volume candle of the week at over 100m.
Also,
There is about 50k in option

SPY Leads — Key Levels for AAPL, NVDA, TSLA, AMZN, MSFT-Nov. 11SPY Leads — Key Levels for AAPL, NVDA, TSLA, AMZN, MSFT
The market continues to move in a coordinated way, with SPY leading the overall direction and the major tech names reacting closely to its momentum. With SPY pressing into the upper range again, the large caps are setting up for their own key

Daily SPY (US500) Outlook - Prediction (10 NOV)📊 Market Sentiment
Market sentiment remains slightly bearish as expectations for a December rate cut may be postponed into 2026. We have seen some sell-offs, likely due to hedging or profit-taking activity. However, the market experienced a healthy bounce last Friday, as anticipated in my previous

See all ideas
Summarizing what the indicators are suggesting.
Oscillators
Neutral
SellBuy
Strong sellStrong buy
Strong sellSellNeutralBuyStrong buy
Oscillators
Neutral
SellBuy
Strong sellStrong buy
Strong sellSellNeutralBuyStrong buy
Summary
Neutral
SellBuy
Strong sellStrong buy
Strong sellSellNeutralBuyStrong buy
Summary
Neutral
SellBuy
Strong sellStrong buy
Strong sellSellNeutralBuyStrong buy
Summary
Neutral
SellBuy
Strong sellStrong buy
Strong sellSellNeutralBuyStrong buy
Moving Averages
Neutral
SellBuy
Strong sellStrong buy
Strong sellSellNeutralBuyStrong buy
Moving Averages
Neutral
SellBuy
Strong sellStrong buy
Strong sellSellNeutralBuyStrong buy
Displays a symbol's price movements over previous years to identify recurring trends.
Frequently Asked Questions
An exchange-traded fund (ETF) is a collection of assets (stocks, bonds, commodities, etc.) that track an underlying index and can be bought on an exchange like individual stocks.
SPY trades at 683.00 USD today, its price has risen 1.56% in the past 24 hours. Track more dynamics on SPY price chart.
SPY net asset value is 681.26 today — it's risen 1.23% over the past month. NAV represents the total value of the fund's assets less liabilities and serves as a gauge of the fund's performance.
SPY assets under management is 692.75 B USD. AUM is an important metric as it reflects the fund's size and can serve as a gauge of how successful the fund is in attracting investors, which, in its turn, can influence decision-making.
SPY price has risen by 1.39% over the last month, and its yearly performance shows a 13.87% increase. See more dynamics on SPY price chart.
NAV returns, another gauge of an ETF dynamics, have risen by 1.23% over the last month, showed a 7.23% increase in three-month performance and has increased by 15.33% in a year.
NAV returns, another gauge of an ETF dynamics, have risen by 1.23% over the last month, showed a 7.23% increase in three-month performance and has increased by 15.33% in a year.
SPY fund flows account for −10.09 B USD (1 year). Many traders use this metric to get insight into investors' sentiment and evaluate whether it's time to buy or sell the fund.
Since ETFs work like an individual stock, they can be bought and sold on exchanges (e.g. NASDAQ, NYSE, EURONEXT). As it happens with stocks, you need to select a brokerage to access trading. Explore our list of available brokers to find the one to help execute your strategies. Don't forget to do your research before getting to trading. Explore ETFs metrics in our ETF screener to find a reliable opportunity.
SPY invests in stocks. See more details in our Analysis section.
SPY expense ratio is 0.09%. It's an important metric for helping traders understand the fund's operating costs relative to assets and how expensive it would be to hold the fund.
No, SPY isn't leveraged, meaning it doesn't use borrowings or financial derivatives to magnify the performance of the underlying assets or index it follows.
In some ways, ETFs are safe investments, but in a broader sense, they're not safer than any other asset, so it's crucial to analyze a fund before investing. But if your research gives a vague answer, you can always refer to technical analysis.
Today, SPY technical analysis shows the buy rating and its 1-week rating is strong buy. Since market conditions are prone to changes, it's worth looking a bit further into the future — according to the 1-month rating SPY shows the buy signal. See more of SPY technicals for a more comprehensive analysis.
Today, SPY technical analysis shows the buy rating and its 1-week rating is strong buy. Since market conditions are prone to changes, it's worth looking a bit further into the future — according to the 1-month rating SPY shows the buy signal. See more of SPY technicals for a more comprehensive analysis.
Yes, SPY pays dividends to its holders with the dividend yield of 1.06%.
SPY trades at a premium (0.03%).
Premium/discount to NAV expresses the difference between the ETF’s price and its NAV value. A positive percentage indicates a premium, meaning the ETF trades at a higher price than the calculated NAV. Conversely, a negative percentage indicates a discount, suggesting the ETF trades at a lower price than NAV.
Premium/discount to NAV expresses the difference between the ETF’s price and its NAV value. A positive percentage indicates a premium, meaning the ETF trades at a higher price than the calculated NAV. Conversely, a negative percentage indicates a discount, suggesting the ETF trades at a lower price than NAV.
SPY shares are issued by State Street Corp.
SPY follows the S&P 500. ETFs usually track some benchmark seeking to replicate its performance and guide asset selection and objectives.
The fund started trading on Jan 22, 1993.
The fund's management style is passive, meaning it's aiming to replicate the performance of the underlying index by holding assets in the same proportions as the index. The goal is to match the index's returns.