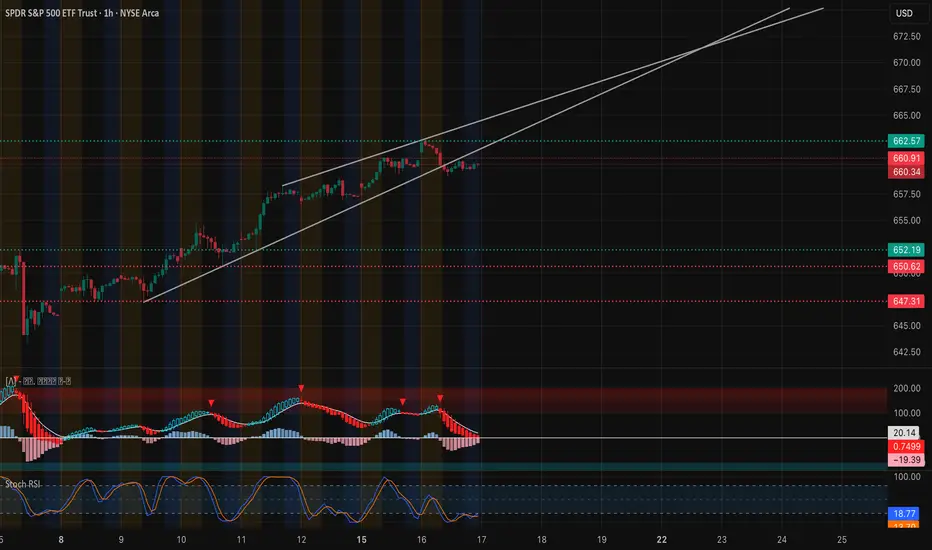
SPY 1H + GEX Game Plan for Tue, Sep 16SPY Holding Strong Inside Rising Channel — Eyes on 662 Gamma Wall 🚀
Market Structure (1-Hour View)
* Trend: SPY continues its steady rising channel advance, making higher highs and higher lows above 659.9.
* Momentum: MACD is flattening with red bars hinting at minor consolidation, while Stoch RSI
Key stats
About SPDR S&P 500 ETF Trust
Home page
Inception date
Jan 22, 1993
Structure
Unit Investment Trust
Replication method
Physical
Dividend treatment
Distributes
Distribution tax treatment
Qualified dividends
Income tax type
Capital Gains
Max ST capital gains rate
39.60%
Max LT capital gains rate
20.00%
Primary advisor
SSgA Funds Management, Inc.
Distributor
ALPS Distributors, Inc.
ISIN
US78462F1030
SPDR S&P 500 ETF Trust is an Exchange traded fund. The fund seeks to provide investment results that, before expenses, correspond generally to the price and yield performance of the S&P 500® Index. The S&P 500® Index is composed of five hundred selected stocks. SPDR S&P 500 ETF Trust was founded on January 22, 1993 and is headquartered in New York, NY.
Related funds
Classification
What's in the fund
Exposure type
Electronic Technology
Technology Services
Finance
Stock breakdown by region
Top 10 holdings

July 2026 is a peakAfter both financial crashes from 2008 and COVID the money printer got turned on. We trade in a channel before breaking out. We are in a channel now. Using Fibb I'm predicting when we breakout of this channel. July 2026

SPY: 15 Min TF MEASURED MOVE Completion🔍 Chart Context
Ticker: AMEX:SPY (S&P 500 ETF)
Timeframe: 15-minute
Annotations:
“Measured Move Completion” (highlighted near recent highs).
Old downtrend resistance line (blue).
Gap zone left behind around ~$632.
🧭 Technical Read
Measured Move
The chart shows SPY has completed a measured

SPY Daily Analysis – Sept 15, 2025📊 SPY Daily Analysis – Sept 15, 2025
SPY has completed a measured move into the premium zone. The question now: Does the correction start here, or will it extend after the next macro wave?
🔑 Key Observations:
Price has pushed into a premium supply zone after a strong impulsive run.
The measured

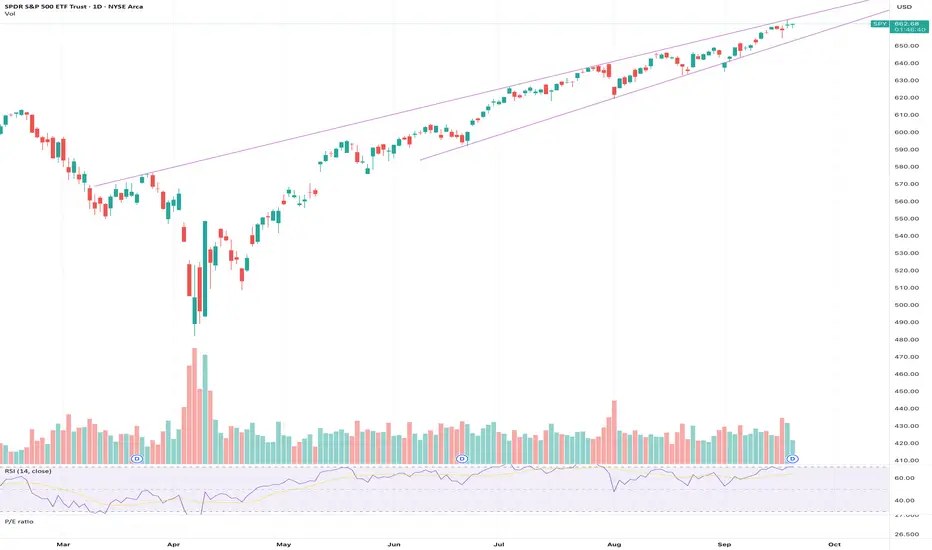
If history repeats itselfSPY continues to grind higher inside a long-term rising channel, but it’s approaching a critical decision point. We’ve already seen one 10% correction earlier this year, and the current structure suggests another possible pullback toward the rising trendline and the 0.38 FIB of the rally from April

$SPY (S&P 500 ETF Trust)🔍 Chart Context
Ticker: AMEX:SPY (S&P 500 ETF Trust)
Timeframe: 15-minute
Indicators Visible: Smart Money concepts (liquidity, premium/discount zones), trend lines, volume profile, moving averages.
Notable Zones:
Premium (red block): Major supply zone where price rejected.
Discount demand (b

$SPY to $666-$672 before downside?AMEX:SPY continues to move higher here and with a widening ichi cloud. Because of that, I think it potentially has another move to the upside over the next week or two.
I think the most likely levels from here for AMEX:SPY to find resistance are between $666-672.
After that, I'd get cautious a

SPY: Coiling Near 660 With Key GEX Support–Swing & Scalp Sep 171-Hour Chart Technical View
SPY remains inside an upward channel, but the 1-hour chart shows a slight cooling. After peaking near $662.5, price is consolidating just above $660. MACD momentum has faded and Stoch RSI is in oversold territory, signaling a pause with potential for either a bounce or a
Huge Dark Pools... Will This Time be Any Different?QQQ CME_MINI:NQ1! CME_MINI:ES1! stock market Forecast
Nvidia Stock NASDAQ:NVDA Forecast
Apple Stock AAPL Forecast
Microsoft Stock MSFT Forecast
Google Stock GOOGL Forecast
Amazon Stock AMZN Forecast
Meta Forecast Technical Analysis
Tesla Stock NASDAQ:TSLA Forecast
Magnificent 7 stock

SPY Top of RangeThe index kissed the top of it's 6-month ascending triangle range. With the big news this week for investors being what will the fed do with rates we've seen investors eagerly assume that several more cuts are baked in this year and early next.
While more cuts are most certainly on the way, the re
See all ideas
Summarizing what the indicators are suggesting.
Oscillators
Neutral
SellBuy
Strong sellStrong buy
Strong sellSellNeutralBuyStrong buy
Oscillators
Neutral
SellBuy
Strong sellStrong buy
Strong sellSellNeutralBuyStrong buy
Summary
Neutral
SellBuy
Strong sellStrong buy
Strong sellSellNeutralBuyStrong buy
Summary
Neutral
SellBuy
Strong sellStrong buy
Strong sellSellNeutralBuyStrong buy
Summary
Neutral
SellBuy
Strong sellStrong buy
Strong sellSellNeutralBuyStrong buy
Moving Averages
Neutral
SellBuy
Strong sellStrong buy
Strong sellSellNeutralBuyStrong buy
Moving Averages
Neutral
SellBuy
Strong sellStrong buy
Strong sellSellNeutralBuyStrong buy
Displays a symbol's price movements over previous years to identify recurring trends.
Frequently Asked Questions
An exchange-traded fund (ETF) is a collection of assets (stocks, bonds, commodities, etc.) that track an underlying index and can be bought on an exchange like individual stocks.
SPY trades at 663.70 USD today, its price has risen 0.22% in the past 24 hours. Track more dynamics on SPY price chart.
SPY net asset value is 663.77 today — it's risen 4.06% over the past month. NAV represents the total value of the fund's assets less liabilities and serves as a gauge of the fund's performance.
SPY assets under management is 657.73 B USD. AUM is an important metric as it reflects the fund's size and can serve as a gauge of how successful the fund is in attracting investors, which, in its turn, can influence decision-making.
SPY price has risen by 3.80% over the last month, and its yearly performance shows a 16.23% increase. See more dynamics on SPY price chart.
NAV returns, another gauge of an ETF dynamics, have risen by 4.06% over the last month, showed a 11.97% increase in three-month performance and has increased by 20.06% in a year.
NAV returns, another gauge of an ETF dynamics, have risen by 4.06% over the last month, showed a 11.97% increase in three-month performance and has increased by 20.06% in a year.
SPY fund flows account for −493.80 M USD (1 year). Many traders use this metric to get insight into investors' sentiment and evaluate whether it's time to buy or sell the fund.
Since ETFs work like an individual stock, they can be bought and sold on exchanges (e.g. NASDAQ, NYSE, EURONEXT). As it happens with stocks, you need to select a brokerage to access trading. Explore our list of available brokers to find the one to help execute your strategies. Don't forget to do your research before getting to trading. Explore ETFs metrics in our ETF screener to find a reliable opportunity.
SPY invests in stocks. See more details in our Analysis section.
SPY expense ratio is 0.09%. It's an important metric for helping traders understand the fund's operating costs relative to assets and how expensive it would be to hold the fund.
No, SPY isn't leveraged, meaning it doesn't use borrowings or financial derivatives to magnify the performance of the underlying assets or index it follows.
In some ways, ETFs are safe investments, but in a broader sense, they're not safer than any other asset, so it's crucial to analyze a fund before investing. But if your research gives a vague answer, you can always refer to technical analysis.
Today, SPY technical analysis shows the strong buy rating and its 1-week rating is strong buy. Since market conditions are prone to changes, it's worth looking a bit further into the future — according to the 1-month rating SPY shows the strong buy signal. See more of SPY technicals for a more comprehensive analysis.
Today, SPY technical analysis shows the strong buy rating and its 1-week rating is strong buy. Since market conditions are prone to changes, it's worth looking a bit further into the future — according to the 1-month rating SPY shows the strong buy signal. See more of SPY technicals for a more comprehensive analysis.
Yes, SPY pays dividends to its holders with the dividend yield of 1.10%.
SPY trades at a premium (0.01%).
Premium/discount to NAV expresses the difference between the ETF’s price and its NAV value. A positive percentage indicates a premium, meaning the ETF trades at a higher price than the calculated NAV. Conversely, a negative percentage indicates a discount, suggesting the ETF trades at a lower price than NAV.
Premium/discount to NAV expresses the difference between the ETF’s price and its NAV value. A positive percentage indicates a premium, meaning the ETF trades at a higher price than the calculated NAV. Conversely, a negative percentage indicates a discount, suggesting the ETF trades at a lower price than NAV.
SPY shares are issued by State Street Corp.
SPY follows the S&P 500. ETFs usually track some benchmark seeking to replicate its performance and guide asset selection and objectives.
The fund started trading on Jan 22, 1993.
The fund's management style is passive, meaning it's aiming to replicate the performance of the underlying index by holding assets in the same proportions as the index. The goal is to match the index's returns.