GDXU (MicroSectors Gold Miners 3x Leveraged ETN) Long
Asset: GDXU (Gold Miners 3x Leveraged ETN)
Timeframe: 30-min Heikin Ashi
Bias: Bullish continuation from fresh demand zone
Entry Zone: Around 207–208
Stop Loss: 184.71
Take Profit: 276.96
RRR (Risk/Reward): ~3.0
Target Gain: +33.17%
Potential Drawdown: -11.07%
Trend: Strong bullish structu
Key stats
About MicroSectors Energy 3X Inverse Leveraged ETNs
Home page
Inception date
Feb 15, 2023
Structure
Exchange-Traded Note
Distribution tax treatment
No distributions
Income tax type
Capital Gains
Max ST capital gains rate
39.60%
Max LT capital gains rate
20.00%
ISIN
US06368L4032
WTID provides daily 3x inverse exposure to an index of large-cap companies in the oil and energy sector exhibiting high liquidity. The portfolio contains some of the largest integrated oil and gas firms, fossil fuel exploration and production companies, and petroleum refineries. The selection process begins with the index universe ranked in descending order according to each securitys liquidity with the top 12 selected as the final index constituents. Each constituent is then assigned a weighting based on the same manner, with individual capping at 15% and the top 5 constituents total weight capped at 60%. The index is rebalanced monthly. As a leveraged product with -3x factor that resets daily, WTID is not a buy-and-hold investment and should not be expected to provide index leverage return greater than a one day period. In addition, since this is structured as an ETN, investors assume the credit risk of the Bank of Montreal.
Related funds
Classification

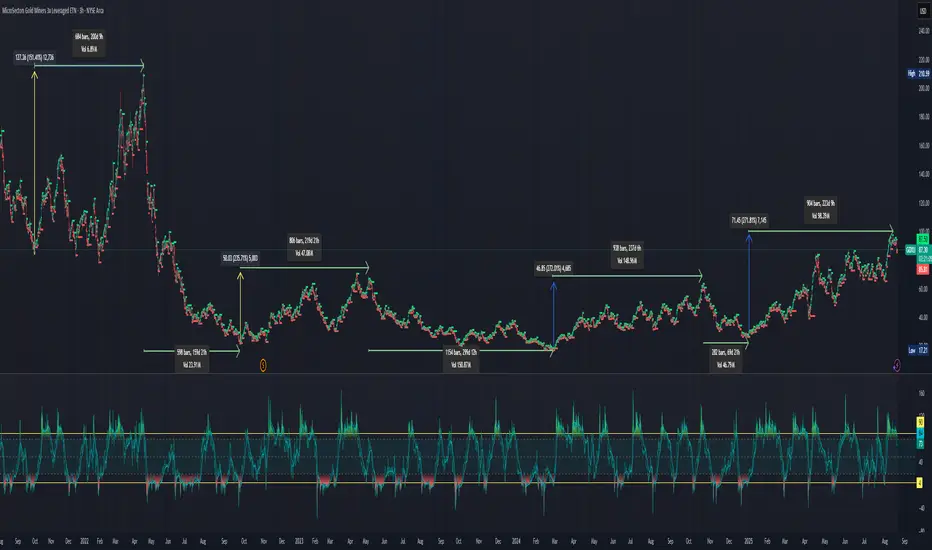
SHORT: Short term GDXU 2X pull back, is it now time to go GDXDI've laid out the major run ups and pull backs. The last 3 run ups have lasted 219 - 237 days. If the last peak was put in by GDXU it would put it at 225 days. I'm looking at this as a potential repeating pattern. Note the GDXU run ups based on a % gain from the bottom, assuming, the most recent pe
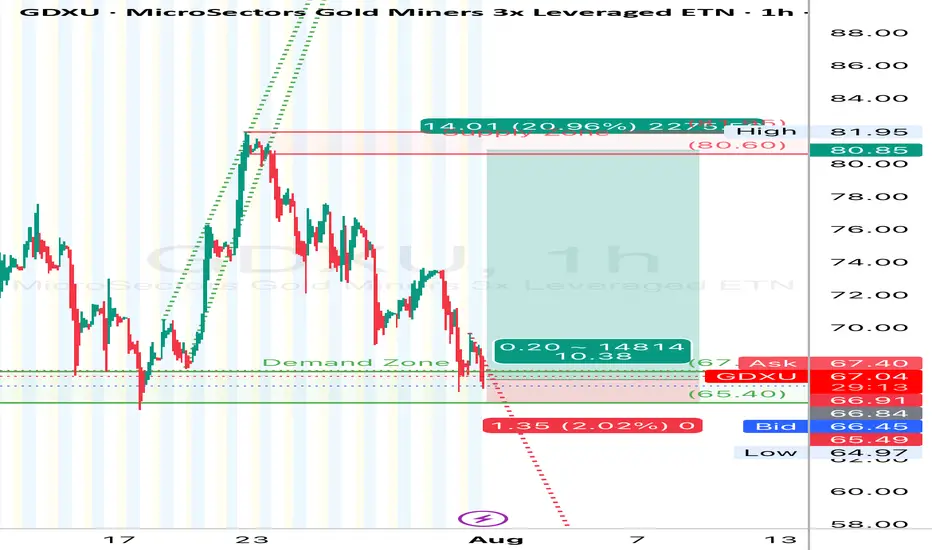
GDXU (Gold Miners 3x Bull ETF) Long SetupGDXU (Gold Miners 3x Bull ETF) | 1H Chart**
**The Fed held rates flat**, signaling a potential **pause or pivot**, which gave a bullish jolt to gold and miners.
* Lower rate expectations = weaker dollar = stronger gold = **GDXU gets rocket fuel**.
* This macro tailwind is **highly favorable** for
Double Top Alert on $FNGS!🟠 Double Top Alert on AMEX:FNGS 🟠
Price just got rejected at the 100% Fibonacci extension around $56 — a textbook resistance level.
Bearish confirmation could send us down to fill the gap at $48.35 👇
⚠️ Watch $54.30 as the critical neckline!
📉 Rejection + Gap = Potential Opportunity

Inverse gold miner3x inverse gold miner for short exposure bought this morning at 4.50. Looking at 9 for first target see if gold bounces at support should be around that range. Could easily bounce sooner but short/medium term I'm looking for gold back at 3050. Weekly gold candle is setting up for major top if it doe

Who Benefits from the Dunce Tariff Tsar? The Art of The Short: When SPY Bleeds, Dracula Drinks
Today we’re diving deep into the MAX S&P 500 4X Leveraged ETN (SPYU), the ultimate degenerate’s playground for snorting the market when SPY takes a nosedive.
Tonight, my fellow nightwalkers, I wipe my mouth after my fangs bite into MAX S&P 5

FUGU is important now FNGU is important now
now key price
now daily 200 ma support
--------------------------------------------------
if break down key price expect $150
if bounce from here expect $796
based on price action


FNGS. Beautiful Breakout on High VolumeWill be looking for entry on a lower timeframe like a 15 min chart.

SHORT GOLD! BUY INVERSE ETFSGold is extended. period
we are due for a pullback.
either short gold, or BUY reverse ETFS.
Manage risk accordingly!

See all ideas
Summarizing what the indicators are suggesting.
Oscillators
Neutral
SellBuy
Strong sellStrong buy
Strong sellSellNeutralBuyStrong buy
Oscillators
Neutral
SellBuy
Strong sellStrong buy
Strong sellSellNeutralBuyStrong buy
Summary
Neutral
SellBuy
Strong sellStrong buy
Strong sellSellNeutralBuyStrong buy
Summary
Neutral
SellBuy
Strong sellStrong buy
Strong sellSellNeutralBuyStrong buy
Summary
Neutral
SellBuy
Strong sellStrong buy
Strong sellSellNeutralBuyStrong buy
Moving Averages
Neutral
SellBuy
Strong sellStrong buy
Strong sellSellNeutralBuyStrong buy
Moving Averages
Neutral
SellBuy
Strong sellStrong buy
Strong sellSellNeutralBuyStrong buy
Displays a symbol's price movements over previous years to identify recurring trends.
Frequently Asked Questions
An exchange-traded fund (ETF) is a collection of assets (stocks, bonds, commodities, etc.) that track an underlying index and can be bought on an exchange like individual stocks.
WTID trades at 13.46 USD today, its price has fallen −2.50% in the past 24 hours. Track more dynamics on WTID price chart.
WTID net asset value is 13.46 today — it's risen 11.67% over the past month. NAV represents the total value of the fund's assets less liabilities and serves as a gauge of the fund's performance.
WTID assets under management is 2.20 M USD. AUM is an important metric as it reflects the fund's size and can serve as a gauge of how successful the fund is in attracting investors, which, in its turn, can influence decision-making.
WTID price has risen by 9.47% over the last month, and its yearly performance shows a −23.23% decrease. See more dynamics on WTID price chart.
NAV returns, another gauge of an ETF dynamics, showed a −1.56% decrease in three-month performance and has decreased by −24.84% in a year.
NAV returns, another gauge of an ETF dynamics, showed a −1.56% decrease in three-month performance and has decreased by −24.84% in a year.
WTID fund flows account for 0.00 USD (1 year). Many traders use this metric to get insight into investors' sentiment and evaluate whether it's time to buy or sell the fund.
Since ETFs work like an individual stock, they can be bought and sold on exchanges (e.g. NASDAQ, NYSE, EURONEXT). As it happens with stocks, you need to select a brokerage to access trading. Explore our list of available brokers to find the one to help execute your strategies. Don't forget to do your research before getting to trading. Explore ETFs metrics in our ETF screener to find a reliable opportunity.
WTID expense ratio is 0.95%. It's an important metric for helping traders understand the fund's operating costs relative to assets and how expensive it would be to hold the fund.
WTID is an inverse fund, meaning it's structured to generate returns opposite to the trends of the underlying index or assets.
In some ways, ETFs are safe investments, but in a broader sense, they're not safer than any other asset, so it's crucial to analyze a fund before investing. But if your research gives a vague answer, you can always refer to technical analysis.
Today, WTID technical analysis shows the neutral rating and its 1-week rating is sell. Since market conditions are prone to changes, it's worth looking a bit further into the future — according to the 1-month rating WTID shows the sell signal. See more of WTID technicals for a more comprehensive analysis.
Today, WTID technical analysis shows the neutral rating and its 1-week rating is sell. Since market conditions are prone to changes, it's worth looking a bit further into the future — according to the 1-month rating WTID shows the sell signal. See more of WTID technicals for a more comprehensive analysis.
No, WTID doesn't pay dividends to its holders.
WTID trades at a premium (0.06%).
Premium/discount to NAV expresses the difference between the ETF’s price and its NAV value. A positive percentage indicates a premium, meaning the ETF trades at a higher price than the calculated NAV. Conversely, a negative percentage indicates a discount, suggesting the ETF trades at a lower price than NAV.
Premium/discount to NAV expresses the difference between the ETF’s price and its NAV value. A positive percentage indicates a premium, meaning the ETF trades at a higher price than the calculated NAV. Conversely, a negative percentage indicates a discount, suggesting the ETF trades at a lower price than NAV.
WTID shares are issued by Bank of Montreal
WTID follows the Solactive MicroSectors Energy Index - Benchmark TR Gross. ETFs usually track some benchmark seeking to replicate its performance and guide asset selection and objectives.
The fund started trading on Feb 15, 2023.
The fund's management style is passive, meaning it's aiming to replicate the performance of the underlying index by holding assets in the same proportions as the index. The goal is to match the index's returns.