The Greatest Short Of All TimeI think that XLE may possibly be at a point where it is simply the Greatest Short Of All Time. Allow me to explain my reasoning.
There is clear bearish divergence on the daily chart of the RSI where price is moving higher but the RSI is failing to make fresh highs.
The Wave Master also printed sell signals on the daily, weekly, and monthly time frames.
We are up against a Bearish Order Block from the Order Block Finder indicator which acts as solid resistance to push prices down.
The Sell/Buy rate indicator, which essentially tracks retail selling and buying of assets and tends to get inverted by the markets, has reached an all time high in buying. This is extremely bearish. Every single time it has even come close to these levels, the prices have fallen dramatically. As further proof of the retail exuberance around the energy sector, Google trends search volume for "Energy Stocks" soared to an all time high in January of 2021. Retail bought and continues to buy; this much is unquestionable. As we know, retail traders are almost always wrong. They were wrong with GME, they were wrong with Bitcoin, and they will be wrong with energy stocks.
Insider selling at never-before-seen levels, which has always historically has been followed by a movement downwards. Insider selling is important because these guys know the industry like the back of their hands, and understand things about it that retail never will. In fact, just as retail was selling off into the lows in 2020, insiders were scooping up their shares. They knew better than us then, and they still know better than us now.
The long term trend of the Energy sector is clearly down when you look at the macro charts and adjust for the inflation of the money supply. It's always good to align yourself with macro trends, since time will be on your side and even if you are wrong in the short term, you will be right in the long term.
Jim Cramer, famous for being wrong about 80-90% of the time, has said that it's a good time to buy energy. He does this to bait his retail followers into buying so that his wealthy backers have someone to sell their shares to. (Note how the sky-high insider selling proves that this is true)
According to some traders who study options data on stocks, there is also an extreme amount of put-buying from these institutional traders. This means that they expect the price to not only fall, but fall very sharply and on high volatility. It's quite possible that we could see news in Ukraine about how they have resolved the war. According to Polymarket, there is currently a 22% chance that Russia will end up "expanding its number of federal subjects by July 1, 2022". If they fail to do this, they have effectively lost the war, which would be very bad for the energy sector because wars use up a lot of energy and of course put upwards pressure on the markets. The opposite is also true here, where the announcement of a war ending could give us a downwards shock to the price.
The seasonality here is also pointing bearish. While March and April are very good months for oil, there is almost zero growth on average during May, June, and July the growth only returns for a possible pullback to the downtrend through August and September, followed up by the even more bearish months of October and November.
I also see some retail traders in the comments (who pretend to not be retail, but clearly are) who claim that there is an "energy supercycle" which will push prices higher. That is not how the market works, and I'm sure lots of traders are thinking the same way as this silly head. The fact is, saying there is a "supercycle" for energy is essentially him uttering the words "New Paradigm", which is exactly what ARKK investors were saying in 2020, and what the dot com bubble chasers screamed all the way to the bottom. Some thing never change. You might say "oh, the opinion of a single person cannot give us any real information about the market" but you would be wrong. You see, the way one trader who is following the herd is thinking is the way that all traders within the herd are also thinking. It's like drilling a hole into the ground to get a sample of the resources that lie below. Retail traders are the resources, and we are the drillers.
The US stopped putting as much money into investing in increasing production of energy. They did this because they don't see a long lifespan for this industry at all, considering the fact that we are slowly moving away from using natural gas and oil, to using green energy. The fact is, many of the energy production methods are not even profitable most of the time due to the extreme volatility of the commodity markets. US Shale Oil producers are finally breaking a profit for the first time in a long time, but they can easily go back underwater again just as soon as the prices fall some. Today's traders seem to forget that not long ago the price of oil was NEGATIVE, but I remember. As we perpetually innovate our production methods of this green energy, the prices will tank like we have never before seen.
Energy is also correlated to all other risk assets, and those have been selling off aggressively. There is truly no shelter from the storm here, but some traders like to dilude themselves that it has become uncorrelated. In reality, when an asset that was previously correlated experiences a brief period of not being correlated, it almost always ends up resuming it's correlation after a period.
I also have a very long term elliot wave count of commodity markets against the SPX which validates my bearish sentiment on the energy sector because I think we are going to see a very very large decline over the coming years in the price of commodities while stocks see a strong rally over time. In fact, when counting even the small degrees of this trend, it seems we have just completed the last leg of the terminal move up for commodity prices when set against stocks, and are ready to begin the great tumble. This will of course put pressure on XLE, since it is extremely correlated to commodity markets (energy is a commodity, lol).
OPEC, the oil cartel, managed to produce more oil in May than it had in April. As we know, the supply and demand is what drives prices to some degree. So this increased supply will push for lower prices, especially if OPEC continues to pump out more oil.
Read this thread about "Getting It In Good" by the genius quant trader from Alemeda Research, Sam Trabucco, to understand why having high-conviction trading ideas is so valuable, and why I am risking a large chunk of my account on this one single trade. twitter.com
The short version of this thread is simply that "Bigger is Bigger (when Betting is Better)"
In conclusion, I will hold my OTM puts at $78 expiring in about 2 months, and probably buy more at the market open.
And if you read this far, I will answer your question: Yes, I am autistic, and trading is my special interest. You trade to make money. I trade because it's the greatest game ever created, and more fun, profitable, and exciting than any other thing in the world.
Thanks for playing.
Trade ideas


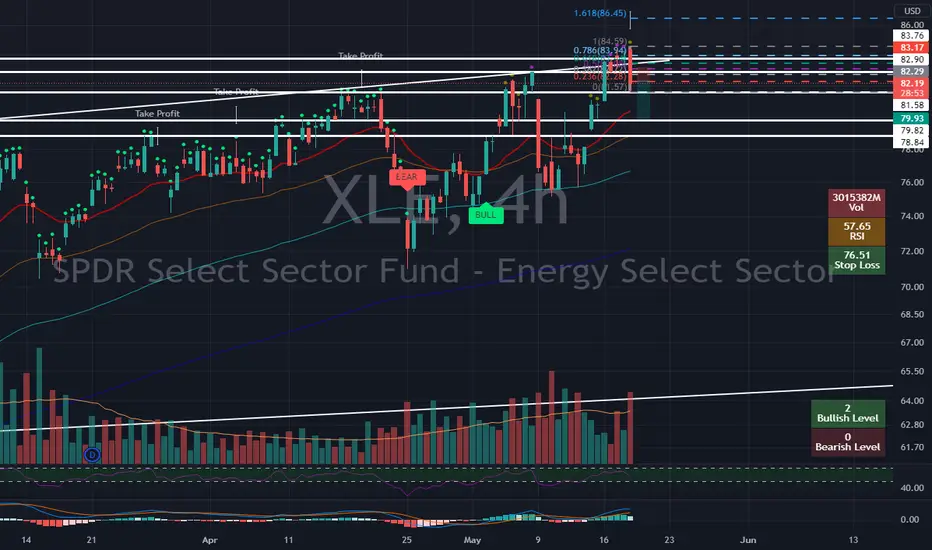
XLE CallConsolidation at 1.618 which is usually a profit target of mine. Expecting a big move. Bought a cheap call, more of a riskier play.

XLE Energy SurgeEnergy got beatdown for decades but is now in vogue again. It's stealing fire from the market. Bullish!

Update on my XLE idea from earlierRecently I said I am bearish on XLE and outlined many different reasons why that is. Now I have the chance to short it, and I'm risking a decent chunk on it because I have good conviction in this trade. Note that I decided against buying puts because the volatility premium is simply too high, and VIX is about to get crushed down.

XLE XES Bearish Pattern in Play (Bearish)Clearly there is a Bearish Divergence on XLE and XES on RSI and PPO
On Weekly time frame as well, there is negative divergence
Risk to Reward clearly favors Short Opportunity

Iron Condor XLE 13 May 2022XLE 13 May 2022
The current implied volatility is at 36.3%/year
So that converted into daily is 2.3%
Since we are in need of the open price for the highest accuracy, I am going to take the current price
which is 79.3(you can also wait for the opening price and take +- 1.8 points from the open candle value)
So based on that our channel for today is going to be compressed with a probability chance of 85% within
TOP 81.1
BOT 77.5
From fundamental point, today we have no big volatility news that can impact our asset.
At the same time the current values are expected to be sidemarket/bullish.
At the same the weekly expected channel top and bot values for DIA were
TOP 335
BOT 314

XLE update - 12/05/2022upside focus remains in wave (3), expecting more upside near 109.58 (wave (3) = 2.618 * wave (1)).

High Conviction Long Term Trades Print MoneyPuts on XLE for me is a very high conviction long term investment. When you make one of these, it's good to have a reason for why you are doing it, so that you stick with it and the market doesn't shake you out with a little swing. So write yourself a few reasons *why* you are taking the trade.
1) I want to hedge my portfolio from more downside risks
2) Insider traders are selling this XLE stock at an ATH, and every single time they have ever sold it even almost this much, it crashed substantially
3) Commodities are a bad investment because they only go down over the long term. The market overestimates the importance of these short term supply chain issues and underestimates the capacity for free markets to solve problems over time.
4) Jim Cramer said to buy XLE, which is historically a very good indicator that it will crash down.
5) Just from the chart alone, we can see that *every* rally this asset has ever had, has always been faded. Don't tell me that this time is different, because that is what they said when they bought ARKK at $130 each before watching it bleed to death on high inflation and rate hikes.
6) The elliot wave structure of the XLE bubble seems to be peaking out
7) I see several retail traders pretending that XLE is a "safe" hedge for their portfolio. I don't think that retail seems to realize that XLE actually has historically maintained a VERY tight correlation with the stock market almost always, and that when the SPX and other major stocks start to crash this will absolutely bleed over into the energy sector.
If you have enough conviction, it's good to take a bet on it. Bet on your beliefs! Bet against me if you must, but at least have some damn conviction and don't capitulate at the first sign of weakness. Thanks for playing.


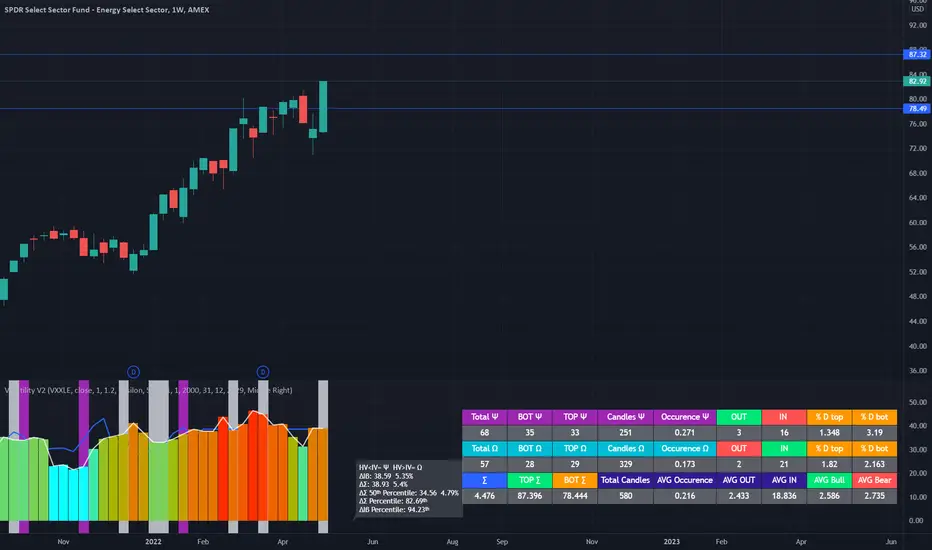
Weekly Prediction 9-13 May XLEXLE Energy Sector
9 - 13 May
The weekly VXXLE> Volatility Index for XLE Energy Sector
Implied = 38.6
In this we have to standard it for weekly session
38.6 / sqrt(52-> 52 weeks in a year) = 5.35%
My historical product is telling me with 1.2x coficient that the expected movement for this week
E Volatility = 38.93 / sqrt(52) = 5.4%
With this data, from my calculations, when EV > VIX, there were a 82.7% chance that the market
stay within the bottom and top created with the ranged from the E Vol
So for next week this range for us is going to be
TOP - 87.4
BOT - 78.5
Covered Calls in EnergyHow high will every go? I sold covered calls in XLE at 80 strike. This is a good position to be in. If it stays above 80 until mid June will buy back in. If below 80 will collect most premium and roll to July.

Jim Cramer Says: Buy Energy Stocks! Jim Cramer got paid by OPEC to tell retail traders to buy energy stocks. Everyone knows that COMMODITIES ONLY GO DOWN. Energy stocks which produce commodities are in a bubble, and their prices are utterly absurd. Buying puts at market open.
Thanks for playing. I'm short on Cramer.
*yEs. I am aware wave 4 overlaps. It's a wick, not a close. So I don't care. Thanks.

USOIL-XLE-Bear SetupBreak down in structure looking to short down to 62ish level, previous tl and 1.618 extension off first move down.

XLE compressionEnergy sector very strong.
Ascending triangle and Consolidating right below 80.50
I will take a long position here targeting $84.00 if above $80.50


Energy politically drivenIt's not about data anymore. But if it was - demand shrinking, prices overinflated. It has to go down eventually

XLE , LONG With todays early positive price action follow-through on the on the market indices, particularly SPY, I am finally able to enter a few longs and this is one of them I picked .
We also have a wedge drop / wedge pop setup here which are my favorite way to enter a trade if the instrument is in a daily uptrend .
Trade management :
Stop loss - 71.99 vs 21 ema
Initial TP - 77.32 ( 2R ) , will sell 33% here if trade works .

Is Energy Losing its Mojo?Energy stocks have led the market all year, but now there are potential signs of fatigue.
This chart shows the tight ascending pattern in the SPDR Energy ETF along with its 2018 high of $79.42. Prices attempted to move through the level this week but failed to hold. Was it a failed breakout?
Next, consider the candles above $79.42: two dojis followed by a large bearish outside day. That may be viewed as a reversal pattern. MACD has also been falling.
Third, yesterday's drop (the sharpest decline in five weeks) landed prices at the trendline that’s been support all year. Any follow-through could break the trend and trigger profit taking.
Finally, geopolitics have favored energy. But changes in the global situation could change that environment – especially with the Federal Reserve increasingly committed to slowing inflation. When lots of “good news” is priced in, it can also increase the risk of a pullback.
TradeStation has, for decades, advanced the trading industry, providing access to stocks, options, futures and cryptocurrencies. See our Overview for more.
Important Information
TradeStation Securities, Inc., TradeStation Crypto, Inc., and TradeStation Technologies, Inc. are each wholly owned subsidiaries of TradeStation Group, Inc., all operating, and providing products and services, under the TradeStation brand and trademark. You Can Trade, Inc. is also a wholly owned subsidiary of TradeStation Group, Inc., operating under its own brand and trademarks. TradeStation Crypto, Inc. offers to self-directed investors and traders cryptocurrency brokerage services. It is neither licensed with the SEC or the CFTC nor is it a Member of NFA. When applying for, or purchasing, accounts, subscriptions, products, and services, it is important that you know which company you will be dealing with. Please click here for further important information explaining what this means.
This content is for informational and educational purposes only. This is not a recommendation regarding any investment or investment strategy. Any opinions expressed herein are those of the author and do not represent the views or opinions of TradeStation or any of its affiliates.
Investing in cryptocurrencies involves significant risks. Please click here for TradeStation Crypto’s risk disclosures on investing and trading in cryptocurrencies.
Investing involves risks. Past performance, whether actual or indicated by historical tests of strategies, is no guarantee of future performance or success. There is a possibility that you may sustain a loss equal to or greater than your entire investment regardless of which asset class you trade (equities, options, futures, or digital assets); therefore, you should not invest or risk money that you cannot afford to lose. Before trading any asset class, first read the relevant risk disclosure statements on the Important Documents page, found here: www.tradestation.com .

XLE FROM SWING TRADE TO POSITION TRADE ON LONG 66.58This is the weekly chart I am using on XLE see stoch side ways above 80%
above all MA see 100 day turning up and 50 went thru 200 very nice long term long . Vol not bad more buying selling nice higher lows higher highs
order add breaks above 80.
Target 90 or higher

XLEI think XLE price will experience resistance around $83/85. It's possible price will keep climbing to $126. But I think it's more likely that Energy takes a breather, allows Tech stocks to regain some ground, while energy winds up for a final leg up.

XLE update -18/04/2022looking for more upside near 89.5 to complete wave (3), wave (3) = 1.618*wave (1) @ 89.45.
