Mean Reversion Setup: XLF1. RSI in oversold region
2. Price likely to rebound back to the mean
Trade Rules:
Entry Trigger - RSI has cross below oversold region
Exit Trigger - Close price cross above exit trigger (Red Line)
Key stats
About State Street Financial Select Sector SPDR ETF
XLF offers efficient exposure to the heavyweights in the US financials segment. Its cap-weighted, S&P 500-only portfolio means that its concentrated in large banks and avoids small-caps. For many investors and traders, XLF has been the go-to ETF for financials exposure, although there are more comprehensive funds out there for long-term exposure. Note: XLF spun off its real estate exposure in September 2016, consistent with the GICS reclassification that elevated real estate to sector-level status. The change was material: Real estate comprised about 20% of the fund at the time. For each share held, XLF shareholders as of 9/16/16 received 0.139146 shares of XLRE, State Street Global Advisors' real estate ETF. (Immediately prior to the distribution, XLF had swapped its REITs for shares of XLRE.) Prior to Dec. 1, 2025, the fund name did not include the Issuer's name, State Street.
Related funds

XLF at a Pivotal Break Zone: Financials Setting Up for a Push HCurrent Price: 54.26 (Analysis was generated on Monday Morning)
Direction: LONG
Confidence level: 58%(Professional traders repeatedly focus on a potential turn back above 55, price is holding above 53 support, and with mixed signals the setup favors upside with controlled risk.)
Targets
Target 1:

XLF Institutional Accumulation During Retail PanicThe financial sector ETF (XLF) presents a classic dislocation: retail sentiment driven by credit card cap headlines versus institutional positioning that suggests confidence in sector fundamentals.
The Flow Signal:
Despite negative political headlines, XLF recorded $467.7 million in institutiona

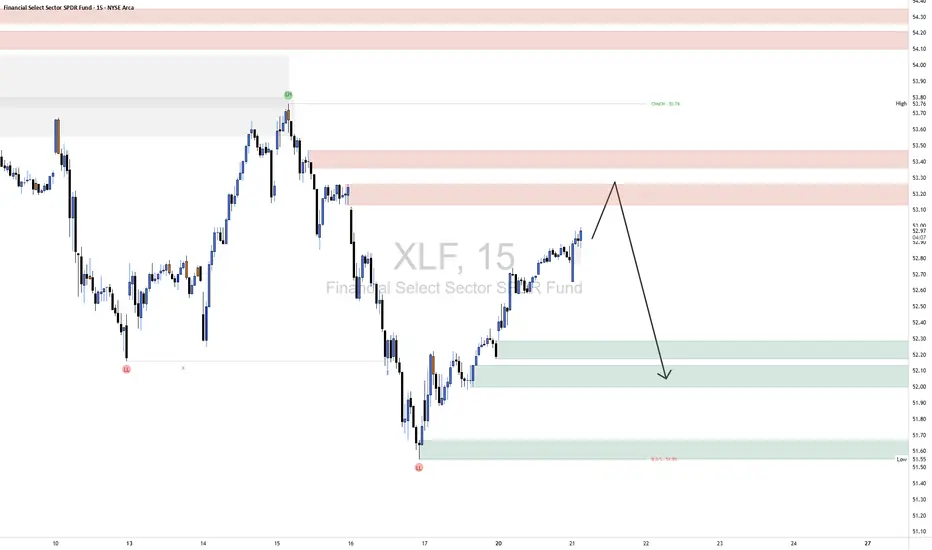
Pullback in Financial ETFThe State Street Financial Select Sector SPDR ETF hit a new high last week, and now it’s pulled back.
The first pattern on today’s chart is October 3's final price of $53.72. XLF stayed below that weekly close most of the fourth quarter, stalling there in mid-November before breaking out in Decembe

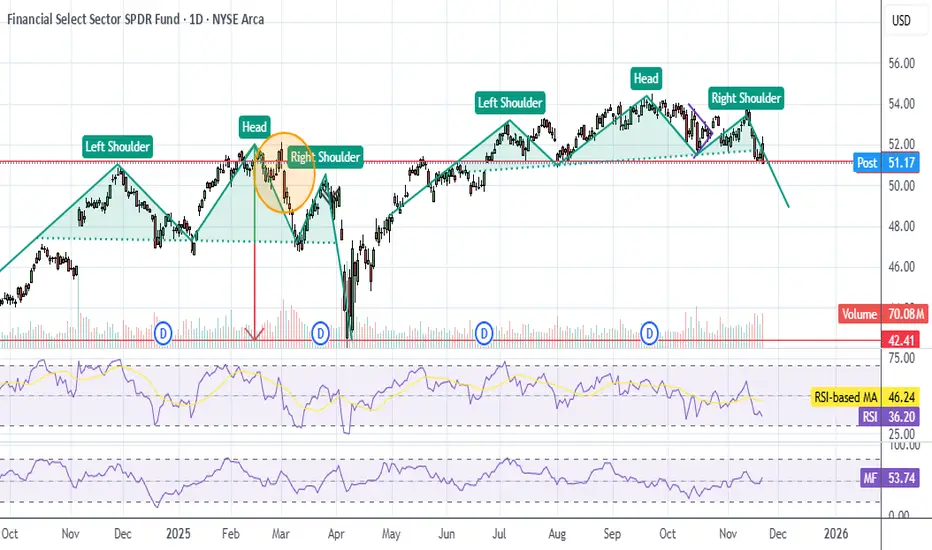
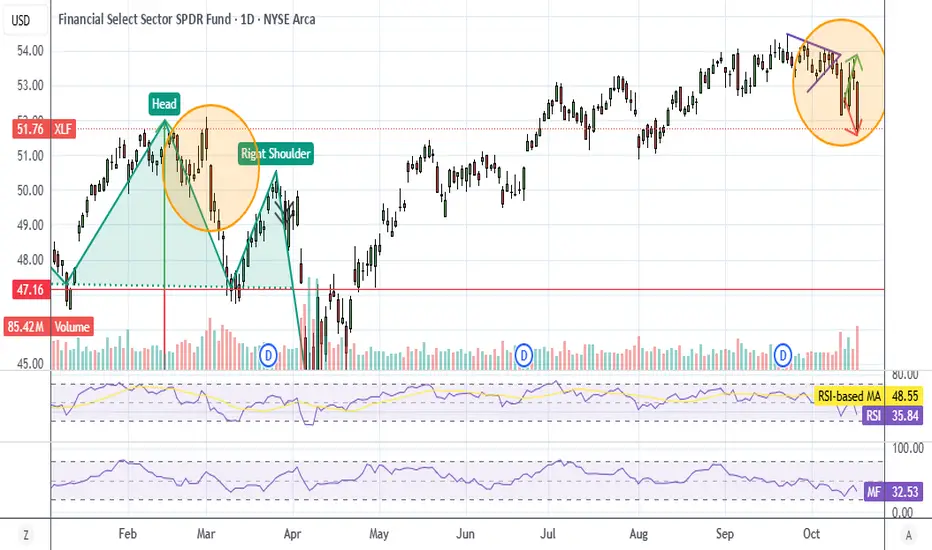
XLF Head & Shoulder patternH&S on financials again. Didn't play it last time, made some money today and left the profits in next week's XLF puts.
Financials shouldn't have gapped up with NVDA, and job numbers were better than expected so I shorted XLF on open, lol. Stepped down to $51.5 puts, from profits only to limit my
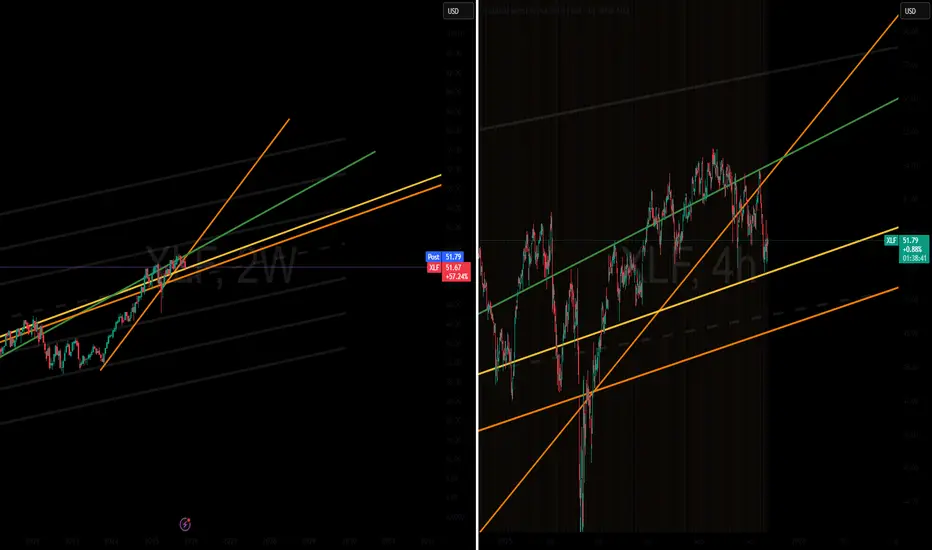
XLF critical level to defendThe Financial Select Sector SPDR Fund XLF is at a critical pivot point, testing the long-term support of its aggressive uptrend. XLF is highly sensitive to interest rates and economic outlook, making the defense of this current technical level paramount.
The price broke the Ascending Orange Trend L
XLF PennantA lot of stuff formed a pennant last week and broke out on the CPI news. XLF is one of them, small caps (IWM/RTY1!).
Chart looks very bullish for the next week or two, though we may se a dip Monday or Tuesday because MFI is overbought on my 3 hr futures chart.
Everything says buy the dip.

XLF ShortOn the 15-minute chart for XLF, the broader market structure shows a bearish trend, confirmed by a Change of Character (CHoCH) that occurred near $53.75, where bullish structure shifted to bearish control. Following that CHoCH, price formed consecutive Breaks of Structure (BOS) to the downside—most
Stock Market Forecast | TSLA NVDA AAPL AMZN META MSFTStock Market Forecast | CME_MINI:NQ1! CME_MINI:ES1! SP:SPX NASDAQ:NDX
MAG 7 | TSLA NVDA AAPL AMZN META MSFT GOOGL

XLF UpdatePretty hilarious, I draw 2 arrows and XLF hit both of them somehow.
This is starting to look a lot like February. Trade carefully the next couple of months.
As for XLF, it usually bounces when daily MFI or RSI hits oversold. Too late to get into this trade.
See all ideas
Summarizing what the indicators are suggesting.
Oscillators
Neutral
SellBuy
Strong sellStrong buy
Strong sellSellNeutralBuyStrong buy
Oscillators
Neutral
SellBuy
Strong sellStrong buy
Strong sellSellNeutralBuyStrong buy
Summary
Neutral
SellBuy
Strong sellStrong buy
Strong sellSellNeutralBuyStrong buy
Summary
Neutral
SellBuy
Strong sellStrong buy
Strong sellSellNeutralBuyStrong buy
Summary
Neutral
SellBuy
Strong sellStrong buy
Strong sellSellNeutralBuyStrong buy
Moving Averages
Neutral
SellBuy
Strong sellStrong buy
Strong sellSellNeutralBuyStrong buy
Moving Averages
Neutral
SellBuy
Strong sellStrong buy
Strong sellSellNeutralBuyStrong buy
Displays a symbol's price movements over previous years to identify recurring trends.
Frequently Asked Questions
An exchange-traded fund (ETF) is a collection of assets (stocks, bonds, commodities, etc.) that track an underlying index and can be bought on an exchange like individual stocks.
XLF trades at 51.65 USD today, its price has fallen −0.08% in the past 24 hours. Track more dynamics on XLF price chart.
XLF net asset value is 51.67 today — it's fallen 6.54% over the past month. NAV represents the total value of the fund's assets less liabilities and serves as a gauge of the fund's performance.
XLF price has fallen by −5.00% over the last month, and its yearly performance shows a −0.23% decrease. See more dynamics on XLF price chart.
NAV returns, another gauge of an ETF dynamics, have fallen by −6.54% over the last month, showed a −3.39% decrease in three-month performance and has increased by 1.30% in a year.
NAV returns, another gauge of an ETF dynamics, have fallen by −6.54% over the last month, showed a −3.39% decrease in three-month performance and has increased by 1.30% in a year.
XLF fund flows account for −882.60 M USD (1 year). Many traders use this metric to get insight into investors' sentiment and evaluate whether it's time to buy or sell the fund.
Since ETFs work like an individual stock, they can be bought and sold on exchanges (e.g. NASDAQ, NYSE, EURONEXT). As it happens with stocks, you need to select a brokerage to access trading. Explore our list of available brokers to find the one to help execute your strategies. Don't forget to do your research before getting to trading. Explore ETFs metrics in our ETF screener to find a reliable opportunity.
No, XLF isn't leveraged, meaning it doesn't use borrowings or financial derivatives to magnify the performance of the underlying assets or index it follows.
In some ways, ETFs are safe investments, but in a broader sense, they're not safer than any other asset, so it's crucial to analyze a fund before investing. But if your research gives a vague answer, you can always refer to technical analysis.
Today, XLF technical analysis shows the sell rating and its 1-week rating is sell. Since market conditions are prone to changes, it's worth looking a bit further into the future — according to the 1-month rating XLF shows the buy signal. See more of XLF technicals for a more comprehensive analysis.
Today, XLF technical analysis shows the sell rating and its 1-week rating is sell. Since market conditions are prone to changes, it's worth looking a bit further into the future — according to the 1-month rating XLF shows the buy signal. See more of XLF technicals for a more comprehensive analysis.
XLF trades at a premium (0.03%).
Premium/discount to NAV expresses the difference between the ETF’s price and its NAV value. A positive percentage indicates a premium, meaning the ETF trades at a higher price than the calculated NAV. Conversely, a negative percentage indicates a discount, suggesting the ETF trades at a lower price than NAV.
Premium/discount to NAV expresses the difference between the ETF’s price and its NAV value. A positive percentage indicates a premium, meaning the ETF trades at a higher price than the calculated NAV. Conversely, a negative percentage indicates a discount, suggesting the ETF trades at a lower price than NAV.