XLF STAYING SHORT @ 37.42Daily chart says stay long just a pull back
in a uptrend. I would pay attention to XLF may start to drop all up TNX
Weekly fine over bought still way above 70% and a great up trend
IMHO banks may start weakening XLF daily has lower highs will watch
Trade ideas

XLF - Dead CatfishNew banking regulations in EU and elsewhere combined with QE punch bowl drying up is taking wind out of the sails of the Financials.
XLF appears to be struggling at the mid-line of the regression channel again!
Potential 4th failed attempt to cross midline unfolding.
Similar chart pattern last July into Sept, which resulted in a ~10% sell off.
Bearish Engulfing candlestick pattern at recent top.
Several nearer and longer term price gaps to fill to the downside:
Nearer-term gaps
@ $37.75
@ $37.20 and near 50-day MA
@ $36.01 small but there
Several more gaps a bit farther south.
Most indicators rolling over/sick on the daily. XLF near ATHs but the ADX looking like a dead catfish that cant swim anymore...just floating with the current...and the current is taking it down off the regression channel mid-line sooner than most expect.
Target = gap fill near 50-day MA and then a kiss off the 200-day if we get some action to the downside.
Short Oct 15th Puts with $35 dollar strike.
Not financial advice.

FinancialsSector entering overbought territory with major resistance ahead, ATH short-term breakout likely with a pullback

long banksbecause TNX + money. Jackson hole gonna burn a hole in your purchasing power. INFLATION & HAWKS back on the menu

XLFDouble topping at resistance so far. Hasn't tested the 200 since last November. Wouldn't be surprised if it tests it before this November. Bearish below ath.

Short XLFThe end of QE is obviously bad news for financials.
Bought some XLF puts for this week and next. This is the one sector that I don;t expect to bounce back tomorrow


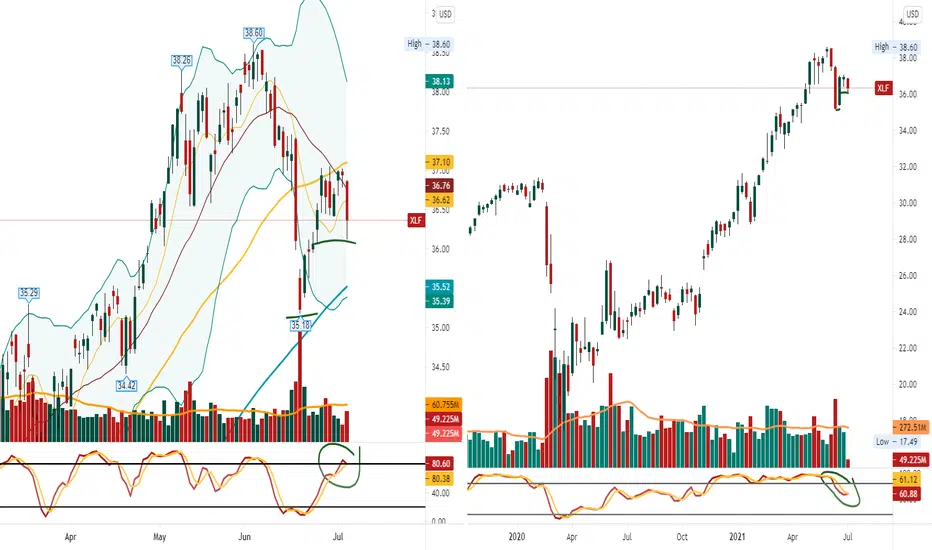
XLF weekly stoch playing short and long thru whole cycle Check it out playing the weekly stoch
looks great
Rug Pull on Deck..banks are cheap but the RSI showing under the surface there's about to be a nice bull trap getting built in here... Sept 10 $39 puts getting gobbled up. buying into that sentiment there..

More Upside in Financials?The SPDR Financial ETF has been snoozing for exactly three months, and now could be coming back to life.
Several patterns stand out on today’s chart. First and foremost is its breakout above the 50-day simple moving average (SMA).
Next is the tight volatility squeeze immediately before the surge. That suggests price could be ready to move again following a healthy period of rest. Relative strength has also improved (highlighted by our Smart Relative Strength script).
Looking back further to June 18 and July 19, we find double-bottom support around $35. XLF rebounded sharply following both moves.
Companies within the portfolio have also performed well. Goldman Sachs , for example, hit a new record high on Friday (its first in two months). Less flashy but important names like American International Group also beat estimates.
In conclusion, financials are one of the most overlooked stories this year. They exited their subprime bear status in February. Now, after a few months of consolidation, their run to new uncharted territory may be resuming.
TradeStation is a pioneer in the trading industry, providing access to stocks, options, futures and cryptocurrencies. See our Overview for more.

XLF long @ 36.25 off the 100 day maDaily stoch looks good vol weak
Weekly stoch on bottom turned up above 30% looks good
Why banks rallying because of TNX.

Long | XLFAMEX:XLF
Possible Scenario: LONG
Evidence: Price Action
TP1: 37.5
Call options 10/15/21 strike 38$
Financial sector lagging for few weeks and now it's ready to take the lead again.
This is my idea and could be wrong 100%, not a buy/hold/sell signal.

$XLF Financials failing at resistanceThe XLF ETF which tracks the financial sector of the U.S market has been battling to break resistance at $37 and the 50 day moving average. With the push lower in yields, fundamentally this is generally quite negative for banks and financial firms as this substantially decreases their profit margins.
We could potentially retest the bottom of the range at $35.00 and if that breaks then $33 could be in site which is around the 200 day moving average.

XLF STAYING SHORT @ 37.42Daily wants to roll over vol not bad
Weekly heading down staying short small shares
Long term Elliot Wave analysis for financialsIn this video I've shown the longterm price action for the financials. The take away here is that a ~2 year bear market which corresponds to wave C has most likely begun.

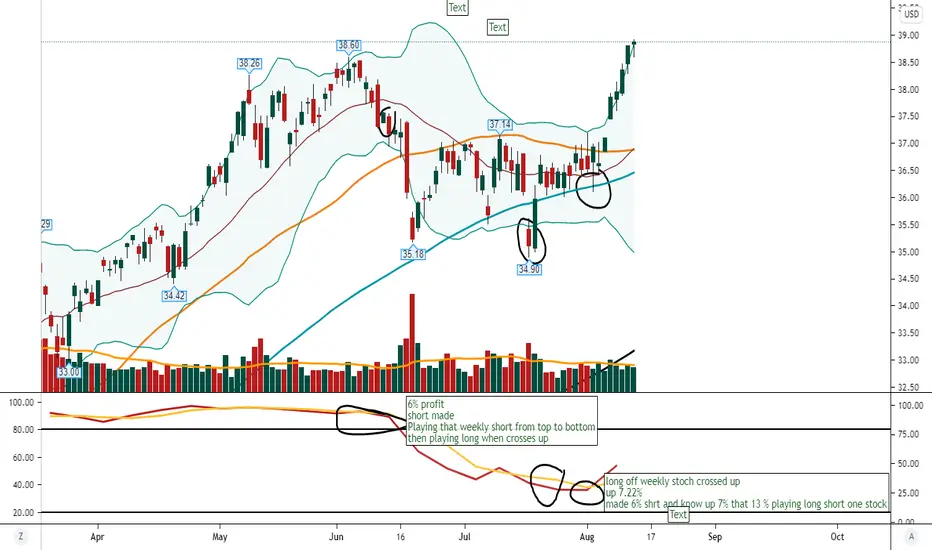
look this guys xlf EXAMPLE
Say u ahrt at 38 off daily stoch rolling over and it made a lower high hitting resistance
ok so know shrt off daily why hitting r1 and stoch rolling over. what i do next is watch my weekly and I wait for that stoch break 70-68% weekly stoch on bottom then i can add why trend down
ok drop to 35.18 daily stoch on bottom so u take 3/4 off the short keep 1/4 on
know she runs up daily stoch and boom stops at 50 day, but as she is running up look weekly stoch when it hit 50 day ma weekly stoch heading down and little tip stoch wide apart very neg, so it said stay shrt once it did not break thru add back on the 3/4 took off. Dont get scared out position this is for swing trading

XLF STAYING SHORT @ 36.60 smallDaily say wants to go higher but again look vol bad and under the 50 day MA.
Ok again daily stoch weekly bottom
see how the daily going up and weekly heading down that is called a head fake rally
why weekly holds more weight its heading south TRUST THAT WEEKLY
it never lies.

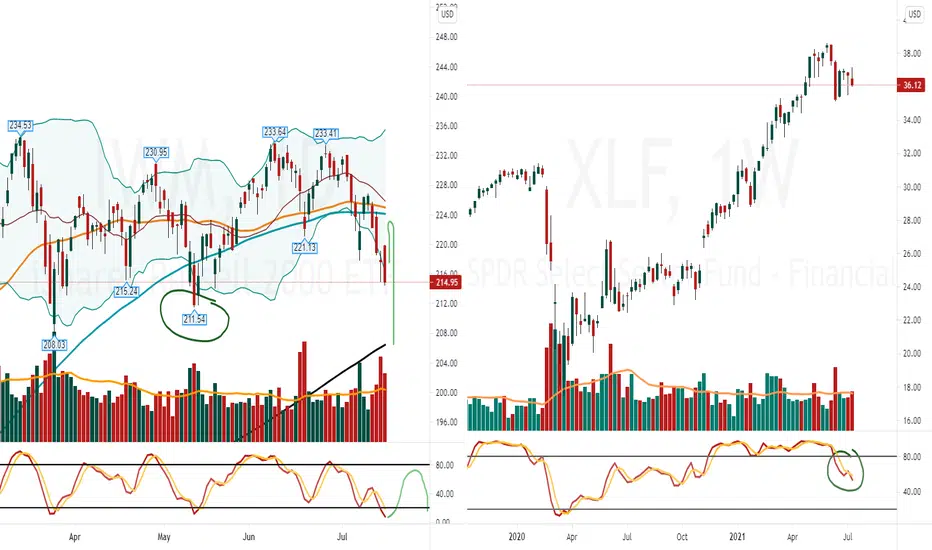
TA on IWM shortIWM a short I am not in this just showing TA
Look daily heading down on bottom should get a dead cat
bounce to the 50 day 225 support 213.58 -211.54
they break we go 206.55 200 day
Know look weekly stoch heading south trend is down
Ok lets go back to daily we can get a rally dead cat bounce 50 day
and fail why as long as that weekly stoch stays heading down while the daily
stoch rises it will fail. Trust that weekly just when it rallies reduce shares on short and trail the rest
then when ready add back to short. Very simple process
Rotation out tech into banks know Swing tradeEARNINGS BANKS START 7/13/2021
Daily prefect buy off 100 day MA 35.66
Stoch heading up
Weekly nice higher lows and stoch turning up
Stop under 100 day ma 35.37 use odd number at the end . Market maker goes after even numbers

New Trend (Directional Bias)I have developed to Simply your lifeNotice is the difference between the other trend indicators available in the market vs the new and improved directional bias indicator. I have prepared to help my friends in this community.
It keeps you in the trade when you have to, not exit you out when there is a short pull back. However, when the pullback is not a fake one, It pulls you out.
FEEDBACK PLS.
I miss this stuff.

Long XLF @ 36.35 off weekly stochlook weekly I shorted at top when it rolled over
took profits when short got to bottom. Know long
Play that stoch to top when ready short it again
Continuously making money.

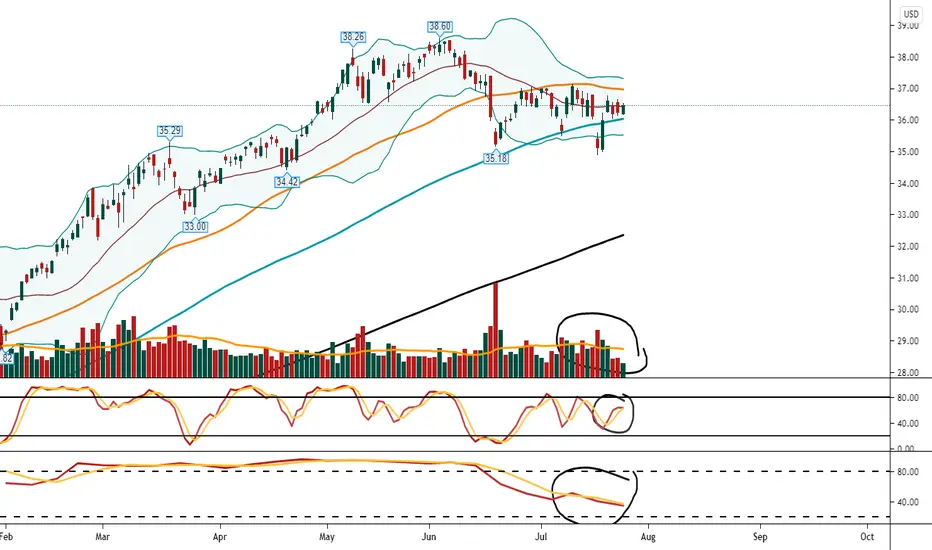
XLF Will be switching from a short to a long Daily says pull back more the stoch
Weekly says careful long but trying turn up