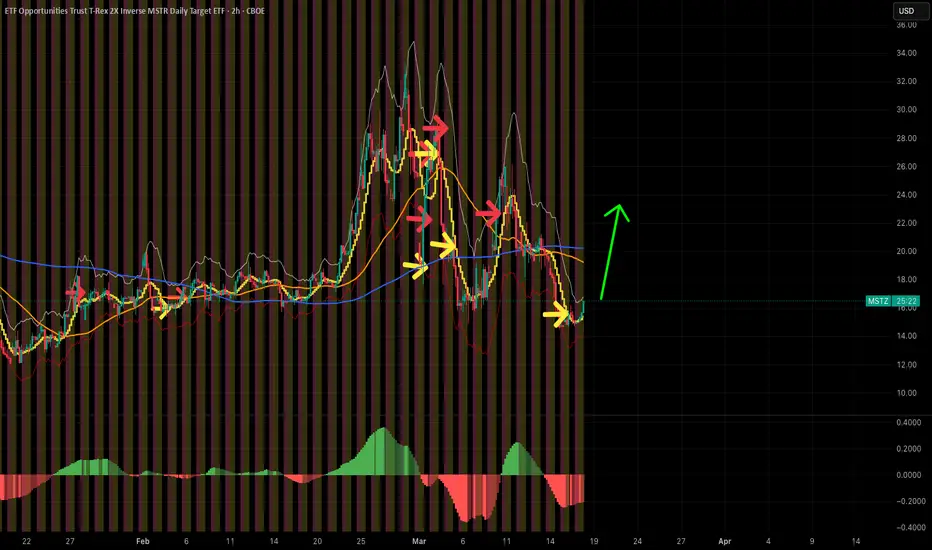
Chart Pattern Analysis Of MSTZ.
From K4 to K6,
It is a strong bullish three soldiers advancing pattern.
It close upon the neck line of potential bullish head-shoulder pattern.
So, I will try to buy it here.
At the same time, I am expecting a retest to the support,
If that is a fact,
I will try to buy it there too.
Long-12/Sto
Key stats
About T-Rex 2X Inverse MSTR Daily Target ETF
Home page
Inception date
Sep 18, 2024
Structure
Open-Ended Fund
Replication method
Synthetic
Dividend treatment
Distributes
Distribution tax treatment
Ordinary income
Income tax type
Capital Gains
Max ST capital gains rate
39.60%
Max LT capital gains rate
20.00%
Primary advisor
Tuttle Capital Management LLC
Distributor
Foreside Fund Services LLC
ISIN
US26923N4135
MSTZ is designed for making bearish bets on the stock price of MicroStrategy Incorporated through swap agreements. The objective is to obtain daily inverse exposure equivalent to -200% of the fund's net assets. To maintain this exposure, daily rebalancing is performed to make adjustments in response to MSTR's daily price movements. As a geared product, the fund is intended as a short-term tactical tool, rather than as a long-term investment vehicle. As a result, returns may deviate from the expected -2x if held for longer than a single day due to compounding. This strategy is high-risk and does not include a defensive position as part of its overall process. It's important to note that the fund could potentially lose money over time, even if MSTRs performance weakens. The fund is expected to hold money market funds, deposit accounts, and short-term debts.
Related funds
Classification
What's in the fund
Exposure type
Cash
Corporate
Bonds, Cash & Other100.00%
Cash80.83%
Corporate19.17%
Top 10 holdings

Trade idea: $MSTZ 2X inverse #MSTRThese measured moves are determined from the #cupandhandle pattern.
There is also a inverse head and shoulders pattern within the CUP section, giving further credence that we shall this pattern perform to target.
And thus see further weakness with #Saylor's #Bitcoin investment vehicle.
What goe
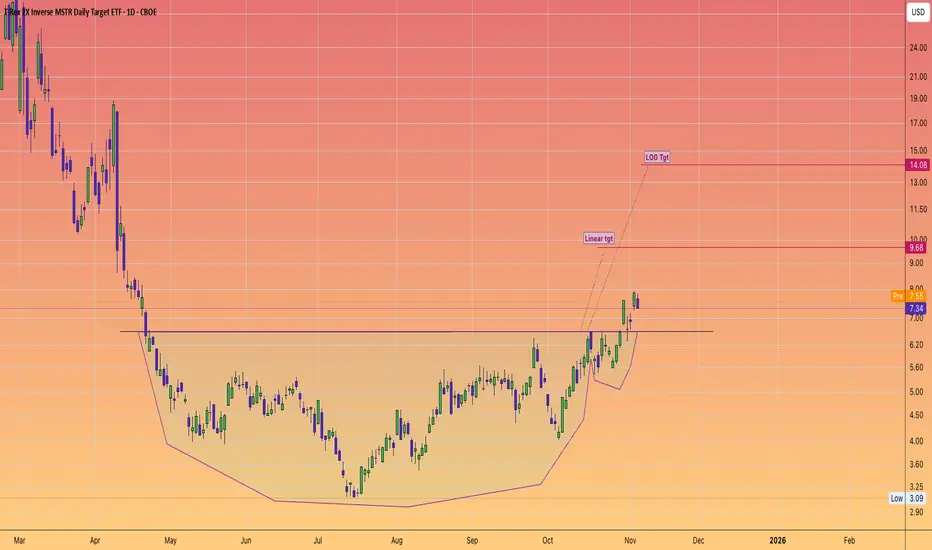
Chart Pattern Analysis Of MSTZ.
K6 close upon the neck line of a potential bullish head-shoulder pattern.
It seems that another bull run will start here to test 0.5fib line or the resistance.
I will try to buy it from 5.6-5.3USD area.
On the other hand,
It is also possible that K6 is just a fake up candle,
If K7 keep climbing u

Interesting play MSTZMSTR has been under a cloud lately, and if we take a closer look at MSTZ we find that it's slowly creeping higher. Notice how SMA50 is crossing up SMA200. This will become a very interesting play when the price crosses below $300.

Final Dump before the PumpWith the expectation that NASDAQ:MSTR will have a final rally in Q4 of this year, MSTZ is forecasted to fall, but should benefit greatly from the year's long bear-market that should ensue for MSTR, starting sometime in mid-to-late Q4.
-95% for NASDAQ:MSTR in 2022 within a 6-months period of 202

Chart Pattern Analysis Of MSTZ
From K1 to K3,
It is a bullish three soldiers advancing pattern,
But unfortunately, it still failed to close upon a nearest resistance.
K3 start with a bull gap and break up a downtrend line of a large scale consolidation range.
If the following candles break up the resistance or consolidate arou

MSTZ looks real fresh like RIGHT NOW! Here's the game plan. BTC drops -> MSTR drops -> MSTZ flies +20%. The trends and volatility repeat itself. Just follow the signs!!
Best of luck and always do your own due diligence!

MSTZ great pump coming your way....don't miss itI picked this up early because I saw it coming and have been following it! There's still plenty of room to profit. Follow the technicals and BTC direction!
Super simple set-up, best of luck and always do your own due diligence to support these ideas!
MSTZ (MSTR inverse)....quick win!BTC has had a nice run, but let's be honest, it won't go to 100k or beyond in a single shot. The volatility will make a pullback, which is typical, and now that it touched the lower BB there's a good probability it will bounce back. This is not a long hold position, but a quick scalp.
Best of luck

10% upside MSTZ BTC will crash again and fall under 80k, and that's when MSTZ will pop. Given where the economy and crypto is, should happen soon.
Best of luck and always do your own due diligence!

See all ideas
Summarizing what the indicators are suggesting.
Oscillators
Neutral
SellBuy
Strong sellStrong buy
Strong sellSellNeutralBuyStrong buy
Oscillators
Neutral
SellBuy
Strong sellStrong buy
Strong sellSellNeutralBuyStrong buy
Summary
Neutral
SellBuy
Strong sellStrong buy
Strong sellSellNeutralBuyStrong buy
Summary
Neutral
SellBuy
Strong sellStrong buy
Strong sellSellNeutralBuyStrong buy
Summary
Neutral
SellBuy
Strong sellStrong buy
Strong sellSellNeutralBuyStrong buy
Moving Averages
Neutral
SellBuy
Strong sellStrong buy
Strong sellSellNeutralBuyStrong buy
Moving Averages
Neutral
SellBuy
Strong sellStrong buy
Strong sellSellNeutralBuyStrong buy
Displays a symbol's price movements over previous years to identify recurring trends.
Frequently Asked Questions
An exchange-traded fund (ETF) is a collection of assets (stocks, bonds, commodities, etc.) that track an underlying index and can be bought on an exchange like individual stocks.
MSTZ trades at 13.84 USD today, its price has risen 7.79% in the past 24 hours. Track more dynamics on MSTZ price chart.
MSTZ net asset value is 14.93 today — it's risen 144.75% over the past month. NAV represents the total value of the fund's assets less liabilities and serves as a gauge of the fund's performance.
MSTZ assets under management is 125.84 M USD. AUM is an important metric as it reflects the fund's size and can serve as a gauge of how successful the fund is in attracting investors, which, in its turn, can influence decision-making.
MSTZ price has risen by 152.11% over the last month, and its yearly performance shows a −34.12% decrease. See more dynamics on MSTZ price chart.
NAV returns, another gauge of an ETF dynamics, showed a 188.78% increase in three-month performance and has decreased by −46.98% in a year.
NAV returns, another gauge of an ETF dynamics, showed a 188.78% increase in three-month performance and has decreased by −46.98% in a year.
MSTZ fund flows account for −42.39 M USD (1 year). Many traders use this metric to get insight into investors' sentiment and evaluate whether it's time to buy or sell the fund.
Since ETFs work like an individual stock, they can be bought and sold on exchanges (e.g. NASDAQ, NYSE, EURONEXT). As it happens with stocks, you need to select a brokerage to access trading. Explore our list of available brokers to find the one to help execute your strategies. Don't forget to do your research before getting to trading. Explore ETFs metrics in our ETF screener to find a reliable opportunity.
MSTZ invests in cash. See more details in our Analysis section.
MSTZ expense ratio is 1.05%. It's an important metric for helping traders understand the fund's operating costs relative to assets and how expensive it would be to hold the fund.
MSTZ is an inverse fund, meaning it's structured to generate returns opposite to the trends of the underlying index or assets.
In some ways, ETFs are safe investments, but in a broader sense, they're not safer than any other asset, so it's crucial to analyze a fund before investing. But if your research gives a vague answer, you can always refer to technical analysis.
Today, MSTZ technical analysis shows the buy rating and its 1-week rating is buy. Since market conditions are prone to changes, it's worth looking a bit further into the future — according to the 1-month rating MSTZ shows the buy signal. See more of MSTZ technicals for a more comprehensive analysis.
Today, MSTZ technical analysis shows the buy rating and its 1-week rating is buy. Since market conditions are prone to changes, it's worth looking a bit further into the future — according to the 1-month rating MSTZ shows the buy signal. See more of MSTZ technicals for a more comprehensive analysis.
No, MSTZ doesn't pay dividends to its holders.
MSTZ trades at a premium (0.13%).
Premium/discount to NAV expresses the difference between the ETF’s price and its NAV value. A positive percentage indicates a premium, meaning the ETF trades at a higher price than the calculated NAV. Conversely, a negative percentage indicates a discount, suggesting the ETF trades at a lower price than NAV.
Premium/discount to NAV expresses the difference between the ETF’s price and its NAV value. A positive percentage indicates a premium, meaning the ETF trades at a higher price than the calculated NAV. Conversely, a negative percentage indicates a discount, suggesting the ETF trades at a lower price than NAV.
MSTZ shares are issued by Tuttle Capital Management LLC
MSTZ follows the MicroStrategy Inc - Benchmark Price Return. ETFs usually track some benchmark seeking to replicate its performance and guide asset selection and objectives.
The fund started trading on Sep 18, 2024.
The fund's management style is passive, meaning it's aiming to replicate the performance of the underlying index by holding assets in the same proportions as the index. The goal is to match the index's returns.