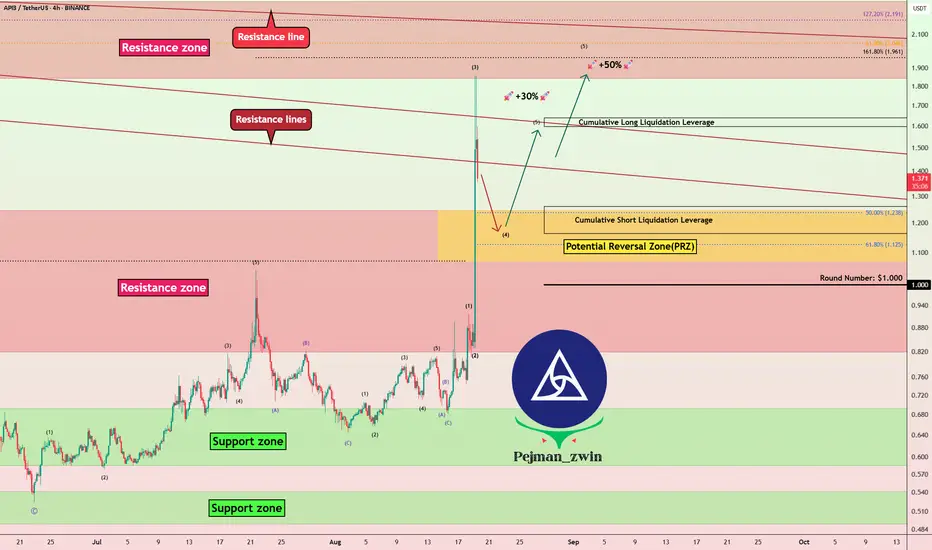
API3 Breaks Resistance – Is the Next Bullish Wave Coming?The listing news of API3 ( BINANCE:API3USDT ) on South Korea’s major exchange Upbit has boosted interest in the project. Starting from August 19, 2025, API3 will be available for trading on both KRW and USDT markets .
Reason for the surge : Being listed on one of the largest Korean exchange
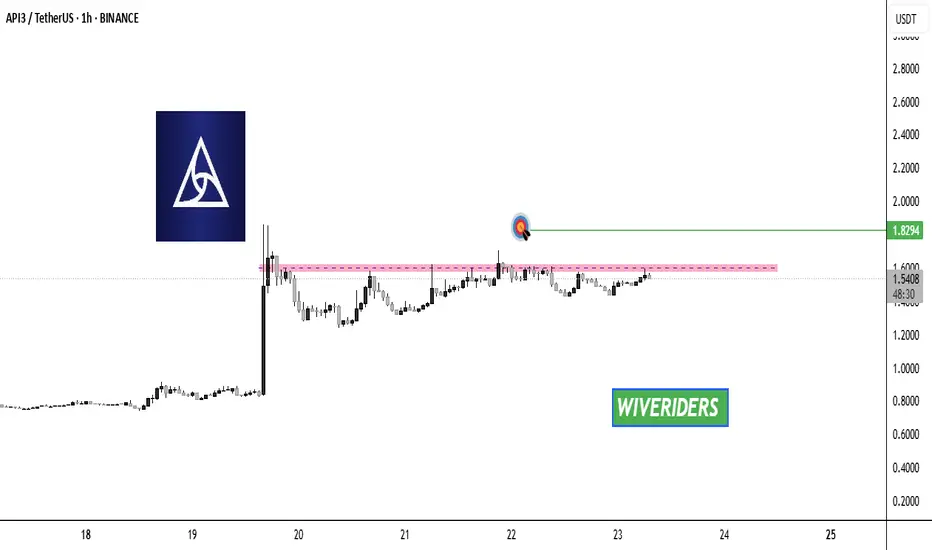
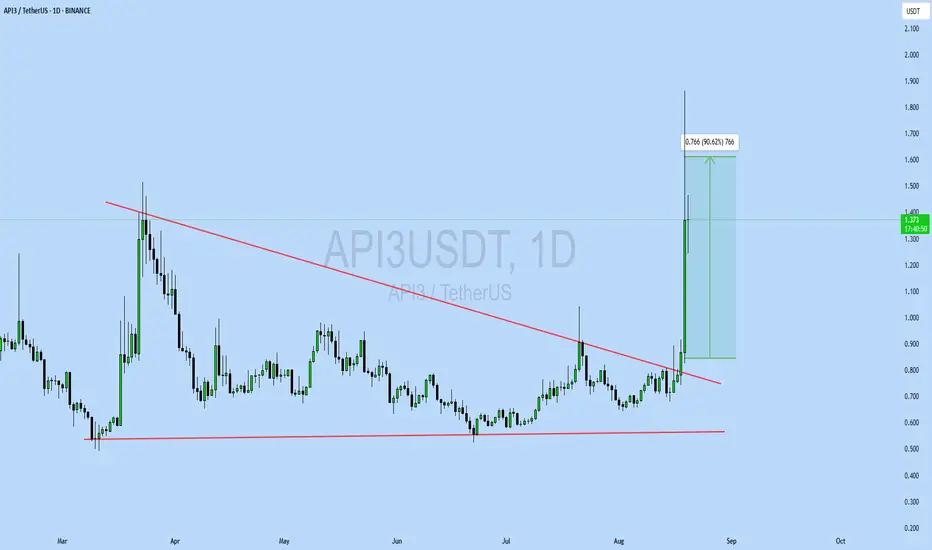
API3 Breakout Alert!🚨 $API3 Breakout Alert! 🚨
$API3 is currently testing the red resistance zone 🔴
If price breaks out, the first target will be the green line level 🎯
A confirmed breakout here would signal bullish continuation and could fuel further upside ✅
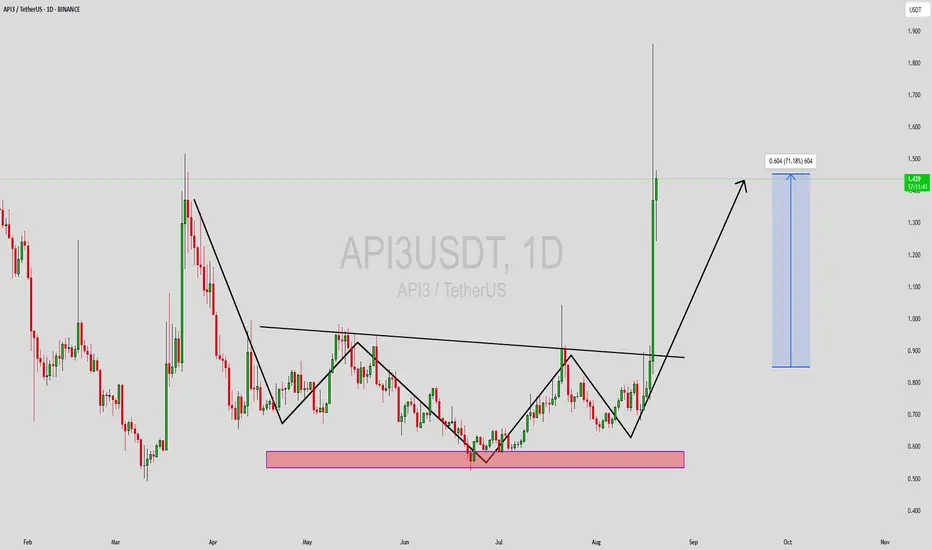
API3USDT Forming Bullish MomentumAPI3USDT has recently broken out of a long-term consolidation range, signaling a strong bullish shift in momentum. The chart clearly shows a breakout from a rounded bottom formation combined with a horizontal resistance level, which has now turned into a strong support zone. This technical structure
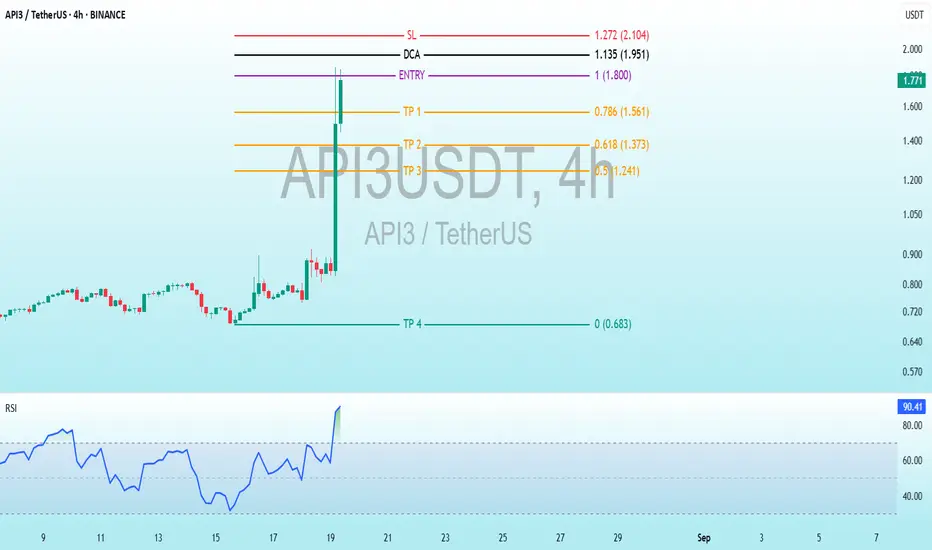
#API3 Rally Peak: 4H Trading Strategy with RSI WarningBINANCE:API3USDT
Trading Levels:
Entry: 1.00 (1.800 USDT) - The level where the initial purchase is planned.
DCA (Dollar-Cost Averaging): 1.135 (1.951 USDT) - An additional buying point if the price rises.
SL (Stop Loss): 1.272 (2.104 USDT) - The level where the loss would be limited.
TP (Take Pr
OGNUSDT UPDATE#OGN
UPDATE
OGN Technical Setup
Pattern: Bullish Wave Pattern
Current Price: $0.0649
Target Price: $0.10
Target % Gain: 51.61%
Technical Analysis: OGN is showing a bullish wave formation on the 1D chart, with higher lows and strong upward momentum. Price has reclaimed key support near \$0.06
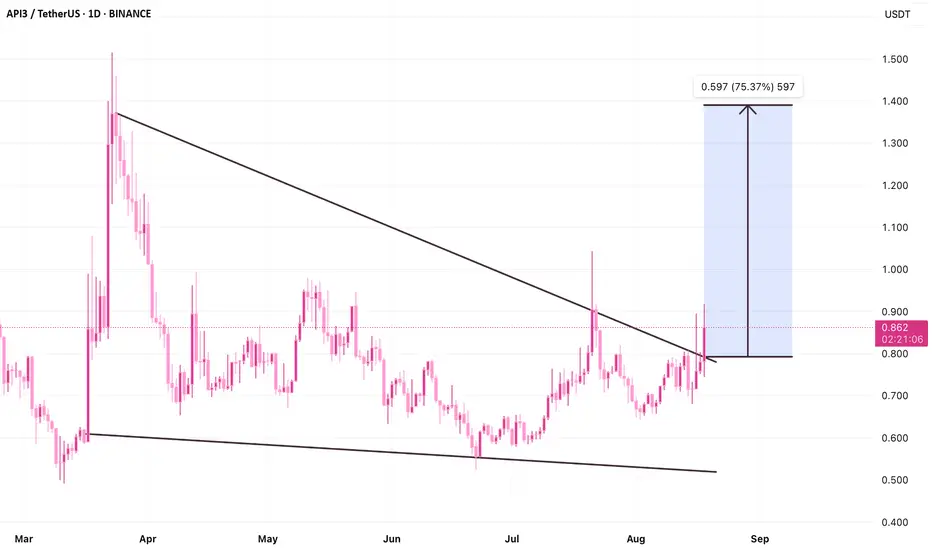
API3/USDT – Bullish Breakout: Falling Wedge Targets +73%API3 has broken out of a multi-month falling wedge pattern, confirmed by a strong daily candle closing above the upper trendline. Current price is 0.867 USDT, up +11.01% for the session.
The measured move from the wedge projects a potential target near 1.50 USDT (+73% from breakout). Price action s
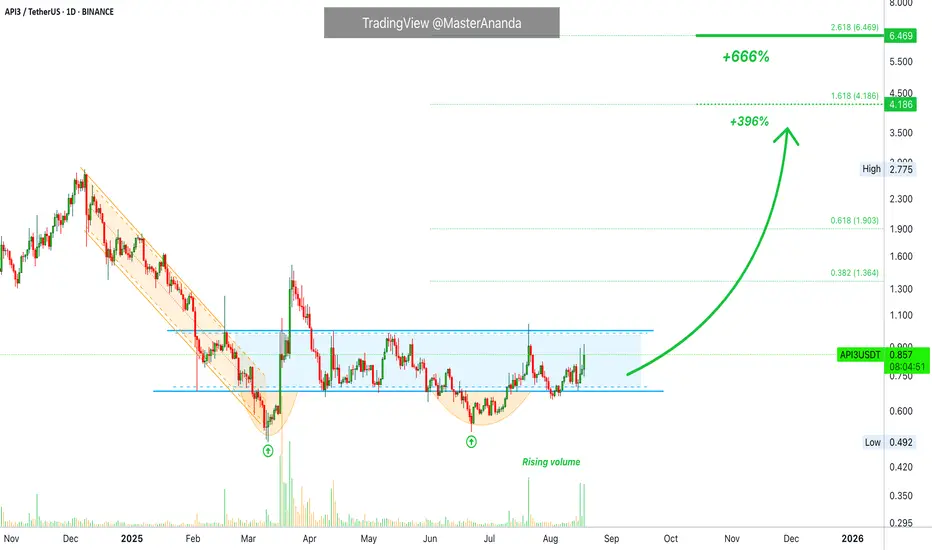
API3 666%API3 has been sideways for 196 days, 6.5 months, a very long time. It is interesting to notice the final portion of the bearish wave is part of the sideways phase. Between 3-February and 11-March.
API3USDT has been quiet for months. Only neutral action. Sideways.
There is first a higher low. The f
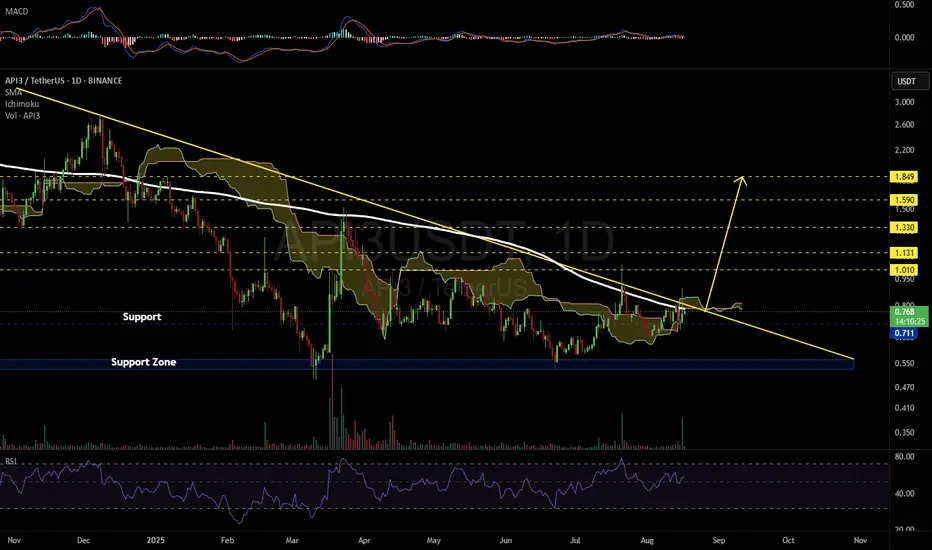
API3USDT 1D#API3 is moving inside a descending triangle on the daily chart. Consider buying some #API3 at the current price and near the support level of $0.711. In case of a breakout above the resistance cluster — which includes the triangle resistance, the daily SMA200, and the Ichimoku cloud — the potential
API3/USDT: The Ultimate Bounce Setup!📊 CURRENT SNAPSHOT 🔍 KEY TECHNICAL LEVELS
🟡 CRITICAL RESISTANCE ZONES
Major Resistance: $0.800 - Key breakout level
Secondary Resistance: $0.900 - Previous support turned resistance
Target Zone: $0.585-$0.536 - Golden pocket area
🔵 CURRENT BATTLE ZONE
Price: $0.664 - Testing key support
Descending

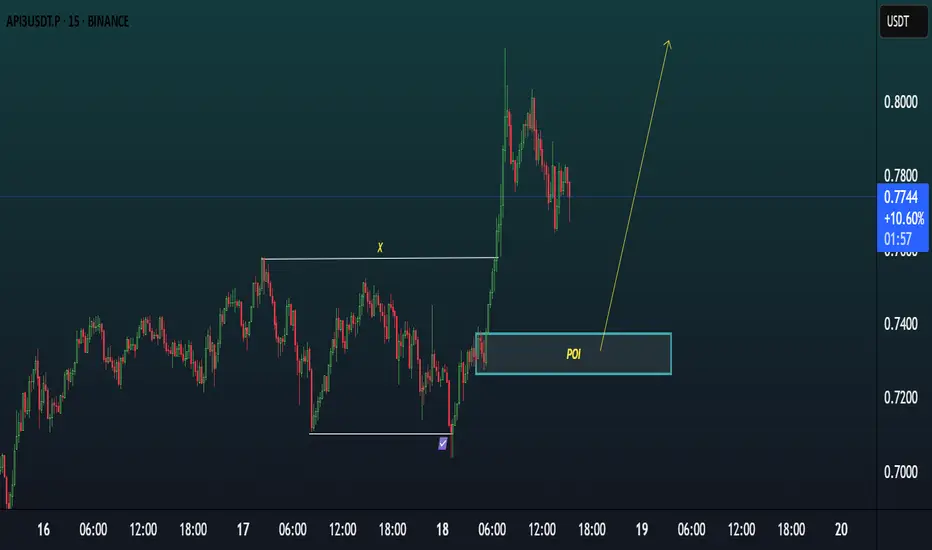
CHART OVERVIEW OF API3USDTChart Overview
Pair: API3/USDT.P
Timeframe: 15 Minutes
Current Price: 0.7728
Market Bias: Bullish (expecting a pullback into demand before continuation)
📌
Setup Summary
Strategy: Smart Money Concept (SMC) + POI (Point of Interest) + Break of Structure
POI Zone: 0.7350 – 0.7425 approx (marked w
See all ideas
Summarizing what the indicators are suggesting.
Oscillators
Neutral
SellBuy
Strong sellStrong buy
Strong sellSellNeutralBuyStrong buy
Oscillators
Neutral
SellBuy
Strong sellStrong buy
Strong sellSellNeutralBuyStrong buy
Summary
Neutral
SellBuy
Strong sellStrong buy
Strong sellSellNeutralBuyStrong buy
Summary
Neutral
SellBuy
Strong sellStrong buy
Strong sellSellNeutralBuyStrong buy
Summary
Neutral
SellBuy
Strong sellStrong buy
Strong sellSellNeutralBuyStrong buy
Moving Averages
Neutral
SellBuy
Strong sellStrong buy
Strong sellSellNeutralBuyStrong buy
Moving Averages
Neutral
SellBuy
Strong sellStrong buy
Strong sellSellNeutralBuyStrong buy
Displays a symbol's price movements over previous years to identify recurring trends.