#api3 The confirmation of a breakout and retest in a descending channel suggests an anticipated bullish wave of 150-170% in the upcoming days.
Trade ideas

🌟🔍 API3's Bullish Signs 📈🔐🌟🔍 TradingView Analysis: API3's Bullish Signs 📈🔐
🔺 API3 in a Weekly Correction Triangle: API3 is currently in a corrective triangle in the weekly timeframe. Notably, there has been significant buying volume in recent weeks. The decreased volume during the last three weeks of red candles is a positive sign for potential upward movement.
🌐 Daily Timeframe Movement: The coin is showing a curved movement in the daily timeframe, but it's not parabolic. It responds well to this curved line, but opening positions based on this reaction isn't part of my strategy.
📈 Entry Strategy: For short-term entries, I plan to enter a long position or buy spot after breaking the daily resistance at $1.591.
🔑 Key Resistance and Monthly Box Entry: Once it breaks the trend line and the $1.591 resistance, API3 will enter a monthly box, with a crucial resistance at $2.443.
🛒 Long-Term Buying Strategy: For a long-term portfolio or hold, it's advisable to buy after surpassing $2.443 to ensure a confirmed bullish trend.
🔍 Important Daily Resistance: Keep an eye on the daily resistance at $1.921.
📊 RSI Oscillator Support: The RSI is finding important support at 40, which could sustain the price.
🚦 Caution in the Triangle: As long as the price remains above $1.272, it's better not to buy within the triangle until it exits the consolidation phase.
🔑 Related Categories:
Triangle Patterns
Volume Analysis
Oscillator Analysis
📣 What’s your perspective on API3's market movement? Let's discuss strategies! 💬🌐 #API3Analysis #CryptoTrends #TradeCityPro
📚 Remember: Cryptocurrency investments are subject to market risks. Always conduct thorough research and consider your risk tolerance! 🧠💼

🚨 Trade Alert: API3/USDT (3-5x)🚨 New Trade Alert 🚨
✅ API3/USDT (3-5x)
📉 LONG Entry Zone: 1.36 - 1.4768
⛔️ SL: 1.3048
🔒 Breakeven Move: When it moves close to TP2
🎯 Take Profit:
Short Term: 1.495 - 1.51 - 1.54 - 1.58 - 1.62
Mid Term: 1.66 - 1.70 - 1.75 - 1.80 - 1.84
📝 Ensure you set entry orders to balance the trade's entry and aim to secure 30% of profits within the first two targets. Once profits are gained, adjust the stop orders to match the entry points or break-even levels.
⚠️ Disclaimer: Historical earnings cannot assure future outcomes. Is there a potential for risk? Certainly. The entire financial market is susceptible to uncertainties; any underlying factor or abrupt shift in market sentiment could overturn the current market trends and lead to losses. Refrain from undertaking undue risks that might jeopardize your financial stability. You are under no obligation to engage in this trade; kindly avoid the trade if you disagree with the trade analysis.
GIS TRADING®

APII3 is Bullsh but needs to...API3 is bullish but it needs to breakout the trend and closes above it
we have
. 2 main trends a
. Shark pattern
. Bullish indicators
It may retest the OB area before it breaks out
All the best insha Allah

Short to Mid term $API3 Idea %20-%70 possible gainsThing looking good for API3. If it can breakout of the triangle and retest, explosive moves may happen!Bollinger bands narrowed! It looks like ready for the big action. So far it is moving above the Ema20,Ema50,Ema100,Sma15 lines. Ema 200 sitting at $1.21range . If price action progress the way it should, we may see golden cross shortly on the daily chart.Only 100 million market cap coin! Short term target is $1.3-$1.5 range , Mid term target is $1.9.

#api3 will explode someday?- Very well accumulated.
- Trend support for 4 times
- Falling wedge and rested RSI
These are good signs. Breaking down the wedge is the invalidation and road to Magma.
NOT FINANCIAL ADVICE.

Pullback is the time to join the race | Long BiasChart 4H TF
BINANCE:API3USDT has broken and closed above resistance at 1.14
Now, it's pulling back and trading to 1.124 now
API3 has support around 1.07 this level is supported by ascending trend line begin from 0.83
Besides, API3 has Fair Value Gap around 1.1
Wait for next move

API3 4h scalp Once it closes above the channel, it will be heading to the target or maybe little more...
Stick to your SL 4h below he red line because of the FED today.
All the best insha Allah!

API3USDTAPI3USDT has started new bullish trend.
As the market is consistently printing new HHs and HLs.
currently the market is retracing a bit after last HH, which is also the 38% fib retracement level and the previous broken resistance might be turning as a support. if the market successfully sustain this bullish confluence the next leg high could be 1.12

API3 LONG SIGNAL 30MINHello dear traders
In api3 currency, we can look for long positions in 15 and 30 minute time frames.
The formed pivot has good credibility and even though the trade is in the opposite direction, there is a possibility that the price will grow.
Thank you for your support
Be profitable and happy

API3USDT pullbackHit a high TF level so the expected pull back can be decent. Target 1 is where I'd take profits and try to short

API3USDT analyzing the Potential Upsurge🚀🚀Analyzing the Potential Upsurge of API3USDT:
API3USDT, currently priced at $1.068, exhibits several indicators that suggest the possibility of an upward trajectory in its value.
1. Steady Price Growth**: Over the past few weeks, API3USDT has demonstrated a consistent pattern of price growth. This steady increase in value can be indicative of growing demand and positive sentiment among investors.
2. Support at Key Levels**: Technical analysis reveals that API3USDT has found support at key price levels, which has prevented it from significant declines. This support suggests that there is strong buying interest at these levels, reinforcing the bullish outlook.
3. Trading Volume**: An increase in trading volume often precedes significant price movements. If API3USDT experiences a surge in trading volume alongside its price increase, it may signal a more substantial rally.
4. Positive News and Developments**: Positive news surrounding the project, such as partnerships, technological advancements, or adoption in the blockchain space, can be a catalyst for price appreciation. Staying informed about recent developments in the API3 ecosystem is crucial.
5. Market Sentiment**: Monitoring social media channels and cryptocurrency forums for sentiment analysis can provide insights into how the community perceives API3USDT. Positive sentiment can fuel buying interest and drive prices higher.
6. Resilience to Market Volatility**: API3USDT's ability to maintain its value during periods of market volatility can be a positive sign. It suggests that the coin has strong fundamentals and a dedicated investor base.

API3usdtAPI3 long position.
Disclaimer: The trading signals provided are for informational purposes only and should not be considered as financial advice. Trading in financial markets involves substantial risk and is not suitable for all investors. Past performance is not indicative of future results. The sender of these signals is not responsible for any losses incurred due to trading decisions based on the provided signals. Traders are advised to conduct their own research and seek advice from qualified financial professionals before making any trading decisions

API3USDT There is only one scenario that will happen out of the BINANCE:API3USDT
after we analyzed the currency and said that the price will fall exactly what we said before happened.
now After the currency fell to the 0.618 Fibonacci level it was a good support area, and then the price returned to the 0.5 area and retested it.
Now There is only one scenario that will happen out of the two :
Scenario 1: If the price corrects above the 0.5 area, the price will rise to the 0 area or more until the -0.272 area.
Scenario 2 If the price could not stabilize above the 0.5 area and corrected below it, the price will drop 1 Fibonacci level or a little higher, but the likely one is 1 Fibonacci because it is a previous demand area

API 3 4HAPI 3
It is in an ascending pullback If it can close above the 1.2262-1.2505 range We will continue the upward trend with the goals I specified I am Amin, a financial market analyst Follow to be updated

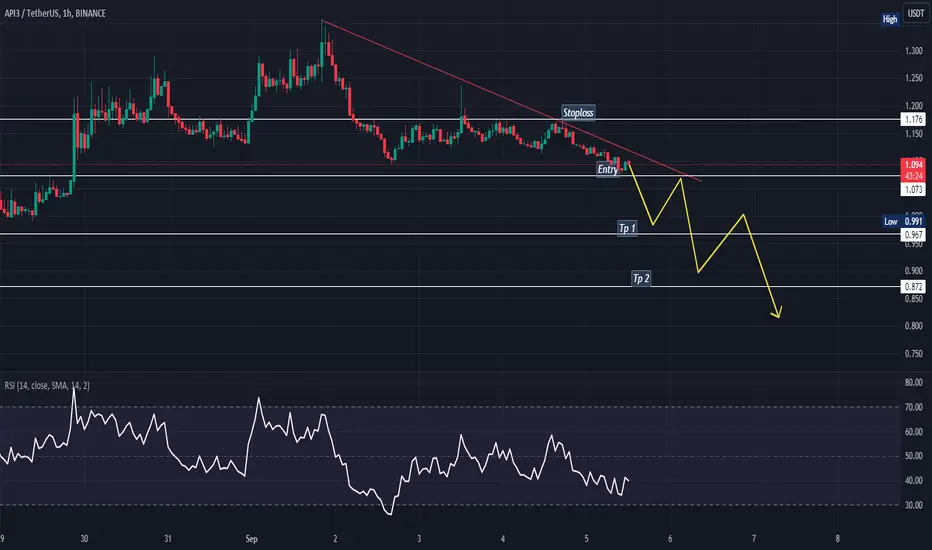
API3USDTAPI3USDT is in bearish trend.
Printing LH and LL.
NO sign of reversal from here this may indicates price may go down.
We wait and watch for the breakout of last LL.

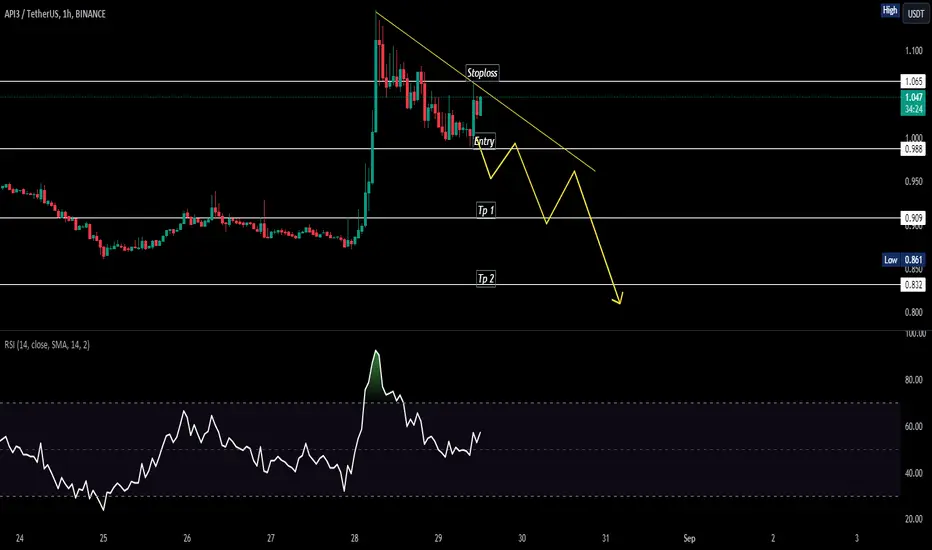
API3USDT I'm bearish BINANCE:API3USDT
we had a 5 waves bullish till the supply zone and the resistance on fib we have also a bearish confirmation at RSI indicator,i think the price will be rejected at this level and wwe will crash till level 0.5 on fib or even more

$API3 to $1.6Inverse and shoulders.
Elliott waves further supports the significance of this structure.
Don’t underestimate this coin even in a bear market, super resilient to BTC dumps.

API3 retest below 0.9?Hello friends, I don't know what the condition of BTC will be and whether we will really test lower levels and GAP around 22-20k, however if so I expect something similar with API3.
It's clean, SL above breakout and profit in two parts + be patient.
Of course, I'll explain the situation you described in English.
An ascending triangle is a technical analysis pattern used in trading various assets, including cryptocurrencies. It consists of two trendlines: one is a diagonal trendline connecting the highs of price points, and the other is a horizontal level representing a certain resistance or support.
The drop in the price of the API3 cryptocurrency from the ascending triangle and the subsequent testing of the ascending trendline can have a few implications:
Breakout of the Ascending Triangle: A drop in price outside the triangle pattern can signal weakening demand or a change in trend. If the price of the API3 cryptocurrency fell below the lower diagonal line of the triangle, some traders might believe that the ascending trend has been disrupted and a price decline might follow.
Testing the Ascending Trendline: After breaking out of the ascending triangle, the price might attempt to test the previously diagonal trendline as a new resistance level. This is a common scenario; if the price doesn't stay above this line, it could confirm that the earlier upward trend has been broken.
Expectation of Price Decline: From your explanation, it seems you expect the value of the API3 cryptocurrency to decrease. This expectation could be based on technical analysis, where you observed the breakout from the ascending triangle and the subsequent testing of the ascending trendline. This might suggest that the market lacks the strength to sustain the price at a higher level and a decline could follow.

API3/USDT Potential Upward Movement to Take a Bearish OB ??Hello Paradisers, One to Watch Potential coin!
💎After encountering resistance at a pivotal support zone, API3 seems poised for a rebound toward the Bearish Order Block.
💎Historical data shows that API3 has previously experienced significant gains after touching this key support, followed by a sharp decline upon hitting a strong supply zone. The presence of substantial accumulation at this support level suggests that history could repeat itself.
💎However, if API3 fails to hold its ground at this crucial support, the scenario could be invalidated, potentially leading to a new lower low.

API3USDTAPI3USDT is in bearish trend.
Potentially printing LH and LL.
No sign of trend reversal here.
We further confirm that if it breaks the last LL then trend will potentially going down.
#API3/USDT breaks the Diagonal Trendline in 4-Hour TF!#API3/USDT breaks the Diagonal Trendline in 4-Hour TF!
NASDAQ:API is heading towards a retest of the Diagonal Trendline and PWH. In case of successful retest, it will pump.
