APT - Bullish Accumulation?I can't ignore the much higher than normal volume on APT over the last 90 days with much of the accumulation occurring near the lows especially after it read oversold on the RSI. If it breaks its early Dec highs, it could be an interesting swing long. Nice upside potential.
What traders are saying

Aptos Bullish Divergence: Targeting $4.3–$15 Range Aptos has stabilized above the last weekly support; currently, there is a bullish divergence on the weekly chart, so all signals point to a likely upward push. The current range to play is $4.3–$15, and the risk-reward in this case is really good. Thanks to everyone for your attention.

Aptos Wave Analysis – 5 December 2025
- Aptos testing major support at 1.688
- Likely to fall to support level 1.5000
Aptos cryptocurrency has been falling strongly in the last few trading sessions inside the minor impulse wave B from the end of October.
The active wave B belongs to the medium-term ABC correction (B) from the start of October.
The price is currently testing the major support at 1.688 (monthly low from October) – the breakout of which can lead to further losses toward 1.5000.

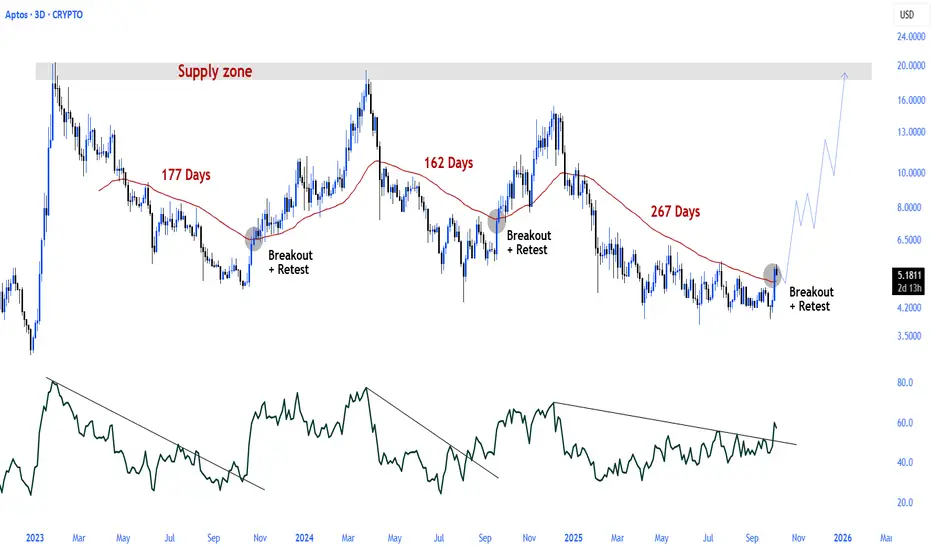
$APT \ Aptos Aptos, which previously initiated a strong rally following a breakout and retest of the 55 EMA, has now achieved a similar breakout 267 days later.
There is also a structural breakout in the RSI.
The outlook points to the start of a new run.
APTUSD Long IdeaAptos is looking interesting down here for a long. Very easy to manage your risk. Sellers have failed to push the price lower and now you can see these subtle higher lows locally. Additionally, there is Class "B" or Class "C" Bullish divergence on both the RSI and MacD here on the daily time frame, and it looks like a downsloping supply line was broken recently. Once/if $4.70 breaks, it should be a quick ride to $5.43 minimum. Targets derived from inflection points looking left, which also happen to line up with common retracement target fibonacci levels. Let's see what happens.
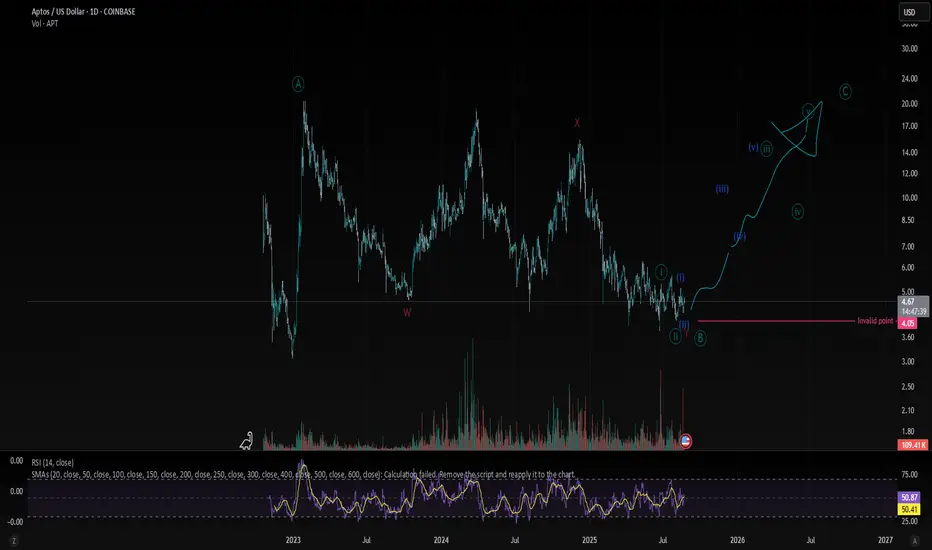
APT: Get Ready for the Bullish C-Wave ImpulseMy Elliott Wave count on APT shows a completed zigzag pattern. We've seen a clear A-B-C structure, and it appears the corrective B-wave has ended. The final C-wave impulse is now beginning.
This C-wave is a powerful, five-wave motive move to the upside, which often has a 1:1 relationship with the A-wave. I am expecting a significant bullish rally from this point.
Key Point: My analysis is invalidated if the price drops below $4.01. A break of this support would suggest a different market structure is at play.
Invalidation Point: $4.01
Disclaimer: This is an educational analysis based on Elliott Wave Theory and not financial advice. Trading involves risk, and you should always do your own research.
APT 4H – Holding the Higher Low, But Will Bulls Follow Through?APT is holding at a critical demand zone, testing both trendline support and prior consolidation structure.
Price action is forming a potential higher low, with a bullish reaction candle and a sharp Stoch RSI reversal from oversold.
🧠 What to Watch:
– Breakout from descending structure
– Higher high confirmation above $4.60
– Volume follow-through on breakout
This setup offers clean risk: a breakdown invalidates quickly, but if buyers step in here, it could fuel a sharp leg back to $5+.

APT - HUGE POTENTIAL (130+% SPOT) You probably forgot about this altcoin but it is justified. Downtrend since 2023 and lower highs, lower lows but....
If we look more close and use tool fixed price volume we can see that price is above VAL (Value area low), we had break through but price returns..Also good reaction of FVG (Fair value gap).
Now, we can try buy this coin and have some stop lose. Price is in range 172 days and all people forget abut this coin. Analysis is right only if we close daily candlestick about 6$.
Stop lose can be below 4.4$ which is 6-7% of losing.
Second entry is monthly level at 3.3 and stop lose should be below the lowest low 3$.
For me is great opportunity because risk reward is excellent.
Ivan

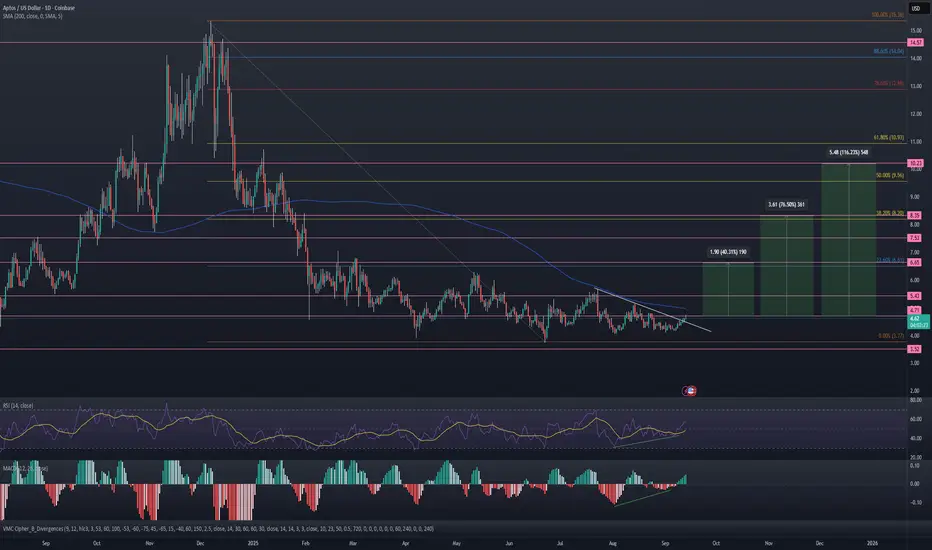
APT-Setup for another macro bullish swingStrictly looking macro time frames we can see APT is setup for another bullish swing to retest 100% Fibonacci near $14.90
Super Trend still flashing bearish red signals but this looks to be reverting soon as price ticks up closer to a 200MA convergence.
Breakout above $5.24 pivot: APT closed above the 23.6% Fibonacci retracement ($4.99), turning it into support.
Bullish indicators: MACD histogram at +0.076 (strongest since July 12) and RSI14 at 65.43 (neutral-bullish).
Liquidation clusters: A push above $5.60 could trigger $4.2M in short liquidations (next key resistance at $5.80 Fibonacci extension).
Supporting factors
: Hyperion’s RION tokenomics, The Aptos-based decentralized mapping project unveiled its token distribution (30% liquidity incentives), driving speculation about airdrop farming.
Shelby network growth: Aptos Labs’ partnership with Jump Crypto for decentralized storage saw $1.3B in stablecoin inflows and record DEX volumes ($5B/month).
Conclusion:
APT’s rally reflects a blend of macro tailwinds, technical momentum, and ecosystem developments – though its 79.78 RSI7 suggests overheating risks.
APTUSD – Recovered and RechargingAPT broke out from $4.70 base and surged to $5.30+. After a deep pullback, it formed a solid V-bottom and reclaimed $5.00 quickly. Price now moves with strength toward previous high. The breakout level to clear is $5.25–$5.30 for fresh leg up.

APTUSD – Reloaded or Rejected?Aptos saw a textbook pump-dump-reclaim move. After peaking near $5.30 and crashing, it double-bottomed and reclaimed the $4.90 zone. Since then, we’ve seen a higher low form. If bulls push through $4.95, it opens $5.10+ again. Below $4.83, the structure weakens.

APT Bullish Breakout Holding Above $5.00APT made a strong breakout from $4.60, surging past $5.20 before pulling back. The climb was supported by strong impulse candles, and the pair is now ranging between $5.05–$5.15. If $5.00 holds, the bulls may resume control.
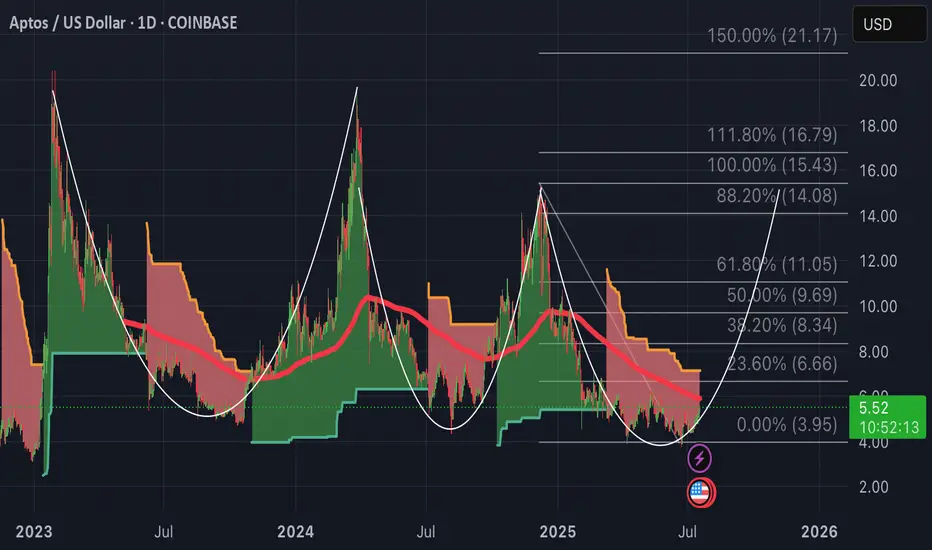
APTOS Stock Chart Fibonacci Analysis 051825Trading Idea
1) Find a FIBO slingshot
2) Check FIBO 61.80% level
3) Entry Point > 5.1/61.80%
Chart time frame: C
A) 15 min(1W-3M)
B) 1 hr(3M-6M)
C) 4 hr(6M-1year)
D) 1 day(1-3years)
Stock progress: A
A) Keep rising over 61.80% resistance
B) 61.80% resistance
C) 61.80% support
D) Hit the bottom
E) Hit the top
Stocks rise as they rise from support and fall from resistance. Our goal is to find a low support point and enter. It can be referred to as buying at the pullback point. The pullback point can be found with a Fibonacci extension of 61.80%. This is a step to find entry level. 1) Find a triangle (Fibonacci Speed Fan Line) that connects the high (resistance) and low (support) points of the stock in progress, where it is continuously expressed as a Slingshot, 2) and create a Fibonacci extension level for the first rising wave from the start point of slingshot pattern.
When the current price goes over 61.80% level , that can be a good entry point, especially if the SMA 100 and 200 curves are gathered together at 61.80%, it is a very good entry point.
As a great help, tradingview provides these Fibonacci speed fan lines and extension levels with ease. So if you use the Fibonacci fan line, the extension level, and the SMA 100/200 curve well, you can find an entry point for the stock market. At least you have to enter at this low point to avoid trading failure, and if you are skilled at entering this low point, with fibonacci6180 technique, your reading skill to chart will be greatly improved.
If you want to do day trading, please set the time frame to 5 minutes or 15 minutes, and you will see many of the low point of rising stocks.
If want to prefer long term range trading, you can set the time frame to 1 hr or 1 day.

Aptos H&S in the making
Aptos H&S in the making
Target $8.20 if this turns into a bottom here—probably in a week or two. AMEX:APT long in place but might get a strong wick down first.

APT: The Solid Range#Aptos is a solid project that has traded within the same range ($3–$20) since its late 2022 launch.
Currently, #APT is in the demand zone of this long-term range.
A strong rebound is likely from current levels as long as $3 holds as the stop-loss.

Aptos (APT)Aptos is a new project in crypto market with a lot of attention as well as features to offer. There is not much price candles to tell the big picture pattern; but as can be seen after APT made a harmonic pattern, it went into a corrective phase which seems unfolded in a complex two a-b-c pattern. Please note that this corrective wave might take longer to finish and get more complex. Anyway, we need to see the minor downtrend line break as the first signal for upward continuation. Let's see what happens.

Aptos (APTO) Price Momentum
🚀 Aptos (APTO) Price Momentum Update
📉 As of April 2025, Aptos is testing a critical price zone! Is the support holding, or are we in for another dip? Let’s dive into the charts:
📊 Key Resistance Levels: $20 – Watch for breakouts.
📉 Critical Support: $15 – Keep an eye on these levels for buying opportunities.
RSI Alert: Currently at 42 – this could signal a potential bullish reversal soon!
🔥 Active Users Impact:
Active users on the Aptos network are seeing an upward trend, with a steady increase in transaction volume and wallet activity. More users mean more demand and more price action potential, driving the price upwards as adoption grows!
📈 Active User Growth: Up by X% in the last month (or week). This surge in activity correlates with a potential price move upwards as increased demand puts pressure on supply.
🔄 Follow the trend and stay ahead of the market!
💬 What do you think, will Aptos continue to climb or take another hit? Let us know below!

(APT) aptos "ahead of the game, or not"It is not use in being ahead of the price trend if the price is not going to recovery before Bitcoin, Ethereum, Dogecoin. Dogecoin used to be the one to measure between the big three cryptocurrency prices. Nowadays, Dogecoin is so popular with such a strong price hold and the fact that the unlimited coins means to measure Dogecoin is quite a bit more strange when compared to all the other limited circulating supply companies. Aptos appears to be closer to a neutral position, or will the price keep falling if Etherum and Bitcoin do not go flat? That is what I mean by this.

APTOS Bull SetupAptos is within this nice symmetrical triangle and is looking to break out
This break out will be big pushing price into the double digits
Great setup for an entry currently
This is a new account I have made, still Bixley.
Weekly timeframe

APT/USDT Triple Bottom.
📊 Triple Bottom Pattern on the APT Chart:
🔵 The Three Bottoms:
Bottom 1: around Dec 2022
Bottom 2: around Oct 2023
Bottom 3: Mar 2025 (current low)
→ All three formed within the major support zone around $4.8–$6.2.
🟣 The Resistance (Neckline):
The key resistance is around $8.0–$8.3 (also the Ichimoku cloud edge).
If the price breaks above this level, it will confirm the Triple Bottom breakout.
🎯 Target Price After Breakout:
Height of pattern = $8.3 – $5.0 = $3.3
Target = $8.3 + $3.3 = ~$11.6
Longer-term potential: $20, as suggested by the arrow in the chart.
🔥 Supporting Bullish Signals:
Indicator Signal
RSI Forming higher lows
MACD Bullish crossover forming
Volume Increasing at the lows
Heikin Ashi First strong green candle after downtrend
📌 Conclusion:
The chart fits the criteria for a Triple Bottom pattern. If APT breaks above the $8.3 neckline, it could trigger a strong bullish move, with a first target around $11–12, and potentially $20 in the long run.

APTOS priced long term bottom. Perfect long here.Aptos / APTUSD is trading inside a Triangle since its very first low historically and the price seems to be stabilizing after February's Low on its bottom.
In the meantime, it is double bottoming on the 1.5 year Support Zone with the 1week RSI formation common on all prior bottoms.
Buy and target 15.00 (Resistance A).
Follow us, like the idea and leave a comment below!!

$APTAMEX:APT
Timeframe: D
At the start of 2024, a triangle formation. It is quite possible that it has already been formed. The potential of the pattern is around 30.00.
#Aptos #APT

What I expect from APTOSPretty easy chart and definitely breaking the disappointment line ( orange one ) will lead aptos to higher 50$ this year , if you have some of that juicy peach just grab onto it and wont let go , green rectangle could be recognised as the last chance to grab tho unfortunately unlikely.
Dyor boy .
