APTUSDT bearish structural bias* Structural Break (MSS 4H at 5.107): The most significant piece of evidence is the Market Structure Shift (MSS) on the 4-Hour chart. This break confirms that the long-term trend has officially reversed to bearish.
* Path Cleared (Liquidity Voids Filled): The Liquidity Voids (price gaps/inefficiencies) across the 4H, 2H, and lower timeframes (down to 15m) have all been filled by the price action. This removal of major imbalances means there are no structural obstacles left to impede the current move to the downside.
* The Next Target (Price Magnet): The market's structural goal is the Bullish Unicorn Model zone (the Order Block/FVG between 4.780 and 4.646). This un-mitigated zone acts as a powerful Price Magnet, drawing the price lower to eventually execute buy orders there.
APTUSDT.3L trade ideas

#APTUSDT 40% Movement Plan#APTUSDT 40% Movement Plan.
Like Somi and Mito, Aptos may also join the pump race. The same condition applies — it must hold the green box well. All other coins will also depend on BTCD. For the long term, we are not holding any coins right now. According to our analysis, Solana could fall to around \$70–80 and Ethereum to around \$2500 in the coming time.
$$ Ram Ram $$

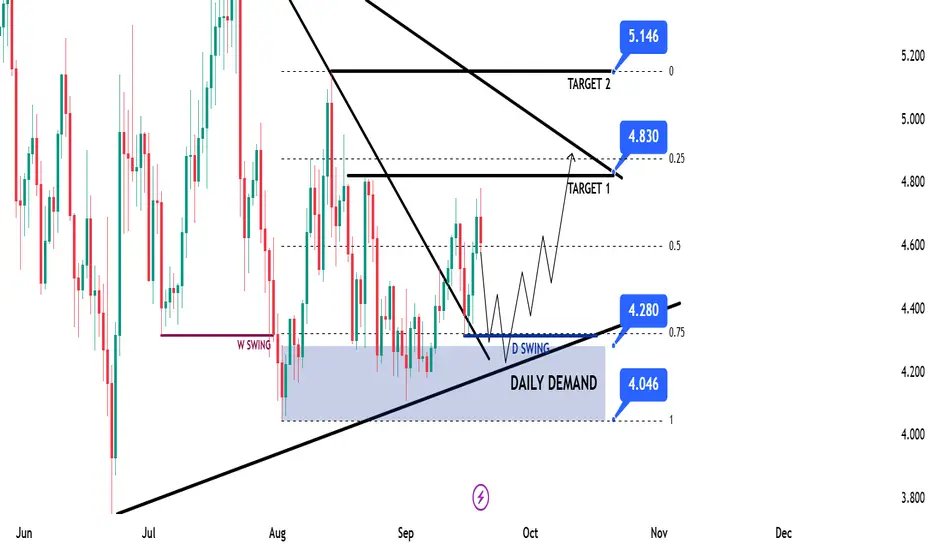
APT Swing Long IdeaAPT Swing Long Idea
📊 Market Sentiment
FED has resumed its rate-cutting cycle, starting with a 0.25% cut in September, with two more 0.25% cuts expected in the coming months. Additionally, institutional liquidity inflows have accelerated as the U.S. officially adopts crypto as part of its reserves. While inflation remains elevated, the weakening labor market is forcing the FED to ease, driving more capital into risk-on assets.
📈 Technical Analysis
Price ran HTF liquidity and got rejected, creating a strong Daily Demand Zone.
This zone is further supported by the HTF bullish trendline, so I will only look for longs as long as the HTF bullish structure holds.
📌 Game Plan
1-Price to revisit and reprice the Daily Demand Zone at $4.28
2-Price to run and close above $4.30 daily swing liquidity (engineered liquidity for expansion higher)
3-Price to reprice into the 0.75 max discount of the range
4-Possible retest of the HTF bullish trendline
🎯 Setup Trigger
I’ll be looking for a 12H break of structure before entering long.
📋 Trade Management
Stoploss: 12H swing low that breaks the market
Targets:
• TP1: $4.83
• TP2: $5.14
💬 Like, follow, and comment if you find this setup valuable!
⚠️ Disclaimer: This content is for informational and educational purposes only and does not constitute financial, investment, or trading advice. Always DYOR before making any financial decisions.
APTUSDT 2D#APT has broken above the descending resistance on the 2-day chart. Now all eyes are on the 2-day SMA50. In case of a breakout above it, the potential targets are:
🎯 $5.265
🎯 $6.204
🎯 $6.964
🎯 $7.723
🎯 $8.803
🎯 $10.180
⚠️ Always remember to use a tight stop-loss and follow proper risk management.

APTUSDT UPDATE#APT
UPDATE
APT Technical Setup
Pattern: Bullish Falling Wedge Pattern
Current Price: $4.67
Target Price: $6.36
Target % Gain: 35.22%
AMEX:APT is breaking out of a falling wedge pattern on the 1D timeframe. Current price is $4.67 with a target near $6.36, showing about 35% potential upside. The breakout confirms bullish momentum with structure favoring continuation. Always use proper risk management.
Time Frame: 1D
Risk Management Tip: Always use proper risk management.

$APTPUMP Token Slumps, Leads Meme Coin Losses: Pump.fun’s native token, PUMP, recently slumped, leading losses among meme coins like Dogecoin, PEPE, and BONK, as the market stumbled.

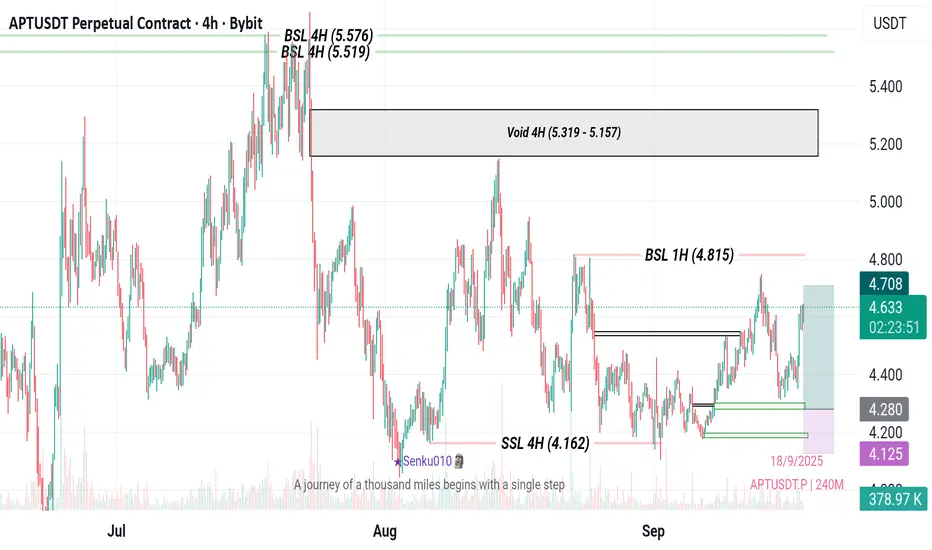
APTUSDT is currently strongly bullish4-hour timeframe, the market recently "grabbed" the Sellside Liquidity (SSL) at 4.162, a move that often precedes a major reversal. This event, coupled with the clear presence of Buyside Liquidity (BSL) pools above, has confirmed my uptrend conviction.
trade, my entry is precisely set at 4.280, a level that corresponds with a 2-hour Fair Value Gap (FVG), which represents a price inefficiency that the market is likely to re-enter. My primary take-profit target is the 1-hour Buyside Liquidity at 4.815, with a secondary target at the 4-hour Buyside Liquidity zone at 5.576. To manage my risk, my stop-loss is placed at 4.125, safely below the 4-hour Breaker Block. This plan offers a favorable risk-to-reward ratio and aligns
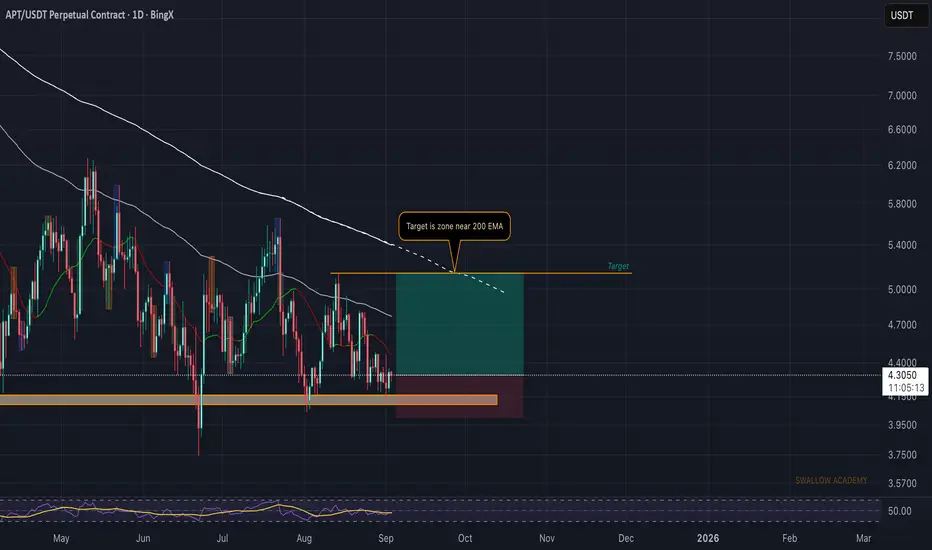
Aptos (APT): Looking For Buyers To Secure 200EMA | Bullish APT is currently fighting around the 200EMA and buyers need to secure this level before we can look for stronger upside. Once confirmed, the move toward higher liquidity zones opens up with clear targets above. Until then, waiting for structure to confirm.
Swallow Academy

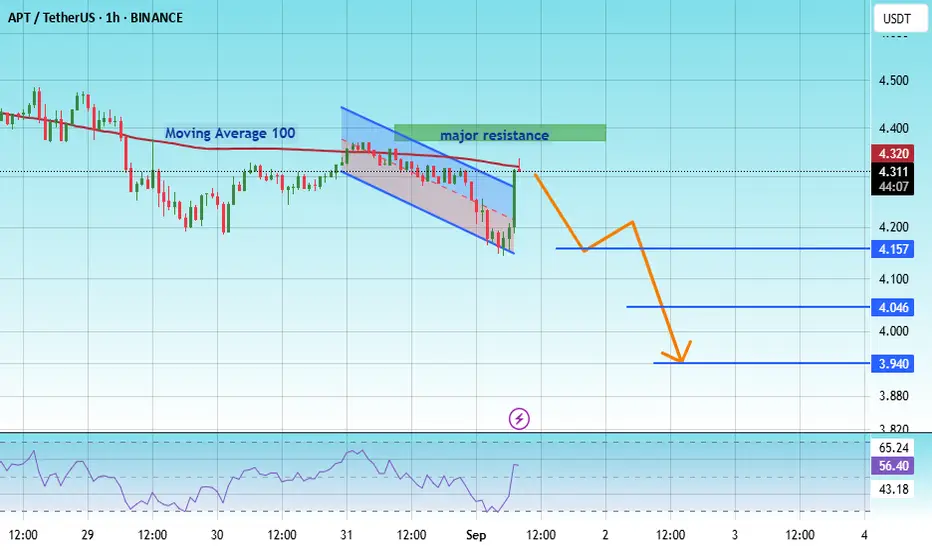
#APT/USDT - A lower timeframe view - Breakout Entry#APT
The price is moving within a descending channel on the 1-hour frame, adhering well to it, and is heading for a strong breakout and retest.
We have a bearish trend on the RSI indicator that is about to be broken and retested, which supports the decline.
There is a major resistance area (marked in green) at 4.32, which represents strong resistance.
For inquiries, please leave a comment.
We are in a consolidation trend below the 100 moving average.
Entry price: 4.324
First target: 4.15
Second target: 4.046
Third target: 3.94
Don't forget a simple matter: capital management.
When you reach the first target, save some money and then change your stop-loss order to an entry order.
For inquiries, please leave a comment.
Thank you.
APT Main trend. 21 02 2025Logo rhymes. Time frame 3 days. Medium-term work in the horizontal channel range.
Line chart without “market noise”.
Local work in the wedge formation range.

AptusdtHi snipers. APT USDT on the one-day time frame has gone far from its price ceiling. But in this chart it is trying to escape from this downward channel. The price has reached a sensitive point. My experience says that the black moving average line acts like a magnet and pulls the price towards itself and plays both a resistance and a support role. If the price can cross it, we will see a good price increase. I am learning and this is not a buy or sell offer. Good luck

Aptos scalp long to $4.57Just now opened up a scalp long position on aptos. Aiming for $4.57 area for now.
sl: 4.477
At least 1:1
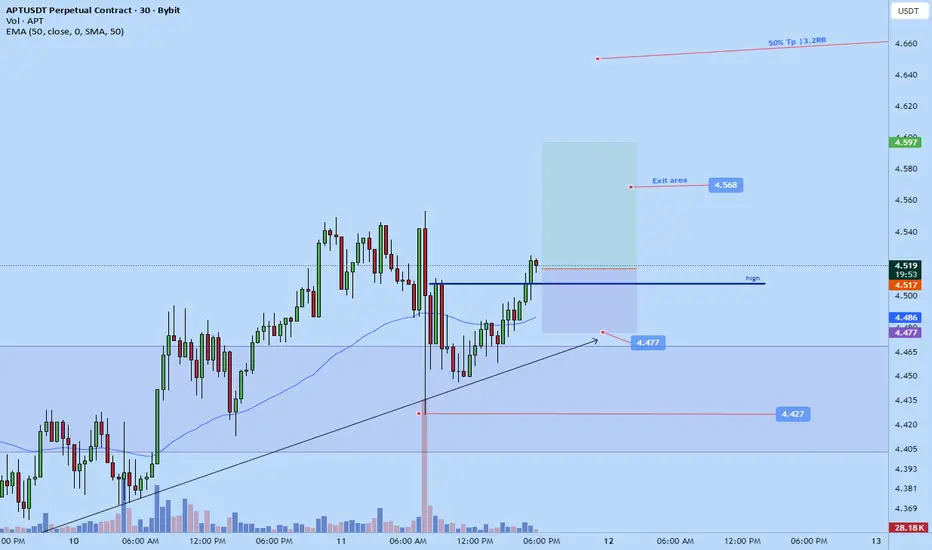
Aptos long to $4.534 todayJust opened a long position on aptos.
Aiming for $4.534 area.
This trade might exit early if not moving right away. Anticipating a push soon before main correction back down later on.
sl: 4.418

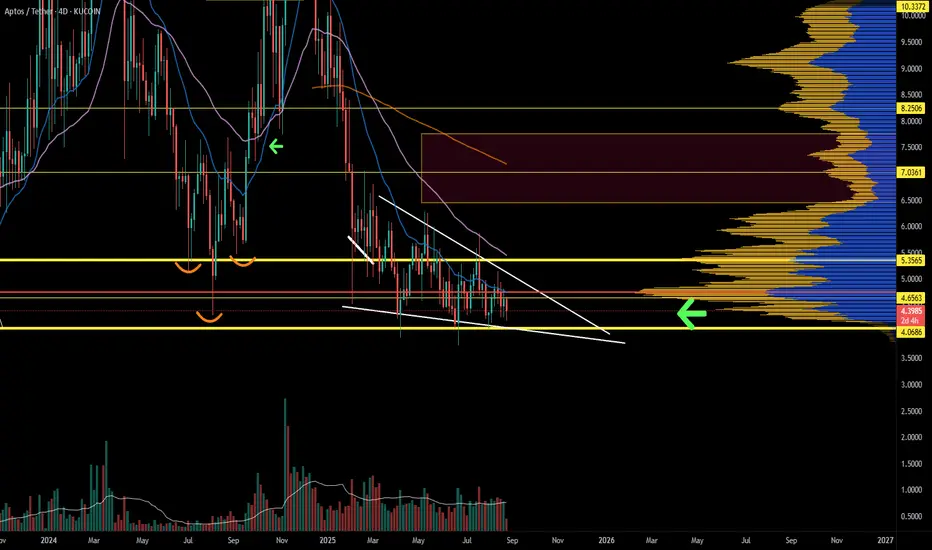
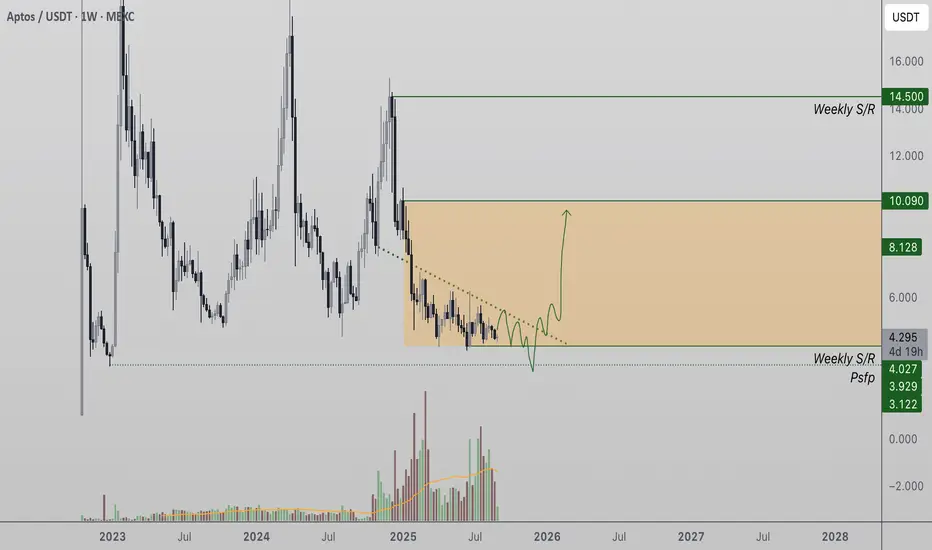
APT/USDT potential 300%+++buy ZONE $5.3 - $3.3
all targets are marked on the chart Fib ratio
Fundamentally strong project

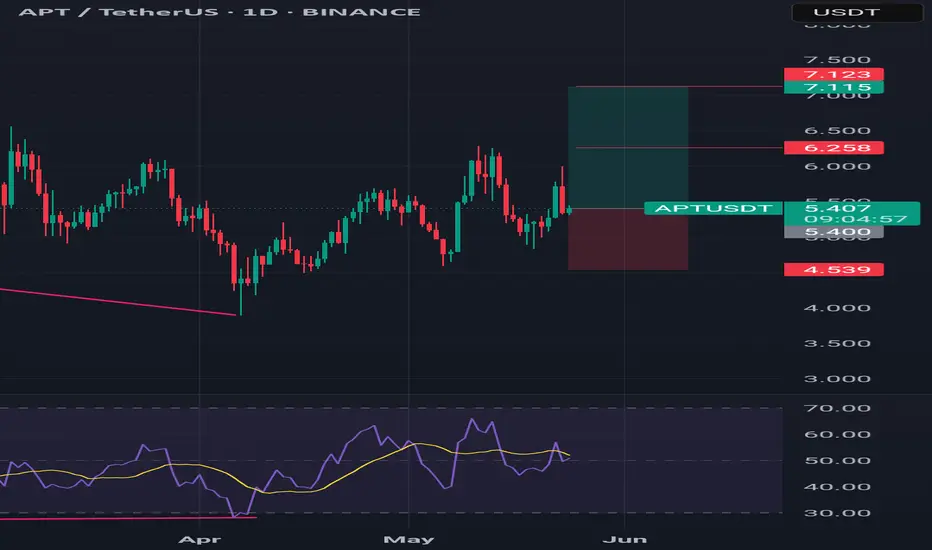
APT Eyes Expansion After Weekly Support ReboundAPT has held firm at weekly support, producing a bullish reaction after prolonged consolidation. The $5.40 resistance remains the next major objective.
Price action on APT has respected a long-standing weekly support, establishing a strong base. Multiple retests have failed to break down, suggesting accumulation is underway. Buyers have stepped in repeatedly, signaling confidence at these levels.
Key Technical Points:
- Weekly Support Intact: Multiple retests confirm strength of this level.
- Bullish Reaction Visible: Recent bounce points to accumulation.
- Target at $5.40: Next major resistance aligned with current upside objectives.
The market structure reflects a bullish foundation, as buyers continue to defend support. The next step for APT is a sustained influx of bullish volume, which would propel price action toward $5.40. If momentum builds, APT could break out of its accumulation phase, drawing further demand.
What to Expect in the Coming Price Action
APT is primed for bullish expansion if volume confirms. Traders should watch for strong buying activity; without it, the consolidation could persist before any decisive move
Aptos (APT): Looking For Bounce From Support | Target 200EMAAPT is still moving sideways, holding above local support. As long as buyers protect this area, we are eyeing a move back into higher zones.
The key target sits near the 200EMA, which also lines up with our resistance area. That’s the zone where we’ll be watching closely for a reaction — either a breakout continuation or a rejection back into the range.
For now, the focus remains on protecting the support and building momentum toward that 200EMA target.
Swallow Academy
APT: Bullish Harmonic Pattern, APT Targets $5!APT: Bullish Harmonic Pattern, APT Targets $5!
Price has completed a bullish Harmonic Pattern and is showing signs of upward movement.
The volume appears to support the bullish movement, considering the price reaction, which adds confidence to the bullish scenario.
The targets that I am looking at are based on the structure areas:
4.5 First resistance zone -Conservative target for short-term traders
4.75 Mid-level target - For Swing traders
5.00 Psychological level - Strong resistance and potential profit-taking zone
Consider any potential reversal near these resistance zones.
You may find more details in the chart!
Thank you and Good Luck!
❤️PS: Please support with a like or comment if you find this analysis useful for your trading day❤️

Aptos Tests Key Level at $4.29, Potential Reversal Aptos (APT) is trading near $4.29 support, with the $4.20 swing low acting as a critical inflection point. A liquidity-driven reversal could propel price toward $10 resistance.
Aptos is currently navigating a key technical zone that could define its next directional move. Price action is consolidating within equilibrium, where lower highs meet higher timeframe support. The $4.20 swing low has emerged as the most important structural level, with the potential to trigger a liquidity-driven reversal if breached.
Aptos (APT) Key Technical Points
- Key Support at $4.20: Swing low forms a structural inflection point.
- Liquidity Sweep Scenario: Breach of $4.20 could trigger a reversal higher.
- Upside Target at $10: Long-term objective if reversal confirms.
APT is trading tightly at $4.29, with pressure mounting against the $4.20 swing low. Price structure shows lower highs, reflecting seller dominance, but the compression is also creating the conditions for a liquidity sweep. A move below $4.20 could trigger stops and flush out weak hands, setting the stage for a reversal once liquidity is absorbed.
Market structure remains range-bound between two high timeframe levels, forming a wide-ranging trade formation. This equilibrium suggests accumulation at lower levels before a potential expansion. The key is whether $4.20 holds as reclaimed support following any liquidity sweep. If confirmed, this level could act as a springboard for a much larger move.
The bullish case becomes compelling if demand steps in after liquidity is taken. With price coiling between range extremes, a successful reversal could target the $10 resistance region. This level aligns with prior structural highs and represents the next major checkpoint for continuation. The shift from compressed equilibrium to expansion is often fast and impulsive once confirmed, giving this setup strong potential.
Volume will be crucial for confirmation. At present, activity has been muted, which fits the ranging environment. Traders should look for a surge in bullish influxes during or immediately after the liquidity sweep, as this will validate the rotation higher.
What to Expect in the Coming Price Action
As long as Aptos defends the $4.20 swing low after any potential liquidity sweep, the probability of reversal increases significantly. A confirmed bounce with volume support could initiate a rotation toward $10 resistance, completing a full range expansion.
Just a charti would suggest to not miss this coin, we are very on this.
This coin will make very good move on the comming days fill your bags before it is too late.

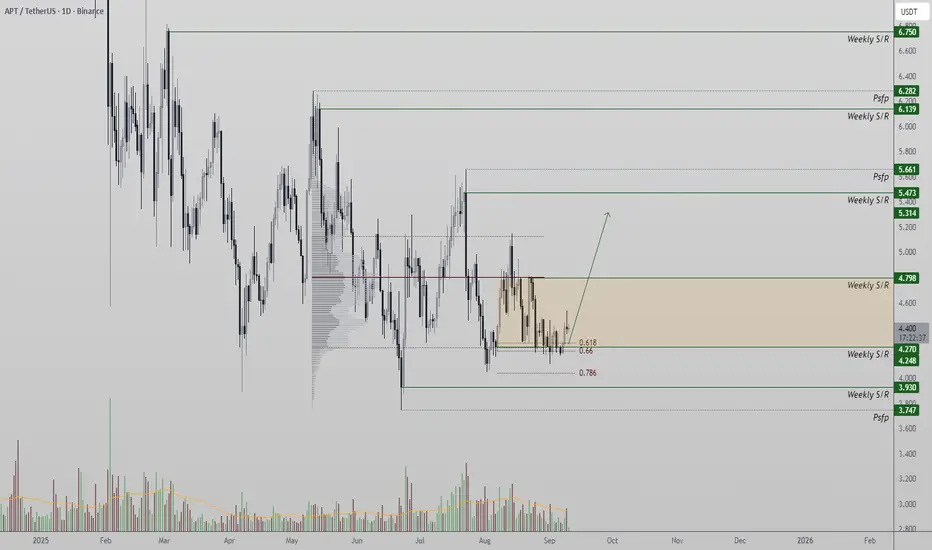
Aptos Defends $4.20 Support — Can Bulls Trigger a Recovery? Aptos (APT) has managed to hold its ground at the crucial $4.20 support level, a price region reinforced by key technical indicators such as the 0.618 Fibonacci retracement and the value area low. This defensive zone has become the battleground for bulls and bears, and its outcome may determine whether Aptos stages a recovery back above $5 or risks further downside.
Market Context
Over the past several sessions, Aptos has been locked in consolidation, grinding sideways after retreating from recent highs. Despite the corrective move, the asset has so far managed to respect the higher-timeframe structure, with the $4.20 zone repeatedly acting as a springboard for price stability. Traders are watching closely to see whether this level evolves into a longer-term accumulation base or simply a pause before further declines.
Key Technical Factors
- $4.20 Support Zone: The confluence of the 0.618 Fibonacci retracement and value area low reinforces this region as a strong demand level.
- Defensive Daily Closes: Multiple sessions have closed above $4.20, suggesting buyers remain active and committed to defending the level.
- Potential Upside Target: If the rebound holds, Aptos could aim for $5.40, the next technical resistance and a psychological round number.
- Volume Confirmation Required: Sustained bullish inflows will be essential for confirming a true reversal instead of a short-lived bounce.
Deeper Analysis
Aptos’ ability to maintain its footing at $4.20 highlights the market’s respect for this technical floor. Each dip into this area has seen renewed demand, a sign that traders recognize the value at this level. The presence of the golden Fibonacci retracement adds credibility to its importance, often serving as a reversal zone in trending markets.
However, while structure and confluence lean bullish, the missing ingredient so far has been volume. Trading activity has remained muted, and without strong buy-side participation, price may continue to chop sideways. A sharp increase in volume would not only confirm the presence of fresh capital entering the market but also signal that momentum is shifting decisively in favor of bulls.
On the flip side, if Aptos loses the $4.20 region with conviction, the market structure could break down into a more extended correction. This would open the door toward deeper liquidity pockets closer to the $3.80–$4.00 range. Such a scenario would erase the current bullish bias and place additional pressure on buyers to step in at lower levels.
Outlook
For now, the market remains balanced between cautious optimism and downside risk. Holding $4.20 keeps the possibility of a rotation higher alive, with $5.40 standing out as the immediate resistance target. Beyond that, regaining higher levels of acceptance could allow Aptos to rebuild its bullish structure over the coming weeks.

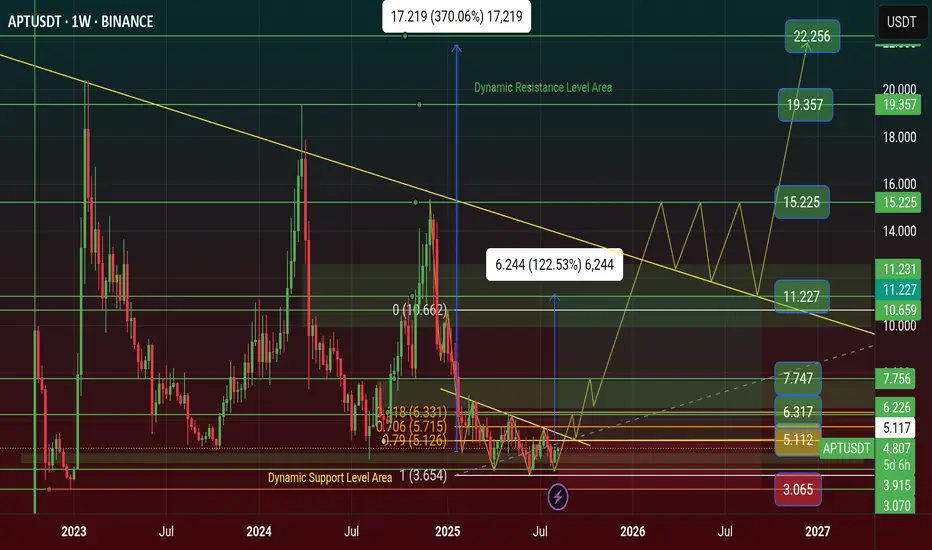
$APT Price Prediction will be reach $22 this Year 2025APT price is Showing Triple Bottom Pattern on Chart. it's a Reversal Pattern for APT price Manipulation. Time for Bull Run on APT and 12 aug unlocked 11.31M APT token and 2.20% of released supply $51.35M Dollar.
APT Price now Bottom area of Major Support Level area. At first the price will Hit $7 and if it's touch $11 price and if it's Breakout this Resistance it will be happened APT $22 Price.
🚦Aptos (APT) - 11.31M Token Unlocked worth of $51.35M - 12 Aug 2025
On 12 August 2025, Aptos will unlock 11.31 million new tokens. This event adds more APT tokens into the market supply at one time. Many traders watch token unlocks because more supply can bring price down if holders decide to sell quickly. Also, if most tokens go to teams or early backers, there might be more selling.
However, if unlocks are well planned and market demand is high, the price may not fall much. This event could be a catalyst for price change based on how the market reacts.
🚦 Aptos’ DEX trading volume reached $9 billion in the first half of the year, and the market value of stablecoins increased to $1.2 billion
PANews reported on August 12th that a Messari report showed that Aptos made significant progress in on-chain performance, DeFi ecosystem, and technological innovation in the first half of 2025. Transaction fees dropped to $0.00052, DEX trading volume reached $9 billion, and the stablecoin market capitalization increased to $1.2 billion.
On the technical side, projects such as Shelby and Decibel were launched to improve network performance. The Aptos Foundation invested $200 million to promote ecosystem development and consolidate its position as a global transaction engine.
🚦 UPCOMING EVENTS APT 11 SEPTEMBER
Total 11.31M APT Token Unlock worth of $54.51M and 2.15% of released supply
#Write2Earn #BinanceSquareFamily #BinanceAlphaAlert #APT #SUBROOFFICIAL
Disclaimer: This article is for informational purposes only and does not constitute financial advice. Always conduct your own research before making any investment decisions. Digital asset prices are subject to high market risk and price volatility. The value of your investment may go down or up, and you may not get back the amount invested. You are solely responsible for your investment decisions and Binance is not available for any losses you may incur. Past performance is not a reliable predictor of future performance. You should only invest in products you are familiar with and where you understand the risks.
APT consolidating at the bottom. APT is in a falling wedge on the H4 with class A bullish divergence on momentum. Although market structure hasn't put in a CHOCH, the volume accumulating in this area makes it a prime POI. What makes this level a DCA zone is the RR. Buy from a position of strength.