APT: Bullish Harmonic Pattern, APT Targets $5!APT: Bullish Harmonic Pattern, APT Targets $5!
Price has completed a bullish Harmonic Pattern and is showing signs of upward movement.
The volume appears to support the bullish movement, considering the price reaction, which adds confidence to the bullish scenario.
The targets that I am looking

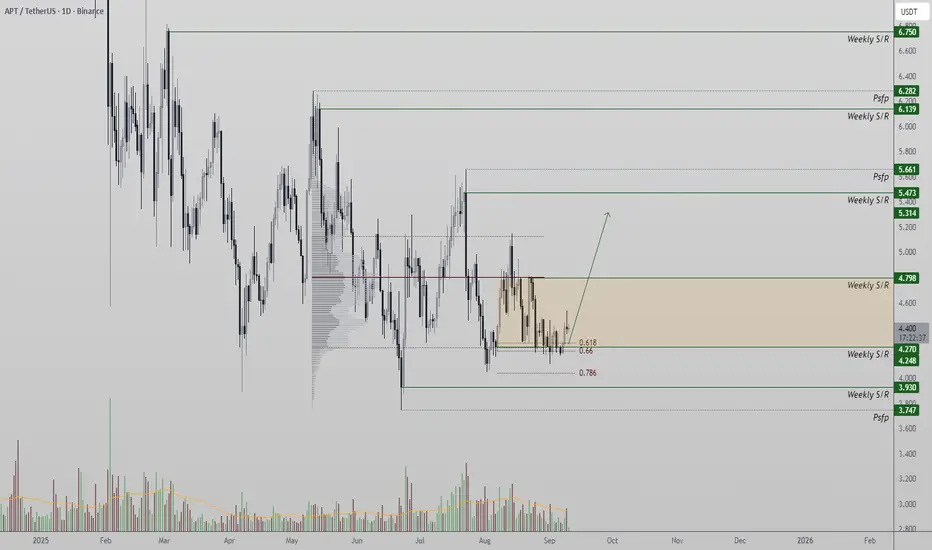
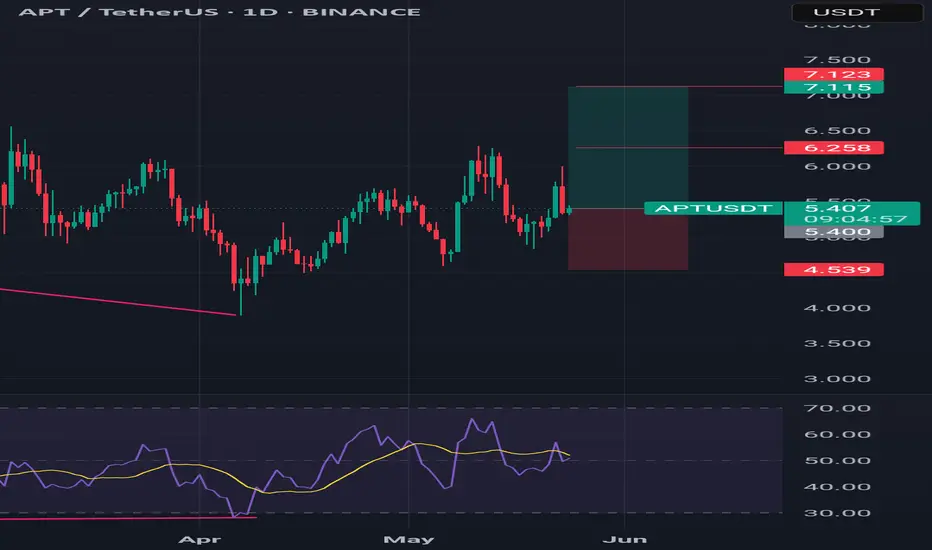
APT Eyes Expansion After Weekly Support ReboundAPT has held firm at weekly support, producing a bullish reaction after prolonged consolidation. The $5.40 resistance remains the next major objective.
Price action on APT has respected a long-standing weekly support, establishing a strong base. Multiple retests have failed to break down, suggestin
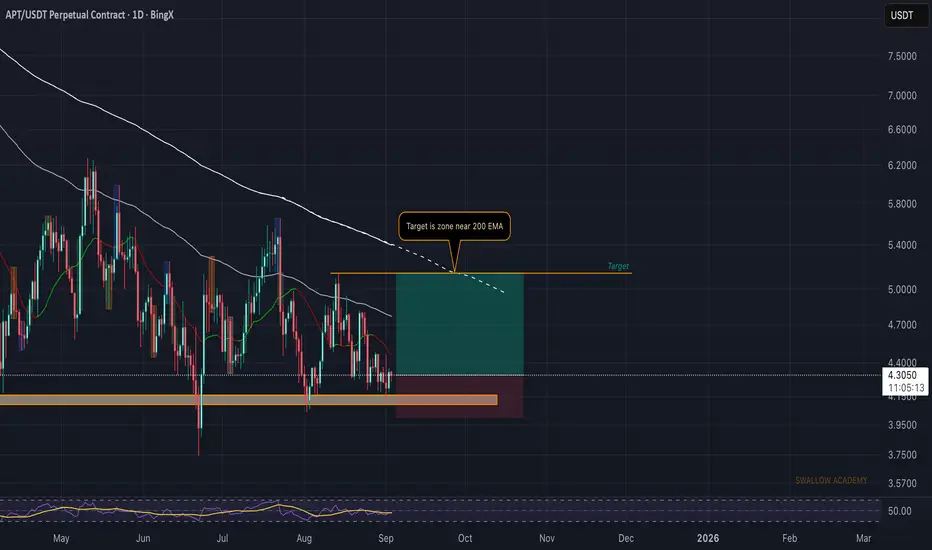
Aptos (APT): Looking For Bounce From Support | Target 200EMAAPT is still moving sideways, holding above local support. As long as buyers protect this area, we are eyeing a move back into higher zones.
The key target sits near the 200EMA, which also lines up with our resistance area. That’s the zone where we’ll be watching closely for a reaction — either a b
Aptos long to $4.534 todayJust opened a long position on aptos.
Aiming for $4.534 area.
This trade might exit early if not moving right away. Anticipating a push soon before main correction back down later on.
sl: 4.418

Aptos Tests Key Level at $4.29, Potential Reversal Aptos (APT) is trading near $4.29 support, with the $4.20 swing low acting as a critical inflection point. A liquidity-driven reversal could propel price toward $10 resistance.
Aptos is currently navigating a key technical zone that could define its next directional move. Price action is consolidat
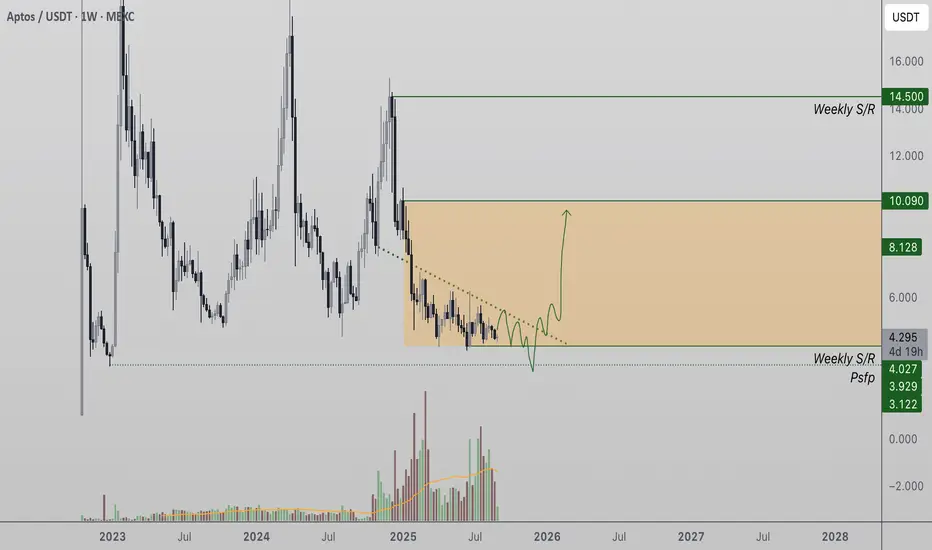
APT/USDT potential 300%+++buy ZONE $5.3 - $3.3
all targets are marked on the chart Fib ratio
Fundamentally strong project

Aptos Defends $4.20 Support — Can Bulls Trigger a Recovery? Aptos (APT) has managed to hold its ground at the crucial $4.20 support level, a price region reinforced by key technical indicators such as the 0.618 Fibonacci retracement and the value area low. This defensive zone has become the battleground for bulls and bears, and its outcome may determine whet

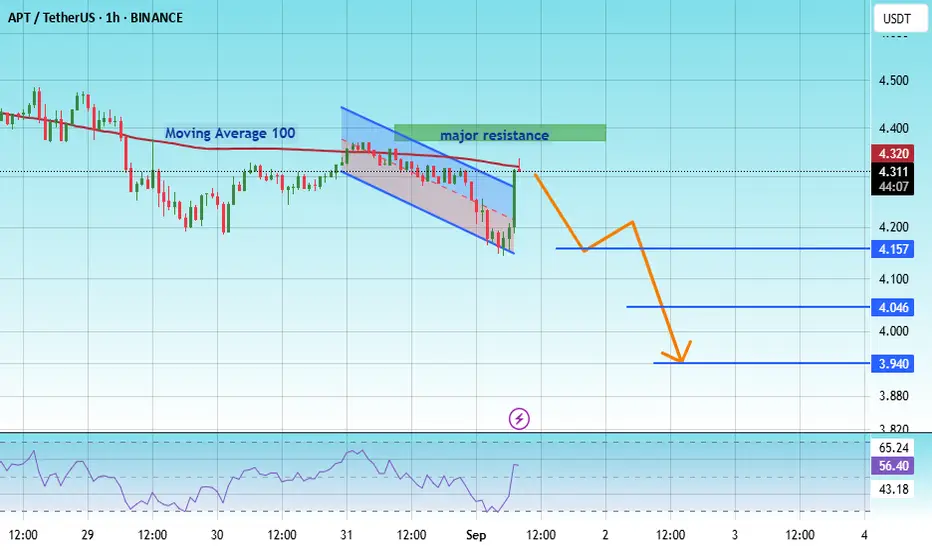
#APT/USDT - A lower timeframe view - Breakout Entry#APT
The price is moving within a descending channel on the 1-hour frame, adhering well to it, and is heading for a strong breakout and retest.
We have a bearish trend on the RSI indicator that is about to be broken and retested, which supports the decline.
There is a major resistance area (marke
Just a charti would suggest to not miss this coin, we are very on this.
This coin will make very good move on the comming days fill your bags before it is too late.

See all ideas
Summarizing what the indicators are suggesting.
Oscillators
Neutral
SellBuy
Strong sellStrong buy
Strong sellSellNeutralBuyStrong buy
Oscillators
Neutral
SellBuy
Strong sellStrong buy
Strong sellSellNeutralBuyStrong buy
Summary
Neutral
SellBuy
Strong sellStrong buy
Strong sellSellNeutralBuyStrong buy
Summary
Neutral
SellBuy
Strong sellStrong buy
Strong sellSellNeutralBuyStrong buy
Summary
Neutral
SellBuy
Strong sellStrong buy
Strong sellSellNeutralBuyStrong buy
Moving Averages
Neutral
SellBuy
Strong sellStrong buy
Strong sellSellNeutralBuyStrong buy
Moving Averages
Neutral
SellBuy
Strong sellStrong buy
Strong sellSellNeutralBuyStrong buy
Displays a symbol's price movements over previous years to identify recurring trends.