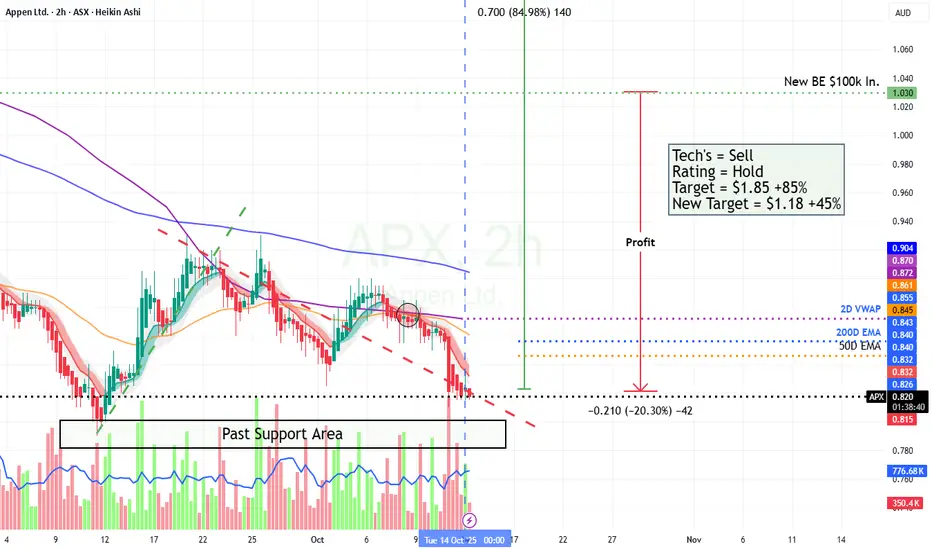
APP is at the double bottom support zone.APP Appen is at the double bottom support zone as seen.
This is only a Technical Analysis, as this is an AI Ticker, but is currently showing a serious weak Trend despite other positive movers.
In my opinion is oversold and ripe for the risky buyer as the potential upside could be +35%
As you shoul
Appen Ltd.
No trades
−0.0409 USD
−19.96 M USD
233.77 M USD
About Appen Ltd.
Sector
Industry
CEO
Ryan Kolln
Website
Headquarters
Chatswood
Founded
1996
IPO date
Jan 7, 2015
Identifiers
3
ISIN US03783V1089
Appen Ltd. engages in the development of human-annotated datasets for machine learning and artificial intelligence. It operates through the Global Services and New Markets segments. The Global Services segment includes the services provided to the five major U.S. technology customers using data annotation platforms and tools. The New Markets segment represents product-led businesses using collection, annotation, and evaluation products and tools, and Enterprise, Government, China, and Quadrant businesses. The company was founded in 1996 and is headquartered in Chatswood, Australia.
Related stocks
APX Rebound in Play?📈 “APX Rebound in Play? Eyeing the AUD 1.55 Resistance”
Appen (APX) has shown a significant uptick today, closing at AUD 1.040 (+5.58%) with a sharp volume spike (8.96M shares) that could suggest accumulation. After a long downtrend, price appears to be consolidating above key support near AUD 1.00

APPEN LIMITED updateStrong Buy
APPEN target 3.56
Australia's APPEN is showing signs of a recovery story that's working for now.
As the Chart shows, was bashed Down Heavily by the Market.

APPEN - Watch+ NonFailure Swing on the Daily
+ Inclined resistance broken out
+ Weekly clearly broken out of inclined trend line
+ Weekly above 50%
+ RSI/OBV supports the movement
+ Above Weekly bull band
- RSI is overbought
- Weekly resistance + 618 FIB resistance on the way up
- Stop loss is 33%

Finer Market Points: ASX Top 10 Momentum Stocks: 11 Mar 2024TSX:TSK ASX:APX NASDAQ:CUE LSE:IMC BSE:VMS LSE:DCC $360 ASX:ZIP NYSE:BOC MIL:BRE
Momentum leading shares are the market's best performers today. They are the fastest-growing shares on the ASX over the last 90 days. These companies can't get to be leaders without first appearing on

$APX $APX.ax #ai
Pullback into Previous Weekly Open and reclaim would be trigger for me,
or
Above the Macro Mid range consolidate and acceptance above and between MID and range high.. Is trigger for long.
Hold below Weekly open = All bets are off ..

$APX $2.80 moving out of a tight base low SOI AIWIth current AI interest n all that, the ultra low SOI of around 125m, and the shape this has taken recently surely this should rip from here
Hard to believe it was trading at $42 around 2.5 year ago
Holding

Australias Appen Drops on EarningsDown almost 30% on its Earnings Report. Be interesting to see if this is an over reaction by the market and might be some upside.
Watching.

Is APX ready for a counter-trend rally ?I have dissected the price action behaviour into two boxes as shown as Box of Tricks 1 and Box of Tricks 2. Why ?
When the previously posted PnF chart Price Target met, it alerted me to a potential end of the down move. No different than that of A2M chart!
Now, If one studies the first box(Box of T

APX Bearish Price Objective Calculation.This is to demonstrate the educational side of the PnF charting in terms of bearish price objective calculation. Bearish count taken from the high pole and calculation from it is shown on the chart.
It(Bearish Price Objective) has been met today(29/09/2021)!
Let's now wait and see if the decline wil

See all ideas
Summarizing what the indicators are suggesting.
Oscillators
Neutral
SellBuy
Strong sellStrong buy
Strong sellSellNeutralBuyStrong buy
Oscillators
Neutral
SellBuy
Strong sellStrong buy
Strong sellSellNeutralBuyStrong buy
Summary
Neutral
SellBuy
Strong sellStrong buy
Strong sellSellNeutralBuyStrong buy
Summary
Neutral
SellBuy
Strong sellStrong buy
Strong sellSellNeutralBuyStrong buy
Summary
Neutral
SellBuy
Strong sellStrong buy
Strong sellSellNeutralBuyStrong buy
Moving Averages
Neutral
SellBuy
Strong sellStrong buy
Strong sellSellNeutralBuyStrong buy
Moving Averages
Neutral
SellBuy
Strong sellStrong buy
Strong sellSellNeutralBuyStrong buy
Displays a symbol's price movements over previous years to identify recurring trends.