ARB/USDT — Retesting the Golden Pocket Before the Next Big Move?
📝 Key Summary:
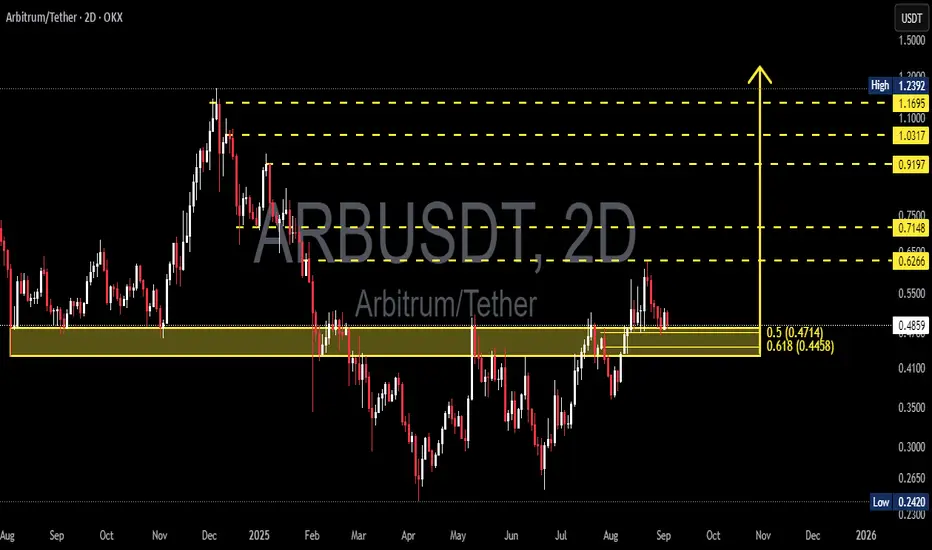
Arbitrum (ARB) is currently consolidating within the Fibonacci golden pocket (0.445–0.471), which also acts as a major demand zone. This area will decide whether ARB can continue its bullish phase toward the psychological $1+ levels, or fail to hold and revisit deeper supports.
---
🔍 Price Structure & Key Patterns
1. Accumulation / Demand Zone (0.445–0.471):
This zone is a confluence of Fibonacci 0.5–0.618 and a strong historical support-resistance flip. Holding this level keeps the mid-term bullish case alive.
2. Higher Low Formation Since June:
From the 0.242 bottom, ARB has started forming higher lows, suggesting a potential transition toward a healthier uptrend.
3. Rejection at Supply Zone (0.62–0.63):
The latest rally was rejected here, confirming strong selling pressure. A clean breakout above this zone will be a key signal for a larger rally.
4. Wide Trading Range:
ARB is still ranging between 0.24 (low) and 1.23 (high). The current price sits in the lower-mid range, making this a high-interest zone for medium-term investors.
---
📈 Bullish Scenario
✅ Conditions: Price holds above 0.445–0.471 (2D bullish close + volume confirmation).
➡️ Upside targets:
First resistance: 0.6266
Next: 0.7148 → 0.9197 → 1.0317 → 1.1695 → 1.2392 (previous high)
📌 Note: A breakout above 0.63 with strong volume could trigger a multi-week swing rally.
---
📉 Bearish Scenario
❌ Conditions: 2D close below 0.4458 + strong selling volume.
➡️ Downside targets:
0.35 (intermediate support)
0.2420 (multi-month low / extreme demand zone)
📌 Note: Losing the golden pocket usually signals that the market isn’t ready for a bullish trend, raising the risk of retesting previous lows.
---
🧭 Trading Approach
Conservative: Wait for a 2D bullish rejection above 0.47 → long entry, stop below 0.445, first target 0.6266+.
Aggressive: Partial long entries at current levels, adding more upon bullish confirmation.
Short setup: Valid on breakdown below 0.445 → target 0.35, extension to 0.24 if selling persists.
Always apply risk management (RR ≥ 1:2), scale out at resistance levels.
---
📌 Conclusion
ARB is currently sitting at the key decision zone (Fibonacci golden pocket 0.445–0.471).
If this zone holds → bullish bias toward 0.63 up to 0.92+.
If this zone breaks → bearish bias toward 0.35 and potentially 0.24.
Traders should wait for candle + volume confirmation before committing, as this level could mark a major turning point in ARB’s mid-term trend.
---
#ARB #ARBUSDT #Arbitrum #CryptoAnalysis #PriceAction #SupportResistance #Fibonacci #CryptoTrading #Altcoins #SwingTrade
ARBUSDT.P trade ideas
#ARBITRUM #ARBUSDT #LONG #Eddy#ARBITRUM #ARBUSDT #LONG #Eddy
ARBUSDT.P SWING Long Setup
Important areas of the upper time frame for swing are identified and named.
This setup is based on a combination of different styles, including the volume style with the ict style.
Based on your strategy and style, get the necessary confirmations for this Swing Setup to enter the trade.
Don't forget risk and capital management.
The entry point, take profit point, and stop loss point are indicated on the chart along with their amounts.
The responsibility for the transaction is yours and I have no responsibility for not observing your risk and capital management.
By scratching the price and time bar, you can see the big picture of targets.
Buy Position "LONG" Spot & Future Details :
Entry : 0.4900
Stop : 0.4665 (( 4.80% )) "You can enter with a small stop by getting approval."
Target 1 : 0.5145 "5%"
Target 2 : 0.5390 "10%"
Target 3 : 0.5635 "15%"
Target 4 : 0.5880 "20%"
Target 5 : 0.6125 "25%"
Target 6 : 0.6370 "30%"
Be successful and profitable.

Arbitrum’s Last Stand at $0.35?Yello, have you noticed how #ARBUSDT is clinging to its last major support, just as retail traders are starting to panic? This is exactly where the market usually decides whether to trap the impatient or reward the disciplined.
💎Price is currently testing the demand zone around $0.45–$0.50, aligning with the ascending channel support and the 200-day moving average. This zone is absolutely crucial. As long as #Arbitrum holds above it, the structure remains intact, and we can expect a potential rebound toward minor resistance near $0.60, with strong resistance waiting higher around $0.75.
💎However, a confirmed breakdown below $0.45 would shift the structure into dangerous territory. A deeper flush toward $0.35 would not only invalidate the bullish channel but also trigger panic selling across the board. That is where most weak hands will capitulate, while smart money prepares to reload.
💎The majority will chase every small move, but the real trade is about waiting for either a clean bounce with momentum or a decisive breakdown. Both outcomes will be violent, and both will clear out inexperienced traders.
🎖Strive for consistency, not quick profits. Treat the market as a businessman, not as a gambler. The next move on #Arbitrum will be a money-maker for some and a disaster for many make sure you are on the right side by staying disciplined.
MyCryptoParadise
iFeel the success🌴

ARB: slow breakout brewing?ARB is grinding around $0.49, showing early signs of strength. The green zone near $0.49–0.48 is key support — so far, buyers are holding it. If that level cracks, we could see a quick dip toward $0.47 before any real bounce.
The real battle is above. EMA cluster and Fib levels are stacking near $0.50–0.51, creating heavy resistance. A clean breakout above $0.51 opens the door to $0.52+, but don’t chase too early — smart money will wait for confirmation while retail jumps in late.
Right now, patience pays. Watch how price reacts in the green zone and near $0.50. That’s where the best setups form while the crowd gets shaken out.

TradeCityPro | ARBUSDT Easiest Short Trigger!👋 Welcome to TradeCityPro Channel!
Let’s go for the analysis of Arbitrum (ARB/USDT), one of the favorite coins among airdrop hunters with great memories, and still one of the most popular DeFi tokens.
🌐 Overview of Bitcoin
Before starting the analysis, let me remind you again that we moved the Bitcoin analysis section out of this part and made it a separate daily analysis as per your request, so we can discuss Bitcoin’s condition in more detail and analyze its charts and dominance separately.
This is the general Bitcoin dominance analysis that we promised to cover separately and analyze in longer time frames:
📈 On the 4H timeframe, ARB experienced a strong bullish wave. After breaking 0.4059 and moving out of the range box (0.36–0.40), it had a sharp rally reaching 0.6146.
❌ After rejection from this key weekly resistance, ARB formed a lower high and sharply corrected, eventually breaking below a resistance trendline.
📉 It has now reached the strong support at 0.4738, which also aligns with the 50% Fibonacci retracement level. According to Dow theory, the 50% level is also a very critical area, making this point an important PRZ (Potential Reversal Zone).
✅ For long positions: It’s still a bit early. With a trendline breakout you could attempt something, but personally, I’d wait for a higher high and higher low structure before going long.
⚠️ For short positions: The setup is much clearer. After breaking below 0.4738, we can open a short position targeting 0.4358, while keeping risk management in mind for opening positions.
📝 Final Thoughts
Stay calm, trade wisely, and let's capture the market's best opportunities!
This analysis reflects our opinions and is not financial advice.
Share your thoughts in the comments, and don’t forget to share this analysis with your friends! ❤️

ARB possible resistance/support flip happeningBINANCE:ARBUSDT currently is at the same area that previously functioned as a strong resistance since august 2024 - it weakened a few times each time it got broken but now could be the moment it funally finds support for good. the orange line is the area.
my ARB trade is still open (Entry 47.76 cents) and I'm aiming for 1 dollar. let's see

Can ARB get $1 back?!Hey there! It looks like the BINANCE:ARBUSDT token, which powers the Arbitrum blockchain, is getting ready for a big move. It's showing some strong bullish momentum, and we might see it climb past the $1 mark soon. This is happening at a great time, as the overall crypto market has been on a tear lately. Just look at how well Ethereum and other top coins have performed—it seems ARB is following a similar path.
⛔"Daily crypto market analyses I provide are personal opinions & not financial advice. Trading carries risks, so do your own research & seek advisor's help. #DYOR
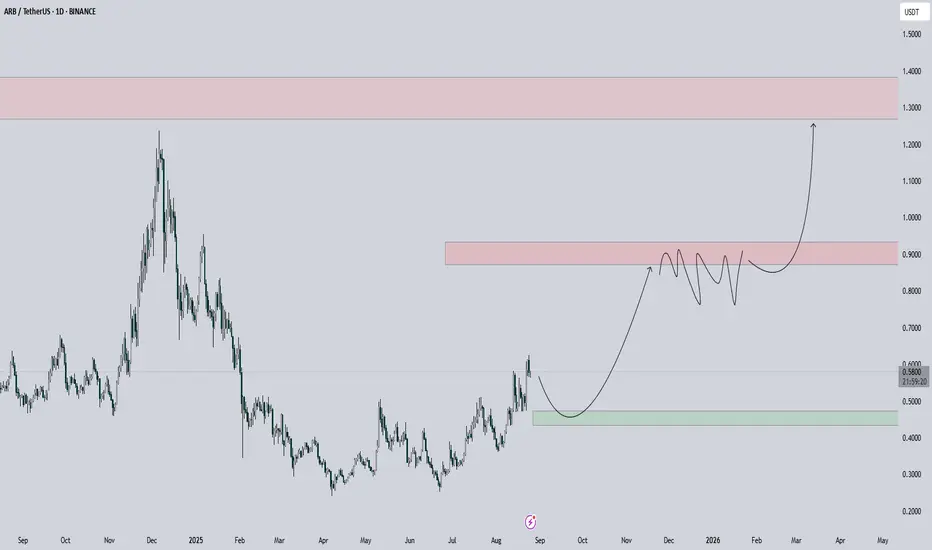
ARBUSDTARB is showing a strong bullish structure after reclaiming the key support zone around 0.48 – 0.49 USDT (highlighted in grey). Price is respecting the ascending trendline and currently holding above the 50-day EMA (blue line), which indicates momentum is shifting in favor of buyers.
Support zone: 0.48 – 0.49
Trendline support: rising from 0.30 lows
Immediate resistance: 0.60
Major target zone: 1.20+ (if breakout sustains)
Invalidation: A daily close below 0.48 and trendline would weaken the bullish outlook, with 0.30 as the next major support.
Overall, as long as ARB maintains this structure, the bias remains bullish with a potential upside towards 1.20 USDT in the coming weeks.

LongBreaking the 203-day resistance with a double pattern in the medium term of the specified target is not out of mind

LongBreaking the 203-day resistance with a double pattern in the medium term of the specified target is not out of mind

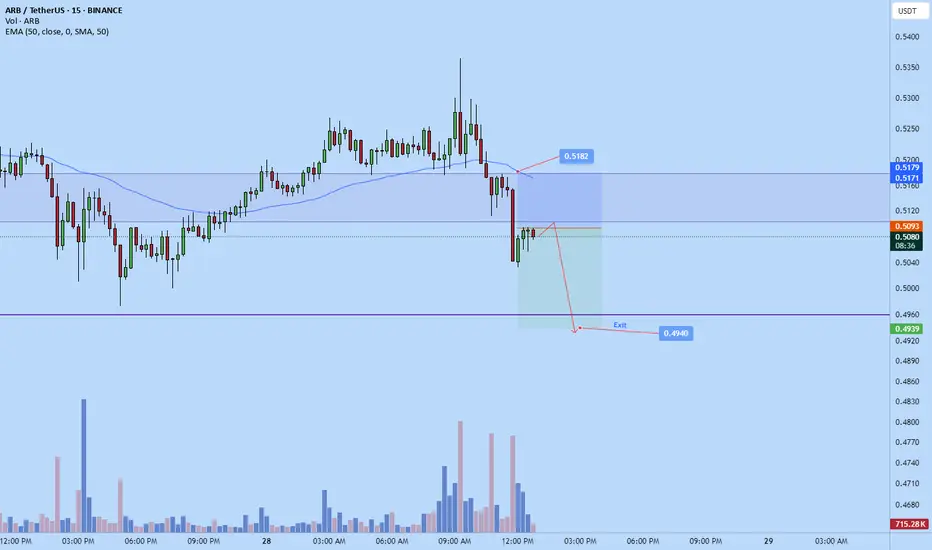
Arbitrum scalp short to $0.4940Just now entered arb short
Aiming for $0.4940
1.8 RR
Time sensitive
Sl: 0.5182
I love arbitrumi believe this coin will do verywell in the future. i started dca into it around 0.3248ish.
dyor and consider this post a favor from the future :)

Key Zone Reclaimed: Can $ARB Push Higher?AMEX:ARB has reclaimed the support zone and is holding above it, showing early bullish strength.
However, price is still far from the major descending resistance, so for now, it’s in a mid-range. Bulls need to defend this level to build toward a potential breakout later.
DYOR, NFA
ARBUSDT rebounceBINANCE:ARBUSDT Price currently at trendline support, projecting for this coin to bounce from it and then break the red trendline.
TP: once price touch those orange trendline
SL: set below the white horizontal line

#ARB/USDT#ARB
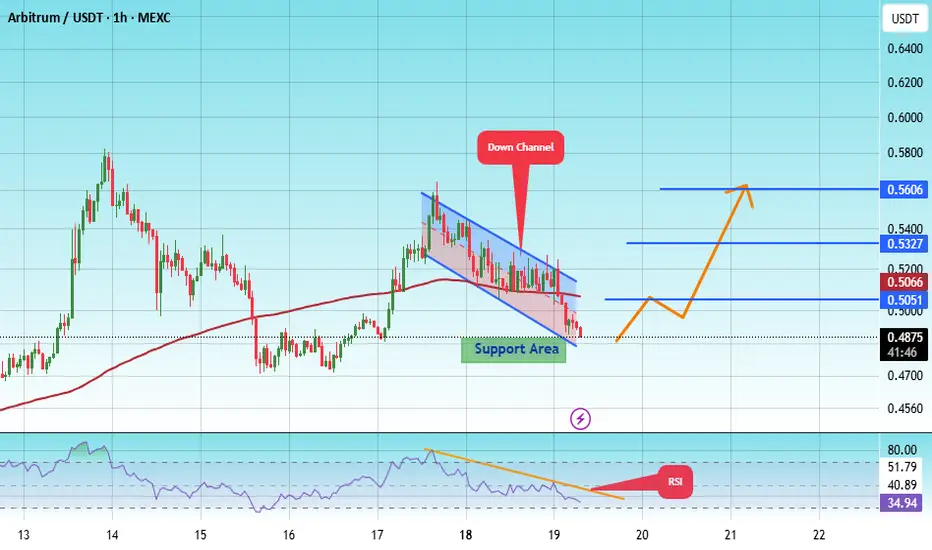
The price is moving within a descending channel on the 1-hour frame and is expected to break and continue upward.
We have a trend to stabilize above the 100 moving average once again.
We have a downtrend on the RSI indicator that supports the upward break.
We have a support area at the lower boundary of the channel at 0.4900, acting as strong support from which the price can rebound.
We have a major support area in green that pushed the price upward at 0.5000.
Entry price: 0.5314.
First target: 0.5578.
Second target: 0.5955.
Third target: 0.6341.
To manage risk, don't forget stop loss and capital management.
When you reach the first target, save some profits and then change your stop order to an entry order.
For inquiries, please comment.
Thank you.

ARB/USDT – 1h | Equal Highs or Rejection Block?
Price is consolidating near 0.5378 with mixed structure. Market is caught between equal highs above and equal lows below.
Bullish Scenario:
* Hold above 0.5300 swing zone
* Break 0.5420 swing high → extend to 0.5550 equal highs
* Upside continuation could target 0.5900 P1D high → 0.6200 rejection block
Bearish Scenario:
* Fail to clear 0.5420 swing high
* Drop through 0.5100 equal lows / P1D low
* Continuation toward 0.4800 rejection block → 0.4400 OB
Key Levels:
* 0.6200 (Rejection Block)
* 0.5900 (P1D High)
* 0.5550 (Equal Highs)
* 0.5420 (Swing High)
* 0.5100 (Equal Lows / P1D Low)
* 0.4800 (Rejection Block)
* 0.4400 (Order Block)
💬 Will ARB break equal highs toward the rejection block or collapse through equal lows?

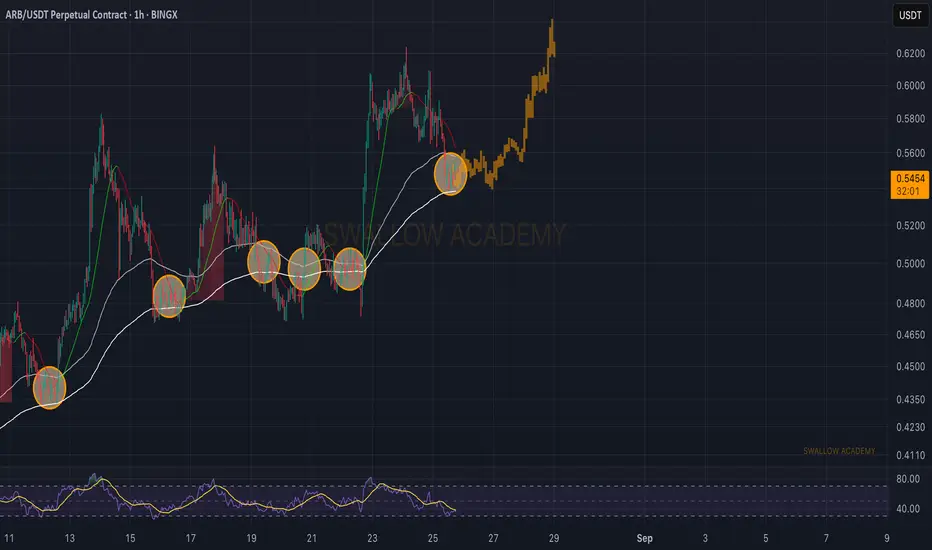
Arbitrum (ARB): Key Zone of EMAs | Looking For BounceKeeping it very simple on ARB, where our key zones are both 100 and 200 EMAs, which usually have been acting as zones of trend reversal.
So that's what we are looking for here as well: a proper MSB to form, which would then mean another upside movement of at least 15%.
Wait for that market structure break and only then enter!
Swallow Academy
ARBUSDT SHORT 1HCWT strategy
Plus points
Bearish Divergence
Price below jaw
Indicating short position and SL above HH

ARBUSDT Forming Bullish WaveARBUSDT is currently forming a bullish wave pattern, signaling a continuation of upward momentum after a period of accumulation. This setup often reflects strengthening buyer interest and growing confidence among investors. The market structure suggests that the pair could see a breakout, with projections pointing to potential gains of 30% to 40%+ in the coming sessions. The healthy trading volume further confirms strong participation and momentum support for this bullish outlook.
The consistent price movement within this wave formation highlights the potential for sustained upward growth. If ARBUSDT maintains its current pace and successfully breaks above key resistance levels, it could trigger a strong bullish rally. Traders should keep an eye on support and resistance zones to confirm the breakout and capitalize on possible price surges.
Investor sentiment toward ARBUSDT is also improving, with increasing participation and interest in the project. As more traders recognize the bullish technical structure and the possibility of strong returns, the pair is gaining traction as a favorable setup. With good volume and clear technical signals, ARBUSDT presents an attractive opportunity for those looking for mid-term upside potential.
✅ Show your support by hitting the like button and
✅ Leaving a comment below! (What is You opinion about this Coin)
Your feedback and engagement keep me inspired to share more insightful market analysis with you!

#ARB/USDT – Watching Key Support for Long Entry !#ARB
The price is moving within an ascending channel on the 1-hour frame, adhering well to it, and is on track to break it strongly upwards and retest it.
We have support from the lower boundary of the ascending channel, at 0.4880.
We have a downtrend on the RSI indicator that is about to break and retest, supporting the upside.
There is a major support area in green at 0.4800, which represents a strong basis for the upside.
Don't forget a simple thing: ease and capital.
When you reach the first target, save some money and then change your stop-loss order to an entry order.
For inquiries, please leave a comment.
We have a trend to hold above the 100 Moving Average.
Entry price: 0.4880.
First target: 0.5050.
Second target: 0.5327.
Third target: 0.5600.
Don't forget a simple thing: ease and capital.
When you reach the first target, save some money and then change your stop-loss order to an entry order.
For inquiries, please leave a comment.
Thank you.
ARBUSDT LOOKING STRONG 2x POTENTIALARB/USDT looking strong on daily time framee.
BUY HERE AT CMP: 0.4840
TP1: 0.55
TP2: 0.65
TP3: 0.98

ARB Breakout Alert! 🚨 AMEX:ARB Breakout Alert! 🚨
AMEX:ARB is currently testing the red resistance zone 🔴
If price breaks out, the first target will be the green line level 🎯
A confirmed breakout here would signal bullish continuation and could push price higher ✅

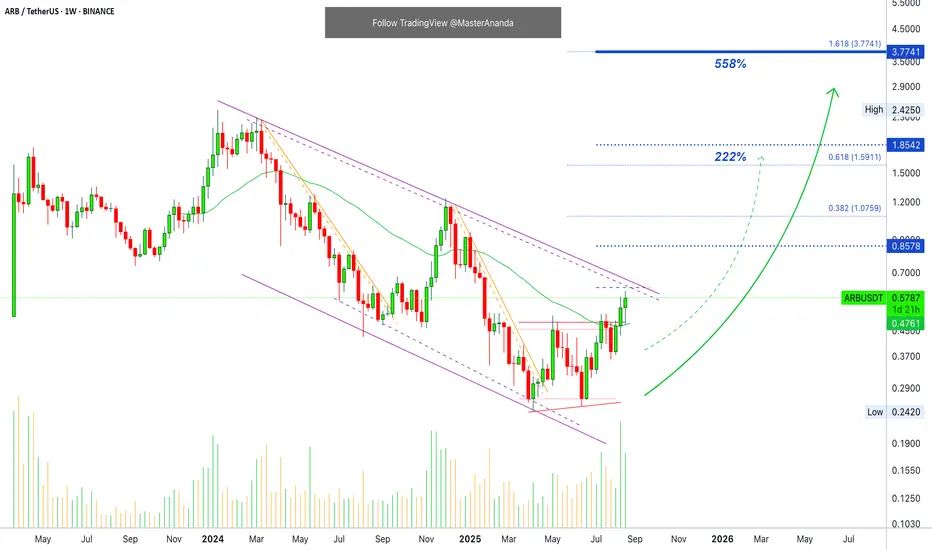
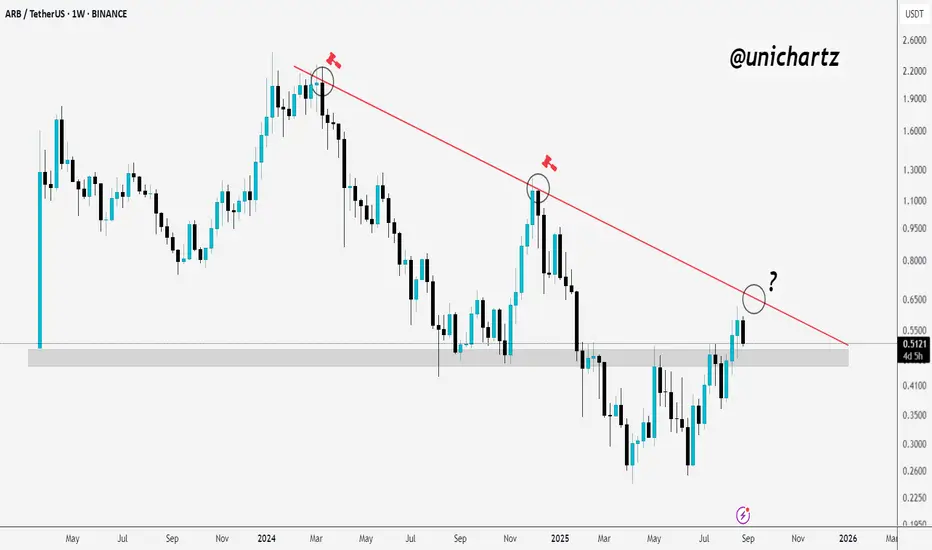
Arbitrum is getting better... Everything is about to speed up!ARB has been rising since the 16-July week, for 63 days. This is after the higher low. Since 7-April, we have a total of 133 days. With each passing day, the action comes closer to resistance. With each passing day, trading volume continues to rise on the bullish side. Just last week ARBUSDT produced the highest buy-volume since April 2023, more than two years ago.
Going deeper, you can see the big purple descending channel. Current action is happening within this channel and this can be considered bearish, but this is only if you are looking at the entire market from the perspective of this channel.
See a different perspective here:
Here we have a downtrend and when 7-April comes, the new all-time low, bearish volume is not present. The same day the all-time low was hit the session ended green. Prices start to move higher and volume starts to rise.
The action starts to move above multiple long-term moving averages and we get a strong RSI.
Finally, marketwide action and related projects will reveal the last piece of the puzzle. Ether hits a new all-time high, Bitcoin continues to do great, many altcoins are trading at multiple years high and yet had a chart that was almost the same to this, when it comes to the highs and lows.
Since the bottom is already in, we can expect long-term growth.
Arbitrum is already going up, it has been doing it for months. The good news is that everything is about to speed up.
Namaste.