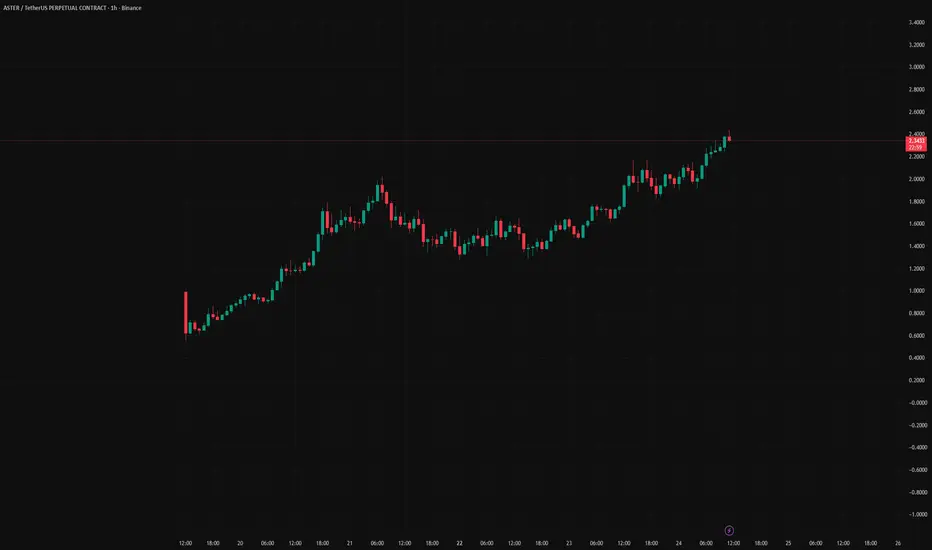
Drawing ASTERNice breakout on ASTER, but I’m not sure if it will retest support or push higher, since there’s a bullish engulfing candle.
ASTERUSDT.P trade ideas
Aster scalp short to $1.8356Aster scalp short to $1.8356
Sl: 1.9420
Tp area: $1.8486
Time sensitive
DTT strategy used to find trade. Learn more about it on x
Roughly 2RR trade

$ASTER stop loss HIT at $1.88, my ENTRY strategy nowMy $1.97 LONG on $ASTER was a LOSS, the stop loss at $1.88 did its job to limit the damage.
That's why no matter how bullish and optimistic a set-up can look and feel (I entered on a bullish market structure flip + bullish RSI divergence) - always keep the SL and manage it.
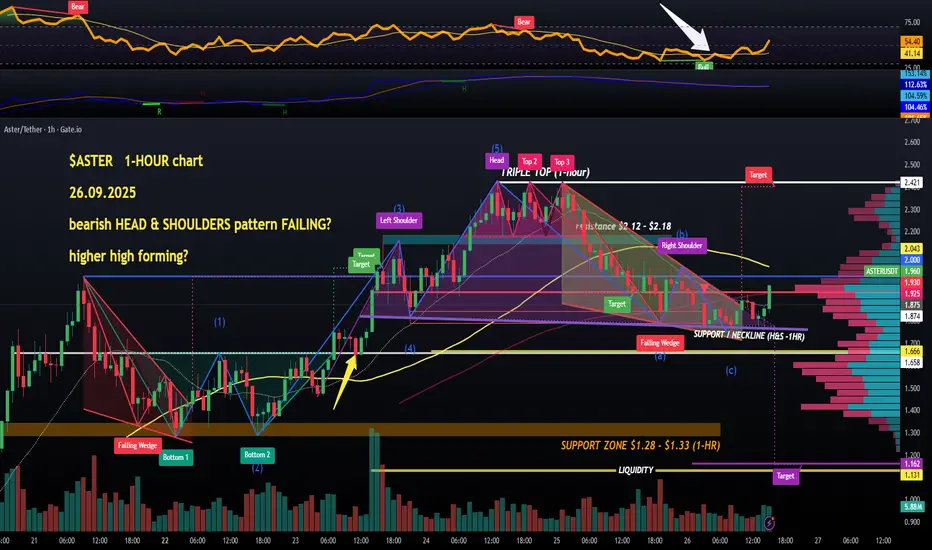
Currently #aster made a LOWER LOW following a LOWER HIGH (almost equal, and the pattern it created could be called a DOUBLE TOP, with bear RSI divergence as confirmation) after the double top breakdown (target = $1.61), so definitely in a DOWNTREND atm.
The correction (ABC) is coming to an end (could still hit $1.46), and I am going to start hunting for another long as the structure opens up some possibilities.
One set-up is already there on the HOURLY chart:
THE double bottom BREAKOUT (and above that rejection resistance zone $2.12 - $2.18), that's what I'm looking at in case of a BULLISH scenario.
It has to be a High Volume breakout and/or a retested breakout at least with rising volumes.
#BuyTheDip also makes sense, so I have limit orders in the orange SUPPORT ZONE ($1.28 - $1.33), and I will watch the price action around $1.45 and $1.61 for some reversal behaviour in real-time.
That's the updated plan, my long-term intention predominantly is to increase the bags at discount prices but also catch some leverage entries👽💙

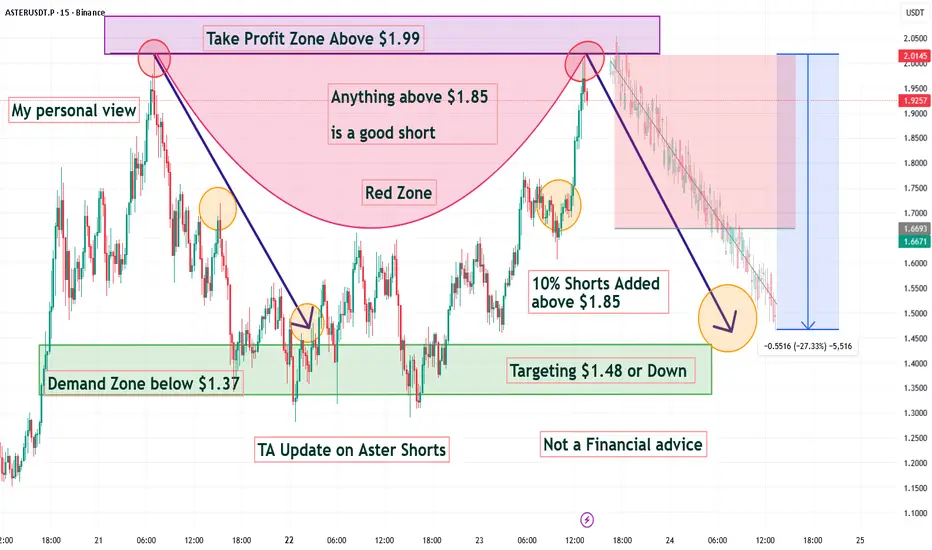
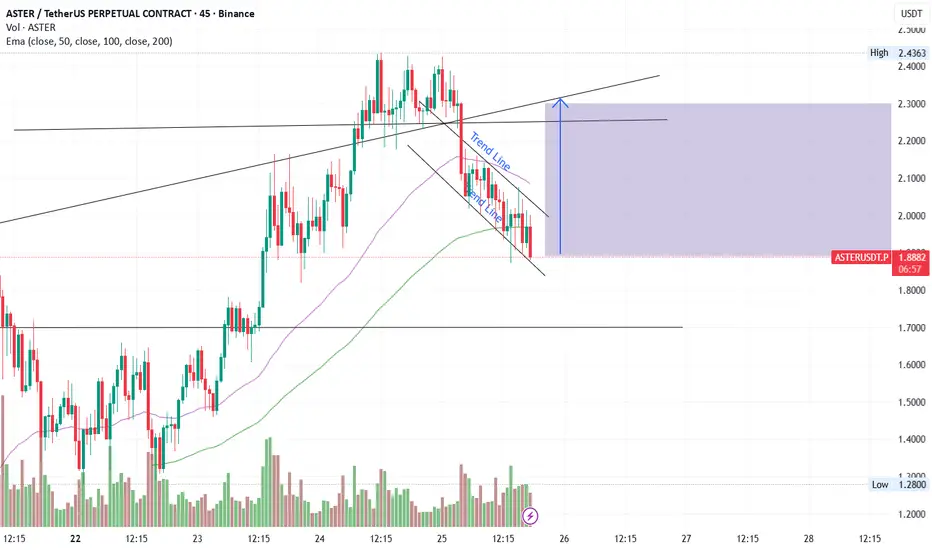
TA Update on ASTER Shorts Anything above $1.85 is a good shorTA Update on Aster Shorts
Anything above $1.85
is a good short
10% Shorts added above $1.85
Take Profit zone above $1.99
Demand Zone below $1.37
Targeting $1.48 or Down
Not a Financial advice
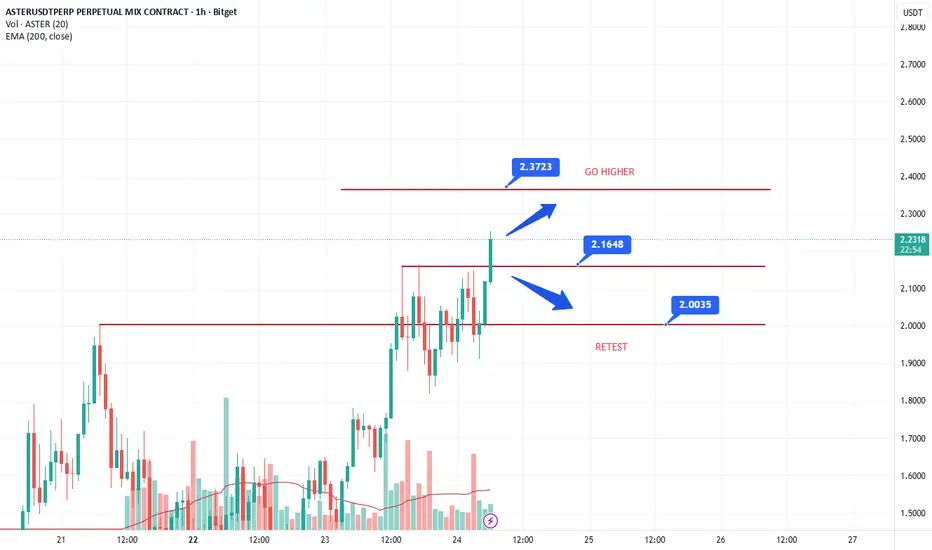
ASTERUSDT: Liquidity Grab & Key LevelsIt looks like $ASTER has made a clear move to grab liquidity below the recent swing low and is now showing signs of reversal. This is a critical juncture.
The Bullish Scenario:
For the move higher to materialize, we must hold the ≈1.90 range on the 1-hour timeframe. This area (highlighted in the chart) is acting as critical support following the liquidity sweep.
Target 1 : If ≈1.90 holds, we look for a push up to the first resistance zone at ≈2.16 (which represents a 12.73% move from current levels).
Target 2 : A break and hold above the first target opens the door for a continuation to the upper resistance/supply zone around ≈2.45 (which is near the swing high and a ≈26.36% move).
The Bearish Scenario:
If we lose and close below the ≈1.90 support range on the 1H, it would invalidate the immediate bullish reversal structure. In this case, we would expect a continuation of the downtrend to test the major structural support zone around ≈1.55.
Trade with discipline and patience. Always manage your risk.
ASTER - Perp DEX - Can It Really Beat Hyperliquid?BINANCE:ASTERUSDT.P has become the hot trend in the Perp DEX market. In just 30 days, liquidity and trading volume have surged over 200%. Even more impressive, it has already overtaken Hyperliquid with more than $330B in weekly volume, compared to HYPE’s $72B.
On the fundamentals side, BINANCE:ASTERUSDT.P isn’t positioning itself as just another swap DEX. It’s aiming to be a cross-chain liquidity hub, connecting Ethereum, Solana, BNB Chain, and beyond into one unified interface. The tokenomics also stand out: 53.5% of supply goes to airdrops, 30% to ecosystem and community growth, and only 5% to the team. This community-first model is rare, Telegram and X channels are buzzing with real users, memes, and thousands of authentic discussions.
From a technical perspective, BINANCE:ASTERUSDT.P is consolidating between $1.80–$2.15. Every test of resistance at $2.10–$2.15 has been met with selling, but if volume confirms a breakout, the next targets open at $2.40 and possibly $4.00. Key support zone at $1.70–$1.75, which has held up strongly at the 0.382 Fibonacci level. For now, the chart suggests ASTER is coiling for another leg upward.
Sentiment is bullish across the board. Indicators flash “buy,” and many traders see Aster as the next big narrative in decentralized derivatives. With a current market cap just above $3B compared to Hyperliquid’s $15B, the upside case remains huge.
Entry Points:
- EP 1: $2,00
- Ep 2: $2,16
Target Price:
- TP 1: $2,17
- TP 2: $2,40
- TP 3: $4,00
- TP 4: $14,00
Stop Loss
- ST: $1,26
Best
TheCryptoFire

ASTER ASTR/USDT Analysis
ASTR is currently trading around 1.72 under sustained selling pressure, following a Break of Structure (BoS) to the downside. This indicates that the short-term trend remains bearish.
At this stage, the price may retrace toward the supply zone at 2.00 – 2.10 before continuing its decline. This supply area is a critical resistance level, likely to trigger renewed selling pressure.
If the price fails to break above this supply zone, the probability of a deeper move increases, with the primary target set at the demand area around 1.53 – 1.54. This level will serve as key support, and a break below it could signal further bearish continuation.
Conclusion: ASTR remains bearish, with a possible pullback to supply before extending the downward move. Key focus areas are 2.00 – 2.10 (supply) and 1.53 – 1.54 (demand).

$ASTER 2nd move back up: LONG Same as the move before, trading the retracement.
Sentiment is still overall positive but price is moving off the majors ofc.
With a local bottom on BTC think the rally back up we can pull off $2.50 through the weekend.

$ASTER long position above $1.95 HOURLY close$ASTER LONG above $1.95 hourly candle close
higher low then higher high, rsi bullish shift, breakout from wedge, volumes, RSI BULL divergence
Stop loss $1.758
👽💙
ASTER — fleeting hype or here to stay? Suddenly breaking into the top of cryptocurrencies and DEXs, ASTER — of course with the support of CZ and Binance itself — has become the center of traders’ attention over the past week.
⚡️ Its commission revenue has already surpassed Hyperliquid’s by almost 10x. With that kind of backing, the token seems to have a bright future — but is that really the case? Time to find out:
Since launch, the token has delivered solid multiples, but now it’s starting to fade. Will its growth continue, or is a collapse ahead?
➡️ First, Money Flow shows a gradual outflow of liquidity from the token. Early investors are starting to lock in profits.
➡️ Second, since launch and even before the peaks, we’ve seen a divergence between buying volumes and price. Price was rising while buying volumes were falling. This points to weakening demand as the price climbed. Such a signal indicates a weak and unsustainable trend.
➡️ Third, the price is moving in an ascending channel and is now actively testing the lower boundary. If it breaks downward, that would mark an official shift into a distribution phase, with further decline likely.
Right now, the price shows no signs of strength. So it’s worth closely watching the nearest support at $1.88 — and beyond that, I expect at least a retest of the $1.70 lows, and possibly even new lows at $1.59.
📌 But what I can say for sure is that it’s hard to judge whether the current price is fair for the token. The market needs time to sort itself out. For me personally, ASTER looks more like a short story than a long one right now.

ASTERUSDT Update, IntradayPrevious post:
Aster Bounce at 0.50 Fibb area, if it breakouts, then Intra Long
If doesn't Breakout, i will wait for it to Breakdown the 0.50fibb area to short. targeting the 0.6 Golden Fibb.
Who doesn't love Fibonacci right? :)
Journal Entry #10.1
Price action broke 0.50fibb and smashed 0.618 Fibb $_$
now what's next? a waiting game for me.
I would wait for the market to create a good setup prior positioning.
Its a good sunday.
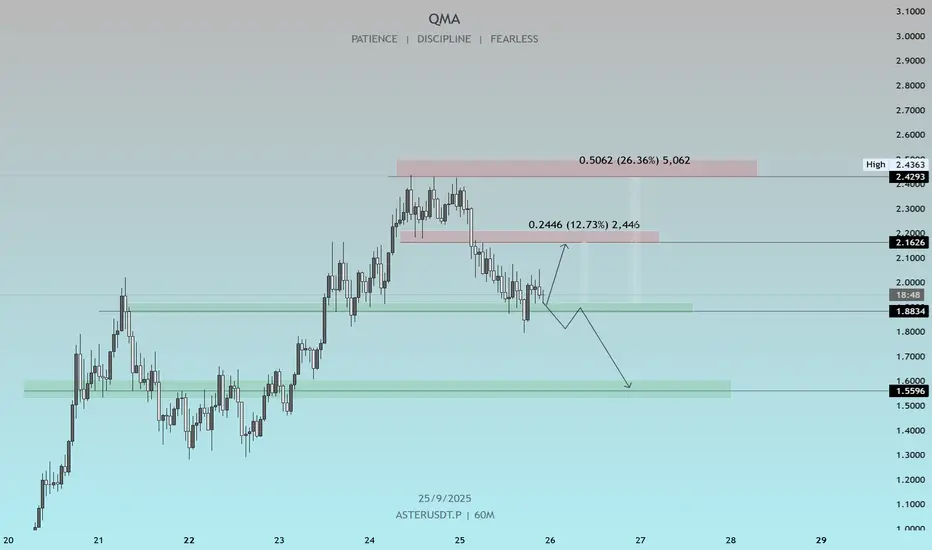
ASTERUSDT — Will Buy Zone Hold or Break?Overview
ASTER price is currently consolidating after a strong rally toward 2.42. On the 2-hour chart, we can clearly see two major highlighted areas: Buy Zone 1 (primary support) and Buy Zone 2 (deeper secondary support).
The structure still maintains a potential bullish continuation, but repeated weakness around support indicates risk of a breakdown if buyers fail to defend the current zone.
---
🔑 Key Levels
Nearest Support (Buy Zone 1): 1.75 – 1.95
Secondary Support (Buy Zone 2): 1.25 – 1.45
Minor Resistance: 2.12
Major Resistance: 2.33 – 2.42 (previous supply zone / local high)
Current Price: 1.91
---
📐 Technical Pattern
1. Bullish Flag / Rectangle
A sideways consolidation after a strong uptrend move, often a continuation pattern. A confirmed breakout to the upside could lead to a retest of 2.42.
2. Multiple Support Tests at Buy Zone 1
Several rejections at 1.8 – 1.9 confirm this zone as a critical short-term demand area. However, the more often a support is tested, the weaker it becomes.
3. Lower Highs Formation
Minor lower highs suggest mild selling pressure. This structure often precedes either a breakout or a breakdown, depending on which side gets taken out.
---
🚀 Bullish Scenario
Confirmation: A 2H close above 2.12 with rising volume.
Targets:
TP1 = 2.12 (breakout retest)
TP2 = 2.33
TP3 = 2.42 (previous high)
Extended Target: If 2.42 breaks, next psychological resistance sits around 2.80 – 3.00.
📌 Bullish entry ideas:
Aggressive: Buy within Buy Zone 1 with stop loss below 1.75.
Conservative: Wait for breakout above 2.12 + confirmed retest.
---
🐻 Bearish Scenario
Confirmation: A 2H close below 1.75 (breakdown from Buy Zone 1).
Targets:
TP1 = 1.50
TP2 = Buy Zone 2 (1.25 – 1.45)
Extended Target: If Buy Zone 2 fails, the structure shifts into a downtrend, potentially moving closer to 1.00.
📌 Bearish entry idea:
Enter short after breakdown (close <1.75), with stop above 1.95 (former support turned resistance).
---
📊 Risk Management
Always set stop losses below support (for longs) or above breakdown (for shorts).
Scale out profits at key resistance levels.
Keep risk per trade ≤2% of total capital.
---
⚠️ Things to Watch
False breakouts: Require volume confirmation.
Correlation with BTC/ETH: Broader market moves can strongly influence ASTER’s direction.
High volatility: Fakeouts may occur before the real move.
---
📌 Conclusion
As long as price holds above Buy Zone 1, the bullish continuation toward 2.12 – 2.42 remains valid.
A breakdown below 1.75 would invalidate the short-term bullish case and open the door toward Buy Zone 2.
Key decision point is very close — watch carefully for breakout or breakdown confirmation.
---
#ASTER #ASTRUSDT #CryptoAnalysis #BuyZone #SwingTrade #PriceAction #SupportResistance #BullishScenario #BearishScenario

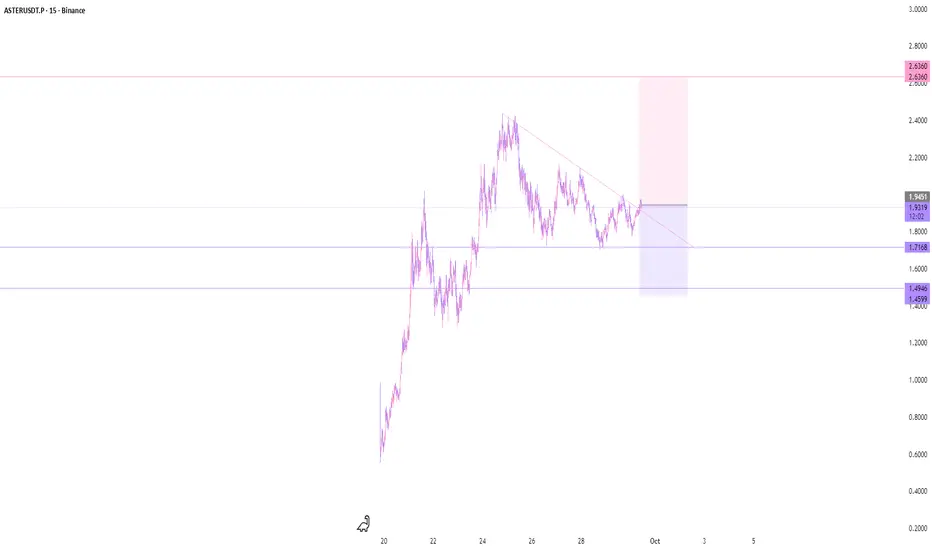
ASTERUSDT.P - September 30, 2025This is a high-probability setup with high reward potential.
Entry Price: 1.9451
Profit Level: 2.6360
Stop Level: 1.4599
Dirty Game (Keep Your Eyes Open)A no-KYC perp, launches token and allows traders (and themselves) 50x leverage directly from launch.
Peddles binary options and their own stablecoin
Let's not assume they abuse level 3 orderbook data (stops/liquidations/entry) to churn endless volume/'clearance fees'
And surely, hopefully, they don't build up unbacked debt in their system (god mode positions, FTX style)
It will likely play out okay, but this is one of those 'could explode' plays.
This one has a heavy duty handler.
Very experienced, very ruthless.
I see it playing out similarly to HYPE, but a lot more shameless.
There is no intention of playing fair.
They are not trying to convince you they are a long-term play like HYPE.
This is not just a harvest on gamblers/leverage traders, it is also a harvest on market makers.
Smart market makers will not touch this, most will play it double safe and lose, some will lose big.
ASTER PLAYBOOK:
Run price up hard and fast using, heavily leveraged seed money, while being immune to liquidations > ENTICE
Paint a cute chart > BUILD CONFIDENCE
Abuse level 3 data and god mode to harvest liquidations > ACCUMULATE STABILITY FUND
(run lows, tap highs, repeat)
Use stability funds to further run up price.
With HYPE;
the game slowed down when their risks got highlighted.
built up vultures who actively try to eat off their plate, limiting upside
has a 3x/10x max, where as this goes 50x
transparency makes it hard to be as shameless, but also attracted more capital that way
How high will it go?
It all depends on how much capital they fool into their game.
My guess, they will run it to some nice number while volatility is high (5$/10$), before slamming it 70-90% down.
Then low volatility churn for a year and try again.
None of this is financial advice.

ASTERUSDT.P Long Idea!!Journal Entry #14 Intraday-trader
The market vs RSI is showing a bullish divergence. Hence a POSSIBLE breakout from the trend line resistance.
A already entered from the bounce and hoping it does breaks. lmao
BINANCE:ASTERUSDT.P

Aster/USDT Shorting idea.BINANCE:ASTERUSDT.P has been pumping lately, and now its slowing down plus showing Bearish Divergence.
Waiting for confirmation to short and earn a bit.
ASTER Market Update📊 ASTER Market Update
ASTER has formed a bearish Double Top pattern ⚠️ and broke the blue support zone 🔵
What’s next? If price keeps retracing down, we have two green zone levels 🟢 where buyers previously accumulated.
These zones could give potential long entries or spots to accumulate more — but always wait for confirmation before entering ✅
⚡ Trade smart, not blind.

$ASTER short term? Just wanna give a update on aster.
Currently it has a bigger deviation above its main range running into the blue extension giving like a hammer look. I had one great short on aster so im not here to nailing or calling any tops or bottoms to perfection and shorting this can end bad quick. so a tight invalidition would be simply above the blue extension but its super volatile guys. see this just as a simple interpretation!:)
Going above the blue extension most likely will send it way higher again.
the drawing is also just a extreme idea. not looking for this ultra swings anymore

ASTER/USDT – Falling Wedge Setup with Bounce PotentialPrice has been consolidating inside a falling wedge pattern after the recent rejection near 2.40. Currently, it is sitting close to the 200 EMA support around the 1.89–1.90 zone.
A breakout above the wedge trendline could trigger a move back towards the 2.30–2.31 resistance area, which also aligns with the upper channel trendline.
Support: 1.89 / 1.87 (200 EMA + wedge bottom)
Resistance: 2.10 / 2.31 (wedge breakout + upper channel)
Bias: Bullish if wedge breakout confirms with volume
If the price fails to hold the 200 EMA, we may see further downside, but for now, the setup favors a potential trend continuation to the upside.
$ASTR in a DOWNTREND on 1-HOURLast night I was hunting for a second LONG on $ASTER after a great printer on the first one, was looking to enter on a BULLISH FLAG breakout at $2.46 but instead, the price reached $2.42, formed a TRIPLE TOP and corrected hard.
Then the triple top broke down below and reached the target at $1.93. Beautiful how these chart patterns hit one after another💙.
So right now the HOURLY has been in a DOWNTREND, so there are two options:
a) Try and buy/long in the flash crash zone (yellow box annotated on the chart) between $1.66 and $1.83.
The main chart support is down there at $1.65. Buyers should step in. 👽
b) Wait for a bullish market structure change and either catch another WAVE 3 or WAVE 5 impulses upwards.
That's the correct technical approach, when buying now is basically longing a DOWNTREND.
RSI also in a Downtrend after BEAR divergences, so we will need to see this change too.
Patience.


$ASTER - LONG position IN-PLAY, at resistance... BREAKOUT next?Longed $ASTER yesterday at $1.953 and even added to size at $1.99, so now my average long entry price is exactly $1.97.
It did have a nice rally last night which ended in the resistance zone I had on the chart (around mid-$2.10s), so no surprises.
All that matters is that it went on to put in a HIGHER LOW at $1.89 and currently is fighting for a BREAKOUT above the TRIANGLE upper trendline.
If it does break above the triangle and the mentioned resistance zone, the price appreciation towards $2.4 and $2.8 could be very swift.
I moved my STOP LOSS up to $1.88, which is just below the TRIANGLE breakdown point.

ASTER Momentum Could Push Toward $6
Aster (ASTER) has been one of the strongest performers in the market this week, rallying over 2,000% according to multiple sources. The project positions itself as a decentralized perp DEX with features like hidden orders, multi-chain support, and even on-chain stocks trading up to 100x leverage. Backing from YZi Labs, a firm associated with Binance’s founder CZ, has further fueled speculation and attracted whales.
Why I see $6 as a realistic short-term target:
Strong Momentum — Price action shows parabolic growth with high-volume confirmation. Momentum plays like this often overshoot before retracing.
Low Float & Supply Pressure — With a limited circulating supply, ASTER reacts quickly to buying pressure.
Speculative Catalysts — CEX listings (Bitunix already listed ASTER/USDT and perps) show growing traction, and traders are betting on a potential larger exchange listing.
Market Psychology — After such rapid gains, round numbers like $5 and $6 act as magnet levels, especially when retail FOMO is high.
My Trading Plan:
Entry: Pullbacks around $2.5–$3 zones (support from recent consolidation).
Target: $6 (psychological and Fibonacci extension level).
Stop-Loss: Below $2.0 (invalidate momentum structure).
Risk Factors:
Token unlocks could flood supply.
Extremely high volatility with potential 40–60% intraday swings.
Regulatory and adoption risks for perp DEXs.