ASTER (ASTERUSDT): Will Dump to 1.00$? Here's Why!📉ASTER formed a nice head and shoulders pattern on a hourly time frame.
The bearish violation of its neckline is a strong bearish reversal signal.
We can expect more decline and test of 1.198 / 1.00 level soon.
ASTERUSDT trade ideas

$ASTER 2nd move back up: LONG Same as the move before, trading the retracement.
Sentiment is still overall positive but price is moving off the majors ofc.
With a local bottom on BTC think the rally back up we can pull off $2.50 through the weekend.

$ASTER long position above $1.95 HOURLY close$ASTER LONG above $1.95 hourly candle close
higher low then higher high, rsi bullish shift, breakout from wedge, volumes, RSI BULL divergence
Stop loss $1.758
👽💙
ASTER – Long POIThe m15 trend was a nice ride up for this new shiny toy, now that it broke and flipped resistance we look at different structural POIs to get involved.
Currently price is trying to hold the anchored vwap from the weekend impulse, which also means it's trying to hold the low that created the last high.
I'm not very confident in this, since a few clicks around hyperliquid show us that longs chased quite a bit here and we likely flush them out.
Next demand zone is the 1.20 - 1.30 zone, filling the first imbalance and the other side of the vwap std.
Lose that, then we look at a full retrace of the weekend pump, which takes us to sub $1.
Always wait for ltf triggers on things like these, the moves here are very imbalanced, especially when they happen during the weekend.
$ASTER stop loss HIT at $1.88, my ENTRY strategy nowMy $1.97 LONG on $ASTER was a LOSS, the stop loss at $1.88 did its job to limit the damage.
That's why no matter how bullish and optimistic a set-up can look and feel (I entered on a bullish market structure flip + bullish RSI divergence) - always keep the SL and manage it.
Currently #aster made a LOWER LOW following a LOWER HIGH (almost equal, and the pattern it created could be called a DOUBLE TOP, with bear RSI divergence as confirmation) after the double top breakdown (target = $1.61), so definitely in a DOWNTREND atm.
The correction (ABC) is coming to an end (could still hit $1.46), and I am going to start hunting for another long as the structure opens up some possibilities.
One set-up is already there on the HOURLY chart:
THE double bottom BREAKOUT (and above that rejection resistance zone $2.12 - $2.18), that's what I'm looking at in case of a BULLISH scenario.
It has to be a High Volume breakout and/or a retested breakout at least with rising volumes.
#BuyTheDip also makes sense, so I have limit orders in the orange SUPPORT ZONE ($1.28 - $1.33), and I will watch the price action around $1.45 and $1.61 for some reversal behaviour in real-time.
That's the updated plan, my long-term intention predominantly is to increase the bags at discount prices but also catch some leverage entries👽💙

life changing trade: $ASTER LONG Aster has been a trade for the books! I have spot buys from 0.40 cents and perp buys from 0.67 cents
This 30% pull back is gearing up for the perfect trade setup
We have a bullish 4 hour close at a major fib retracement level correlating with HTF and LTF
Safe buy anything under $1.66
TP $2.4 or hold long term investment
I think weekly low will be $1.26 which has already hit. 9/21

longing Astergiven the Risk to Reward, it seems like a good opp.
Wait until RSI gets oversold, then enter.

Aster/USDT Shorting idea.BINANCE:ASTERUSDT.P has been pumping lately, and now its slowing down plus showing Bearish Divergence.
Waiting for confirmation to short and earn a bit.
ASTER Ready for Next Breakout? Key Levels to WatchASTER/USDT has recently pulled back after testing resistance around 1.95, showing short-term consolidation.
A breakout occurs with a massive green candle spike, propelling price vertically to 1.75-1.95 in a near-vertical FOMO-driven rally—classic "pump" signature of a new listing
Immediate Resistance: 1.75 – A breakout above this could open the way toward 2.19 and 2.61.
Strong Support: 1.49 – Price is currently holding above this zone; losing it may trigger a deeper correction toward 1.28 or even 1.13.
Trend: The overall structure remains bullish, as the market is still trading above multiple higher lows.
Outlook: As long as ASTER holds above 1.49, the bias stays positive with potential upside targets at 1.75 → 2.19 → 2.61.

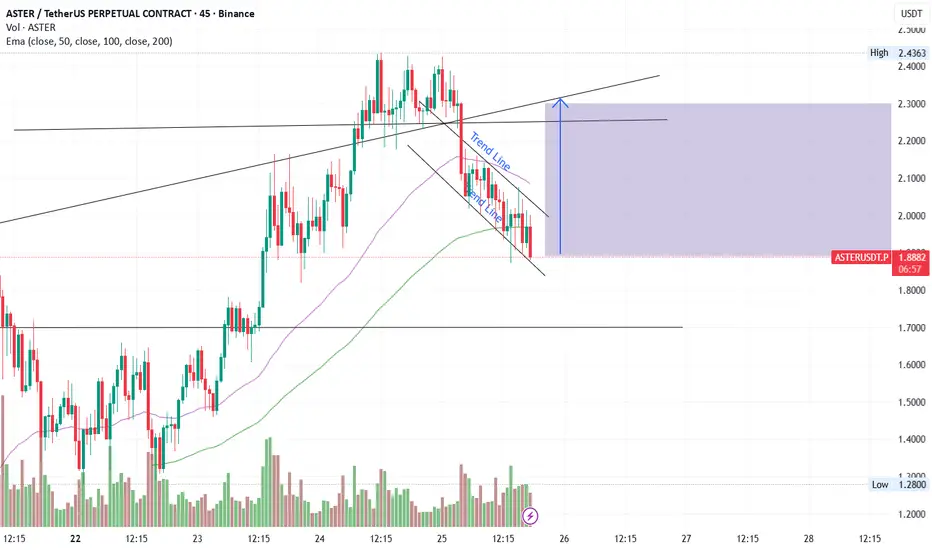
ASTER/USDT – Falling Wedge Setup with Bounce PotentialPrice has been consolidating inside a falling wedge pattern after the recent rejection near 2.40. Currently, it is sitting close to the 200 EMA support around the 1.89–1.90 zone.
A breakout above the wedge trendline could trigger a move back towards the 2.30–2.31 resistance area, which also aligns with the upper channel trendline.
Support: 1.89 / 1.87 (200 EMA + wedge bottom)
Resistance: 2.10 / 2.31 (wedge breakout + upper channel)
Bias: Bullish if wedge breakout confirms with volume
If the price fails to hold the 200 EMA, we may see further downside, but for now, the setup favors a potential trend continuation to the upside.
$ASTR in a DOWNTREND on 1-HOURLast night I was hunting for a second LONG on $ASTER after a great printer on the first one, was looking to enter on a BULLISH FLAG breakout at $2.46 but instead, the price reached $2.42, formed a TRIPLE TOP and corrected hard.
Then the triple top broke down below and reached the target at $1.93. Beautiful how these chart patterns hit one after another💙.
So right now the HOURLY has been in a DOWNTREND, so there are two options:
a) Try and buy/long in the flash crash zone (yellow box annotated on the chart) between $1.66 and $1.83.
The main chart support is down there at $1.65. Buyers should step in. 👽
b) Wait for a bullish market structure change and either catch another WAVE 3 or WAVE 5 impulses upwards.
That's the correct technical approach, when buying now is basically longing a DOWNTREND.
RSI also in a Downtrend after BEAR divergences, so we will need to see this change too.
Patience.

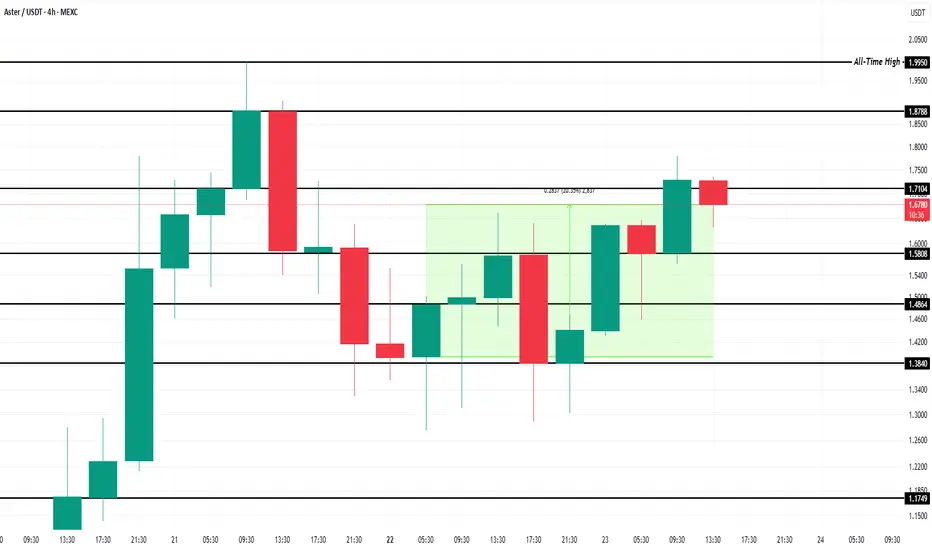
Aster Price Up 16% in 24 Hours as Buyers Return StrongAt the time of writing, Aster is priced at $1.67, holding firm above its $1.58 support. For now, the altcoin is likely to remain rangebound between $1.58 and $1.71 as it consolidates recent gains.
If the broader market turns favorable, Aster could breach $1.71 and move toward $1.87. Such momentum would bring the token closer to retesting its all-time high of $1.99, a milestone last seen during peak bullish phases.
However, downside risks remain. A break below $1.58 would signal weakening demand, potentially driving Aster down to $1.48. This scenario would invalidate the current bullish outlook, highlighting the importance of strong market support.
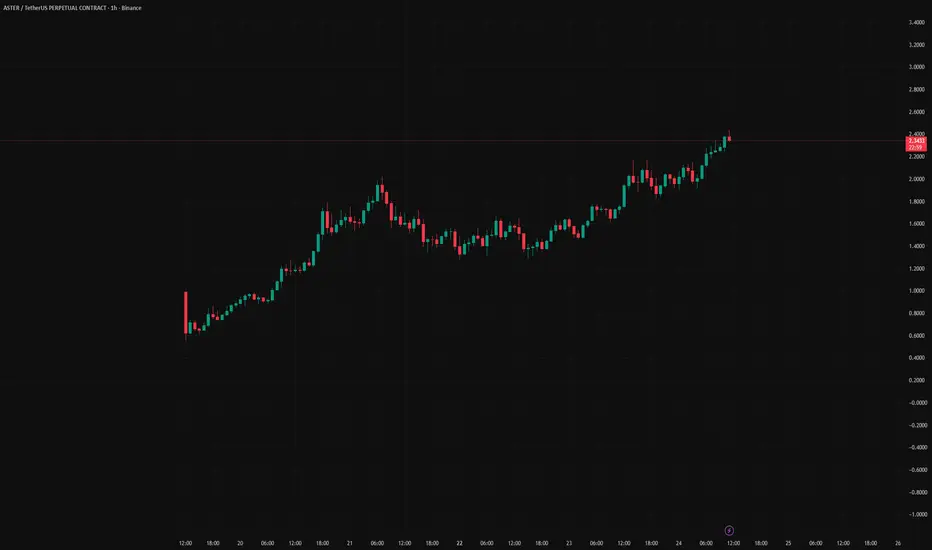
ASTER Momentum Could Push Toward $6
Aster (ASTER) has been one of the strongest performers in the market this week, rallying over 2,000% according to multiple sources. The project positions itself as a decentralized perp DEX with features like hidden orders, multi-chain support, and even on-chain stocks trading up to 100x leverage. Backing from YZi Labs, a firm associated with Binance’s founder CZ, has further fueled speculation and attracted whales.
Why I see $6 as a realistic short-term target:
Strong Momentum — Price action shows parabolic growth with high-volume confirmation. Momentum plays like this often overshoot before retracing.
Low Float & Supply Pressure — With a limited circulating supply, ASTER reacts quickly to buying pressure.
Speculative Catalysts — CEX listings (Bitunix already listed ASTER/USDT and perps) show growing traction, and traders are betting on a potential larger exchange listing.
Market Psychology — After such rapid gains, round numbers like $5 and $6 act as magnet levels, especially when retail FOMO is high.
My Trading Plan:
Entry: Pullbacks around $2.5–$3 zones (support from recent consolidation).
Target: $6 (psychological and Fibonacci extension level).
Stop-Loss: Below $2.0 (invalidate momentum structure).
Risk Factors:
Token unlocks could flood supply.
Extremely high volatility with potential 40–60% intraday swings.
Regulatory and adoption risks for perp DEXs.
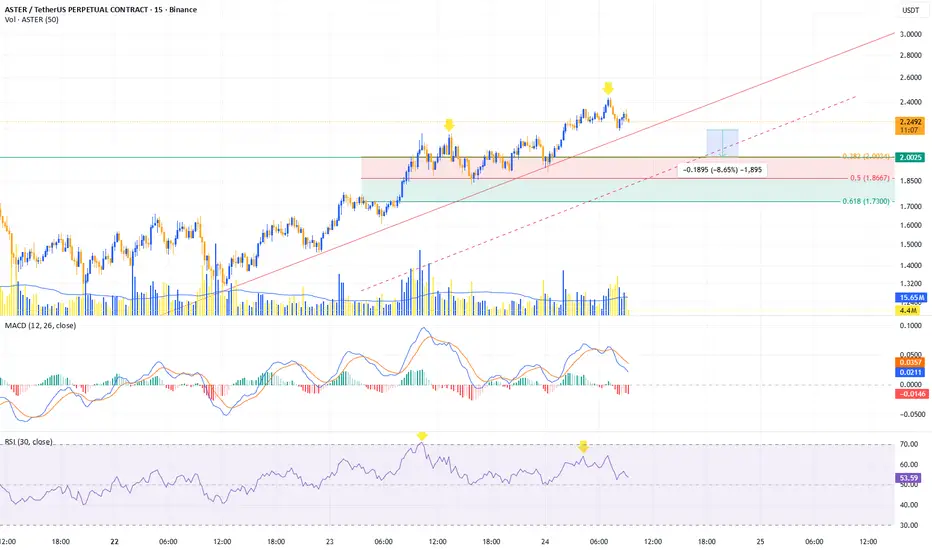
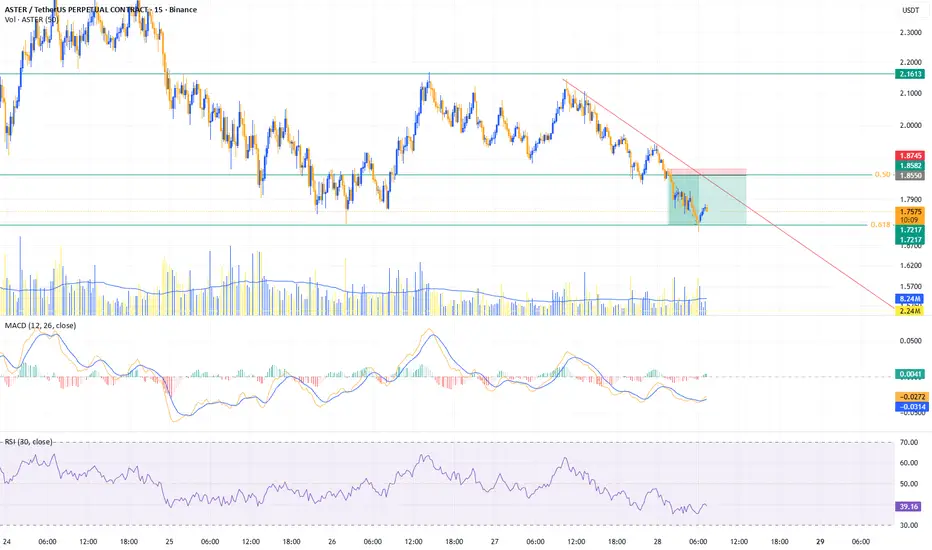
ASTERUSDT Update, IntradayPrevious post:
Aster Bounce at 0.50 Fibb area, if it breakouts, then Intra Long
If doesn't Breakout, i will wait for it to Breakdown the 0.50fibb area to short. targeting the 0.6 Golden Fibb.
Who doesn't love Fibonacci right? :)
Journal Entry #10.1
Price action broke 0.50fibb and smashed 0.618 Fibb $_$
now what's next? a waiting game for me.
I would wait for the market to create a good setup prior positioning.
Its a good sunday.
ASTERUSDT — Will Buy Zone Hold or Break?Overview
ASTER price is currently consolidating after a strong rally toward 2.42. On the 2-hour chart, we can clearly see two major highlighted areas: Buy Zone 1 (primary support) and Buy Zone 2 (deeper secondary support).
The structure still maintains a potential bullish continuation, but repeated weakness around support indicates risk of a breakdown if buyers fail to defend the current zone.
---
🔑 Key Levels
Nearest Support (Buy Zone 1): 1.75 – 1.95
Secondary Support (Buy Zone 2): 1.25 – 1.45
Minor Resistance: 2.12
Major Resistance: 2.33 – 2.42 (previous supply zone / local high)
Current Price: 1.91
---
📐 Technical Pattern
1. Bullish Flag / Rectangle
A sideways consolidation after a strong uptrend move, often a continuation pattern. A confirmed breakout to the upside could lead to a retest of 2.42.
2. Multiple Support Tests at Buy Zone 1
Several rejections at 1.8 – 1.9 confirm this zone as a critical short-term demand area. However, the more often a support is tested, the weaker it becomes.
3. Lower Highs Formation
Minor lower highs suggest mild selling pressure. This structure often precedes either a breakout or a breakdown, depending on which side gets taken out.
---
🚀 Bullish Scenario
Confirmation: A 2H close above 2.12 with rising volume.
Targets:
TP1 = 2.12 (breakout retest)
TP2 = 2.33
TP3 = 2.42 (previous high)
Extended Target: If 2.42 breaks, next psychological resistance sits around 2.80 – 3.00.
📌 Bullish entry ideas:
Aggressive: Buy within Buy Zone 1 with stop loss below 1.75.
Conservative: Wait for breakout above 2.12 + confirmed retest.
---
🐻 Bearish Scenario
Confirmation: A 2H close below 1.75 (breakdown from Buy Zone 1).
Targets:
TP1 = 1.50
TP2 = Buy Zone 2 (1.25 – 1.45)
Extended Target: If Buy Zone 2 fails, the structure shifts into a downtrend, potentially moving closer to 1.00.
📌 Bearish entry idea:
Enter short after breakdown (close <1.75), with stop above 1.95 (former support turned resistance).
---
📊 Risk Management
Always set stop losses below support (for longs) or above breakdown (for shorts).
Scale out profits at key resistance levels.
Keep risk per trade ≤2% of total capital.
---
⚠️ Things to Watch
False breakouts: Require volume confirmation.
Correlation with BTC/ETH: Broader market moves can strongly influence ASTER’s direction.
High volatility: Fakeouts may occur before the real move.
---
📌 Conclusion
As long as price holds above Buy Zone 1, the bullish continuation toward 2.12 – 2.42 remains valid.
A breakdown below 1.75 would invalidate the short-term bullish case and open the door toward Buy Zone 2.
Key decision point is very close — watch carefully for breakout or breakdown confirmation.
---
#ASTER #ASTRUSDT #CryptoAnalysis #BuyZone #SwingTrade #PriceAction #SupportResistance #BullishScenario #BearishScenario

$ASTER - LONG position IN-PLAY, at resistance... BREAKOUT next?Longed $ASTER yesterday at $1.953 and even added to size at $1.99, so now my average long entry price is exactly $1.97.
It did have a nice rally last night which ended in the resistance zone I had on the chart (around mid-$2.10s), so no surprises.
All that matters is that it went on to put in a HIGHER LOW at $1.89 and currently is fighting for a BREAKOUT above the TRIANGLE upper trendline.
If it does break above the triangle and the mentioned resistance zone, the price appreciation towards $2.4 and $2.8 could be very swift.
I moved my STOP LOSS up to $1.88, which is just below the TRIANGLE breakdown point.

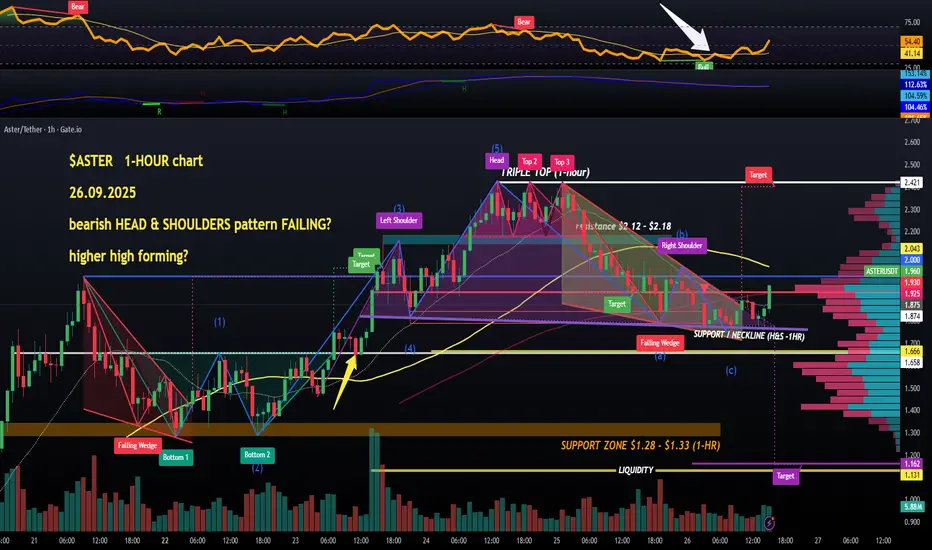
$ASTER: bearish HEAD & SHOULDERS pattern after a TRIPLE TOP$ASTER late night UPDATE cause things could happen overnight.
Clearly a bearish HEAD & SHOULDERS chart patter with that nasty TRIPLE TOP. Looks like a castle to me. Not a good castle, it's an enemy one.
Breakdown level: $1.77, targetting $1.16.
Not good at all. I expected more momentum, but that died off, the RSI in a downtrend without divergences.
And all the fat LIQUIDITY clusters are overhead, too.
Support at $1.65, and the orange zone on the HOURLY chart.
Could we get a shocking correction to the technical targets just above $1? That would be a gift, actually, but let's wait and see. I put some super stink limit orders at $1.34 and $1.18.
They probably won't get triggered, but it costs nothing, and I could get lucky with catching a wick down, it happens, actually. You do you, things are looking rough for the time being💙👽

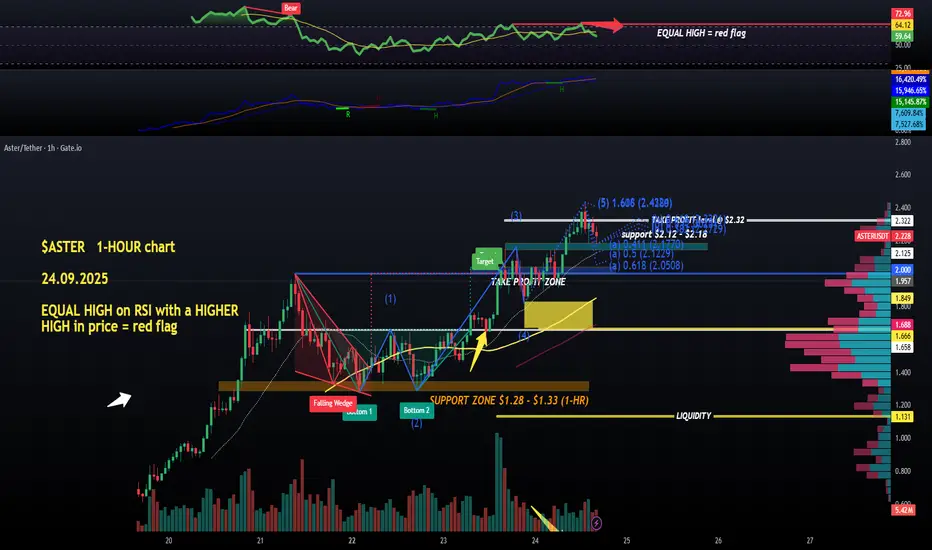
$ASTER with a red flag after an EQUAL RSI high while price ATH$ASTER did hit my full take profit level ($2.32) on the long opened at $1.71, it even extended to its #ATH at $2.43, so the leverage is gone and that was a perfect BREAKOUT trade.
What next, apart from a strong #HODL on my spot position ($1.4 average entry, not great, not bad)?
On the HOURLY chart it looks like that was WAVE 5 (the last impulsive wave up in Elliot's Wave Theory) reaching ATH but we got some form of a BEAR RSI divergence due to only an equal high while the price action clearly made a solid leg up.
So, i will be looking to catch some long entries on a correction, obviously, my first level to watch would be the support zone betwen $2 and $2.06.
Will need to see better volumes today and a better looking RSI profile first. OBV hidden bullish divergence recently.
So, waiting on a correction, basically and monitoring the 15-MIN chart (next post) 💙👽
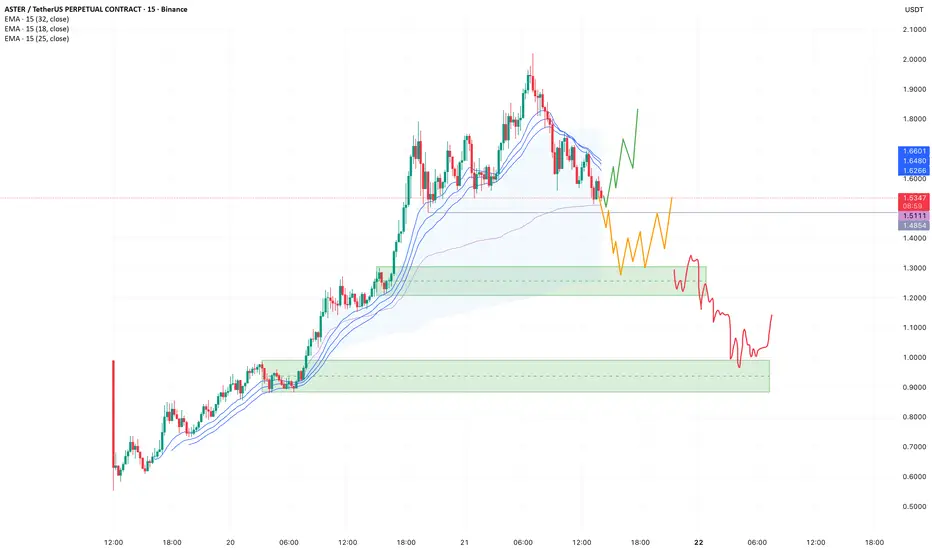
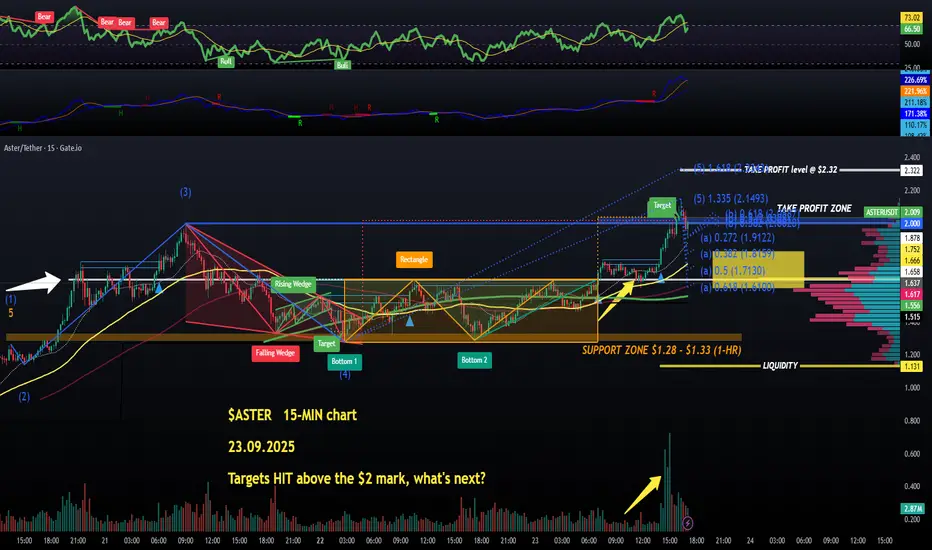
$ASTER long PRINTING, initial TARGETS just above $2 HITWhat a great rally for $ASTER to break above the $2 mark. Partially profit-taken here, let's zoom in on the 15-MIN chart again to find the next target, both for profit taking and for re-entries.
Ok so this ongoing run is basically the last wave, it could be ending now or extending to $2.32 and above. So I will take some profits there and let the rest of the long run with a STOP LOSS at $2.63 like I previously said.
If we are going to see a minor correction, it will likely fall to $1.61 - $1.82 zone. This is where you could add/re-enter.
Support is at $1.65 so we don't wanna see MORE THAN ONE candle close below this level, or it will likely become a bigger correction.
Another big support zone is $1.28 - $1.33 (highlighted as an ORANGE BOX).
I don't think we will see the priceaction below it very soon, so I also put up some limit ORDERS in that zone.
Any of you guys started using ASTER dex yet? #Airdrop will be absolutely spectacular from this. I can make a #Tutorial if any people are interesed in free money, let me know in comments 👽💙
ASTERUSDT.P - September 20, 2025Looking for a buyback/long opportunity on $ASTER if it retraces to the 0.9640 level. Will wait to see how it reacts there with confirmation and volume. Avoiding the current parabolic state. If it keeps pushing higher, happy for all the holders out there!

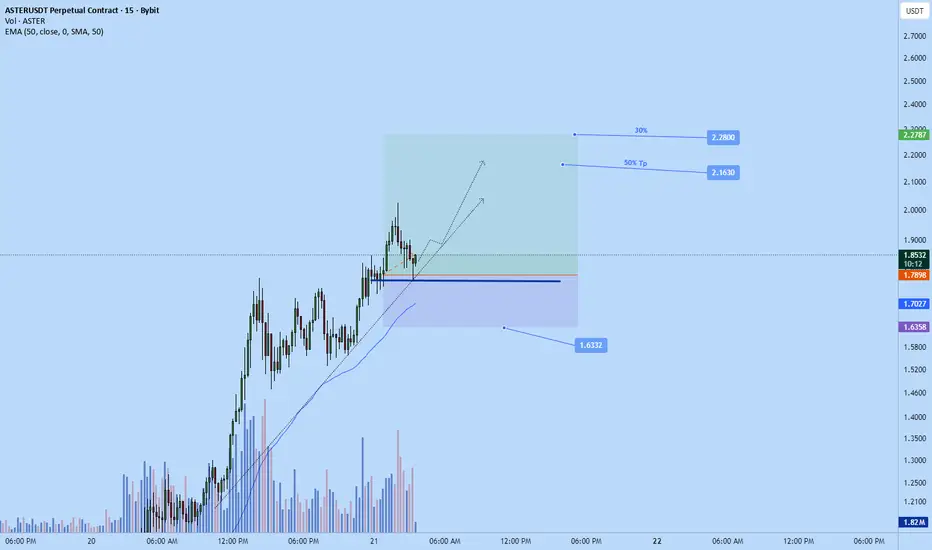
Aster scalp long to $2.1630Opened a long position on Aster. Aiming for $2.1630 and higher prices
Its a relatively new dex token on bsc with a lot of volume . Been pumping and doesn't looks like its ready to reverse. Looking to catch a piece of the move and leave a runner.
2-3RR
ASTER/USDT 15MINThe price is currently trading within an ascending wedge, a pattern that often signals a potential bearish reversal if support breaks.
Bullish Breakout
If price breaks above the wedge with volume, next target is $1.05–$1.11
Confirmation needed with strong candle close above resistance.
Bearish Breakdown
If price loses $0.9314, expect pullback toward $0.8922 or even $0.8410
Wedge breakdown often leads to sharp corrections.
The ascending wedge suggests caution—either a breakout toward $1.11 or a breakdown toward $0.84. Traders should monitor volume and price action closely around the $0.9314 support zone.

ASTER ASTR/USDT Analysis
ASTR is currently trading around 1.72 under sustained selling pressure, following a Break of Structure (BoS) to the downside. This indicates that the short-term trend remains bearish.
At this stage, the price may retrace toward the supply zone at 2.00 – 2.10 before continuing its decline. This supply area is a critical resistance level, likely to trigger renewed selling pressure.
If the price fails to break above this supply zone, the probability of a deeper move increases, with the primary target set at the demand area around 1.53 – 1.54. This level will serve as key support, and a break below it could signal further bearish continuation.
Conclusion: ASTR remains bearish, with a possible pullback to supply before extending the downward move. Key focus areas are 2.00 – 2.10 (supply) and 1.53 – 1.54 (demand).
