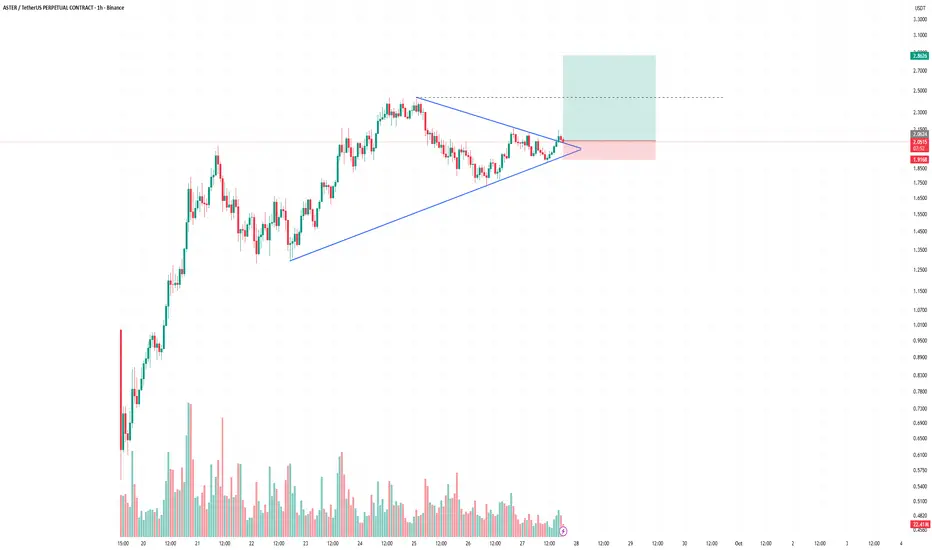
$ASTER - my reasoning (LONG $1.881)I promised more details regarding my $ASTER long entry a few hrs ago at $1.881, and here is my full reasoning for all it's worth.
First of all, the attached Liquidations heatmap (#Binance one as they probably hold some stake in this, not to mention CZ, the biggest CRYPTOCAP:BNB holder) points to much larger pools of Liqudity around $2.2 and above the ATH, $2.41-$2.5.
So that's the most likely direction also backed by fundamentals, such as record daily revenues, growing users numbers etc. Liquidity wise, we could also sweep the recent late longs down to $1.6 before another explosive leg up.
So the STOP LOSS: $1.547
Very wide, but much higher targets explain this, and the FIRST TARGET (30% cash-out) sits at $2.62.
Then we see what happens, for now we have a DOUBLE BOTTOM pattern to rely on, and a volume spike at the start of US session.
Very risky trade due to the Bitcoin dominance bullishness, so easy with the stakes at risk. 💙
ASTERUSDT trade ideas

ASTER — fleeting hype or here to stay? Suddenly breaking into the top of cryptocurrencies and DEXs, ASTER — of course with the support of CZ and Binance itself — has become the center of traders’ attention over the past week.
⚡️ Its commission revenue has already surpassed Hyperliquid’s by almost 10x. With that kind of backing, the token seems to have a bright future — but is that really the case? Time to find out:
Since launch, the token has delivered solid multiples, but now it’s starting to fade. Will its growth continue, or is a collapse ahead?
➡️ First, Money Flow shows a gradual outflow of liquidity from the token. Early investors are starting to lock in profits.
➡️ Second, since launch and even before the peaks, we’ve seen a divergence between buying volumes and price. Price was rising while buying volumes were falling. This points to weakening demand as the price climbed. Such a signal indicates a weak and unsustainable trend.
➡️ Third, the price is moving in an ascending channel and is now actively testing the lower boundary. If it breaks downward, that would mark an official shift into a distribution phase, with further decline likely.
Right now, the price shows no signs of strength. So it’s worth closely watching the nearest support at $1.88 — and beyond that, I expect at least a retest of the $1.70 lows, and possibly even new lows at $1.59.
📌 But what I can say for sure is that it’s hard to judge whether the current price is fair for the token. The market needs time to sort itself out. For me personally, ASTER looks more like a short story than a long one right now.

$ASTER ASTERUSTD #bullish #uptrend Currently in a bullish trend. Watch for potential breakouts above resistance levels.
Support at $1.71
Resistance at $1.88
First Take Profit at $2.40
Look for -
Announcement on listing
Layer One

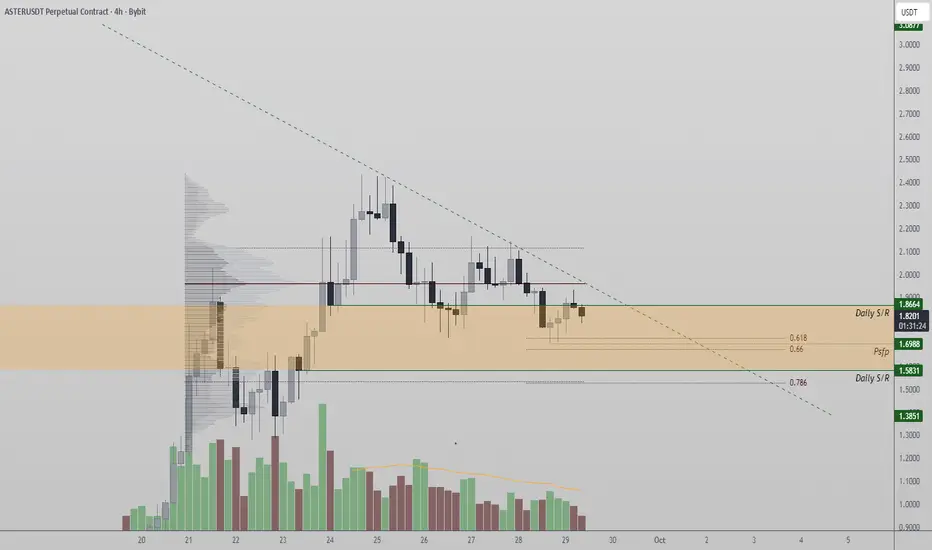
ASTR – Testing $1.50 Support Amid Corrective PhaseASTR remains in a corrective structure after losing its point of control. The $1.50 level is the next key support where buyers may attempt to defend and build accumulation.
The asset has struggled to regain momentum after falling below its high-volume node. Price action is now approaching a crucial support zone, which may serve as the foundation for a consolidation range.
Key Technical Points:
- Point of control lost, confirming corrective momentum.
- Next major support lies at $1.50.
- Dynamic resistance must be broken with volume for bullish rotation.
ASTR has experienced notable weakness after its corrective downturn pushed price below the point of control. This breakdown suggests sellers remain in control in the short term. However, the $1.50 support zone is critical for bulls, as a strong bounce here could lay the groundwork for a consolidation range and eventual recovery.
For the bullish case to regain credibility, ASTR must reclaim dynamic resistance on increased volume. Without this, further corrective behavior may continue, with the market settling into a range-bound structure before any breakout attempt.
What to Expect in the Coming Price Action:
If $1.50 holds, ASTR may consolidate and prepare for a recovery. A breach of dynamic resistance with strong demand would mark the start of a bullish rotation. Failure to hold support risks deeper declines.
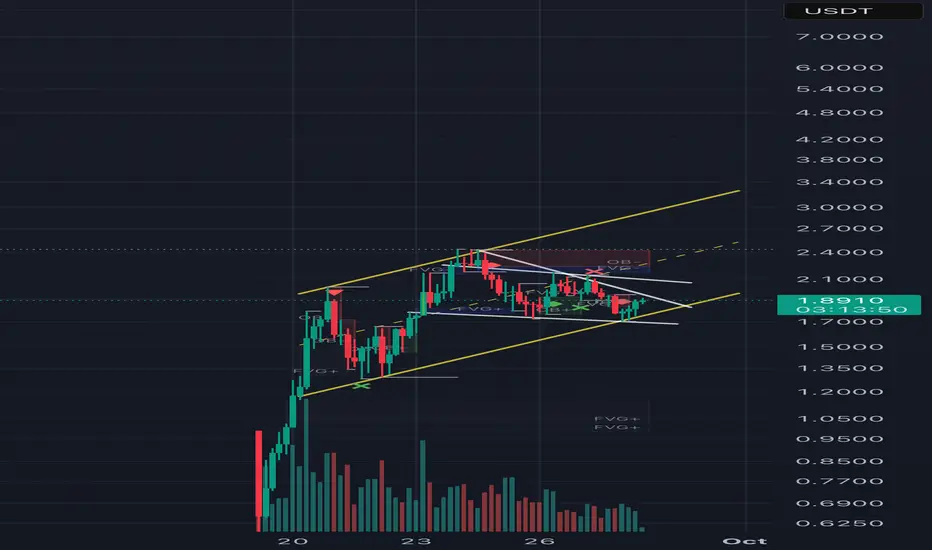
ASTER/USDT – Bullish Flag Inside Ascending Channel | Target $3Description:
ASTER is currently trading within a strong ascending channel on the 4H timeframe.
After an impulsive rally, price action has formed a bullish flag, consolidating above key dynamic support.
🔑 Key Points:
• Price has tested and respected the lower channel support (~$1.70–$1.80).
• Multiple Fair Value Gaps (FVG) below have been filled, reducing downside risk.
• An important Order Block (OB) and resistance zone sits around $2.30. A breakout above this level would confirm strength.
• Volume shows decreasing sell pressure during consolidation, adding confidence to the bullish setup.
📈 Expectation:
As long as the structure holds, a breakout from the flag could extend the bullish leg toward the $3 psychological level, which also aligns with the upper channel resistance.
❌ Invalidation:
A breakdown below $1.70 would negate this bullish scenario.
Aster dump back to $1.4I just opened this short position on aster.
sl: 2.1
Aiming for $1.4 area however, I'll look to scale out 75% tp around $1.57 area
2-2.64 RR
Time sensitive

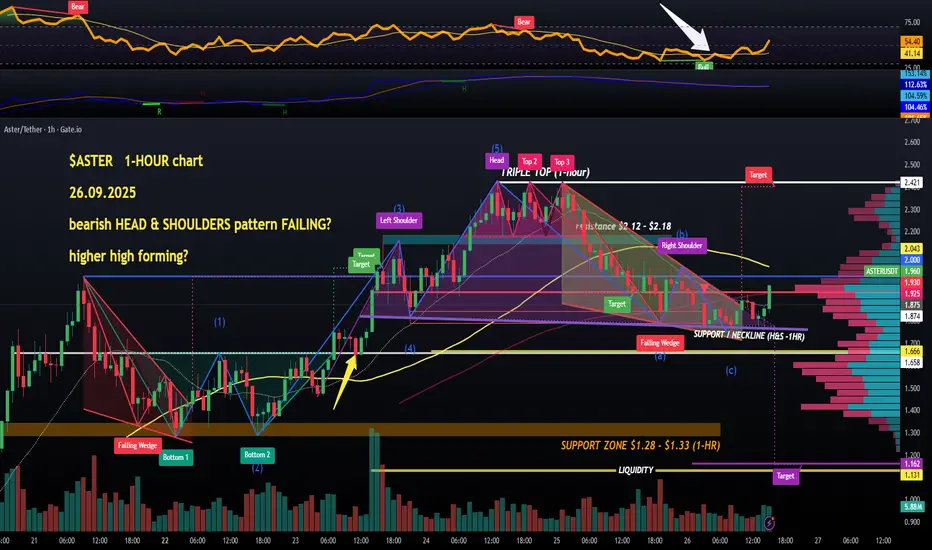
$ASTER stop loss HIT at $1.88, my ENTRY strategy nowMy $1.97 LONG on $ASTER was a LOSS, the stop loss at $1.88 did its job to limit the damage.
That's why no matter how bullish and optimistic a set-up can look and feel (I entered on a bullish market structure flip + bullish RSI divergence) - always keep the SL and manage it.
Currently #aster made a LOWER LOW following a LOWER HIGH (almost equal, and the pattern it created could be called a DOUBLE TOP, with bear RSI divergence as confirmation) after the double top breakdown (target = $1.61), so definitely in a DOWNTREND atm.
The correction (ABC) is coming to an end (could still hit $1.46), and I am going to start hunting for another long as the structure opens up some possibilities.
One set-up is already there on the HOURLY chart:
THE double bottom BREAKOUT (and above that rejection resistance zone $2.12 - $2.18), that's what I'm looking at in case of a BULLISH scenario.
It has to be a High Volume breakout and/or a retested breakout at least with rising volumes.
#BuyTheDip also makes sense, so I have limit orders in the orange SUPPORT ZONE ($1.28 - $1.33), and I will watch the price action around $1.45 and $1.61 for some reversal behaviour in real-time.
That's the updated plan, my long-term intention predominantly is to increase the bags at discount prices but also catch some leverage entries👽💙

ASTER ASTR/USDT Analysis
ASTR is currently trading around 1.72 under sustained selling pressure, following a Break of Structure (BoS) to the downside. This indicates that the short-term trend remains bearish.
At this stage, the price may retrace toward the supply zone at 2.00 – 2.10 before continuing its decline. This supply area is a critical resistance level, likely to trigger renewed selling pressure.
If the price fails to break above this supply zone, the probability of a deeper move increases, with the primary target set at the demand area around 1.53 – 1.54. This level will serve as key support, and a break below it could signal further bearish continuation.
Conclusion: ASTR remains bearish, with a possible pullback to supply before extending the downward move. Key focus areas are 2.00 – 2.10 (supply) and 1.53 – 1.54 (demand).

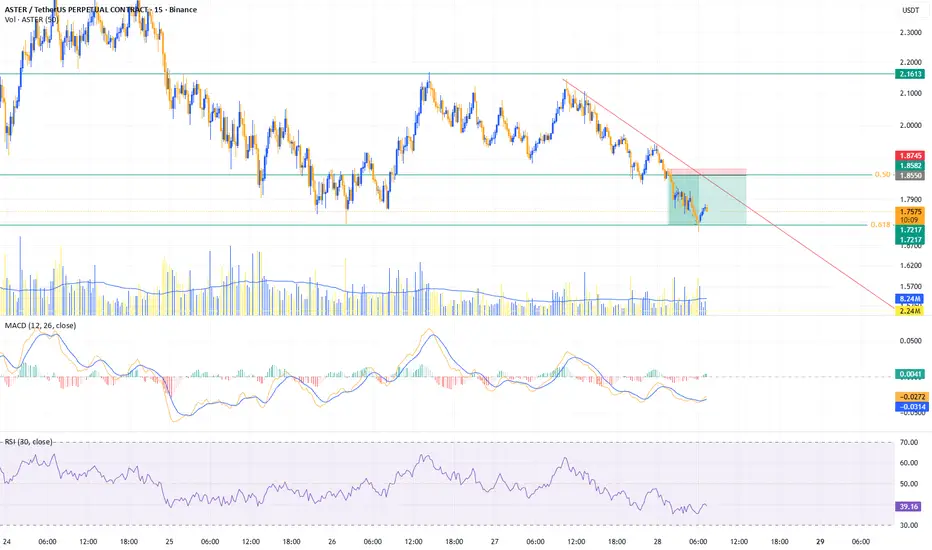
ASTERUSDT Update, IntradayPrevious post:
Aster Bounce at 0.50 Fibb area, if it breakouts, then Intra Long
If doesn't Breakout, i will wait for it to Breakdown the 0.50fibb area to short. targeting the 0.6 Golden Fibb.
Who doesn't love Fibonacci right? :)
Journal Entry #10.1
Price action broke 0.50fibb and smashed 0.618 Fibb $_$
now what's next? a waiting game for me.
I would wait for the market to create a good setup prior positioning.
Its a good sunday.
ASTER Market Update📊 ASTER Market Update
ASTER has formed a bearish Double Top pattern ⚠️ and broke the blue support zone 🔵
What’s next? If price keeps retracing down, we have two green zone levels 🟢 where buyers previously accumulated.
These zones could give potential long entries or spots to accumulate more — but always wait for confirmation before entering ✅
⚡ Trade smart, not blind.

$ASTER short term? Just wanna give a update on aster.
Currently it has a bigger deviation above its main range running into the blue extension giving like a hammer look. I had one great short on aster so im not here to nailing or calling any tops or bottoms to perfection and shorting this can end bad quick. so a tight invalidition would be simply above the blue extension but its super volatile guys. see this just as a simple interpretation!:)
Going above the blue extension most likely will send it way higher again.
the drawing is also just a extreme idea. not looking for this ultra swings anymore

ASTERUSDT — Will Buy Zone Hold or Break?Overview
ASTER price is currently consolidating after a strong rally toward 2.42. On the 2-hour chart, we can clearly see two major highlighted areas: Buy Zone 1 (primary support) and Buy Zone 2 (deeper secondary support).
The structure still maintains a potential bullish continuation, but repeated weakness around support indicates risk of a breakdown if buyers fail to defend the current zone.
---
🔑 Key Levels
Nearest Support (Buy Zone 1): 1.75 – 1.95
Secondary Support (Buy Zone 2): 1.25 – 1.45
Minor Resistance: 2.12
Major Resistance: 2.33 – 2.42 (previous supply zone / local high)
Current Price: 1.91
---
📐 Technical Pattern
1. Bullish Flag / Rectangle
A sideways consolidation after a strong uptrend move, often a continuation pattern. A confirmed breakout to the upside could lead to a retest of 2.42.
2. Multiple Support Tests at Buy Zone 1
Several rejections at 1.8 – 1.9 confirm this zone as a critical short-term demand area. However, the more often a support is tested, the weaker it becomes.
3. Lower Highs Formation
Minor lower highs suggest mild selling pressure. This structure often precedes either a breakout or a breakdown, depending on which side gets taken out.
---
🚀 Bullish Scenario
Confirmation: A 2H close above 2.12 with rising volume.
Targets:
TP1 = 2.12 (breakout retest)
TP2 = 2.33
TP3 = 2.42 (previous high)
Extended Target: If 2.42 breaks, next psychological resistance sits around 2.80 – 3.00.
📌 Bullish entry ideas:
Aggressive: Buy within Buy Zone 1 with stop loss below 1.75.
Conservative: Wait for breakout above 2.12 + confirmed retest.
---
🐻 Bearish Scenario
Confirmation: A 2H close below 1.75 (breakdown from Buy Zone 1).
Targets:
TP1 = 1.50
TP2 = Buy Zone 2 (1.25 – 1.45)
Extended Target: If Buy Zone 2 fails, the structure shifts into a downtrend, potentially moving closer to 1.00.
📌 Bearish entry idea:
Enter short after breakdown (close <1.75), with stop above 1.95 (former support turned resistance).
---
📊 Risk Management
Always set stop losses below support (for longs) or above breakdown (for shorts).
Scale out profits at key resistance levels.
Keep risk per trade ≤2% of total capital.
---
⚠️ Things to Watch
False breakouts: Require volume confirmation.
Correlation with BTC/ETH: Broader market moves can strongly influence ASTER’s direction.
High volatility: Fakeouts may occur before the real move.
---
📌 Conclusion
As long as price holds above Buy Zone 1, the bullish continuation toward 2.12 – 2.42 remains valid.
A breakdown below 1.75 would invalidate the short-term bullish case and open the door toward Buy Zone 2.
Key decision point is very close — watch carefully for breakout or breakdown confirmation.
---
#ASTER #ASTRUSDT #CryptoAnalysis #BuyZone #SwingTrade #PriceAction #SupportResistance #BullishScenario #BearishScenario

ASTER/USDT Perspective Intra DayAster Bounce at 0.50 Fibb area, if it breakouts, then Intra Long
If doesn't Breakout, i will wait for it to Breakdown the 0.50fibb area to short. targeting the 0.6 Golden Fibb.
Who doesn't love Fibonacci right? :)

Aster Bullish Breakout!CZ is serious at This project, as you can see Aster is breaking out the triangle, this is a good opportunity. Manage your risk.
Aster vs Hyperliquid – Value BreakdownWas just taking a closer look at GETTEX:HYPE vs $ASTER. Both projects are moving fast, but the fundamentals tell two very different stories.
Hyperliquid ( GETTEX:HYPE ):
Fully Diluted Valuation (FDV): $46.7B
Annualized Fees: $1.1B
30D Perp Volume: $300B
Volume = ~2% of the entire stablecoin market
Valuation multiple: 42.5x fees
Aster ($ASTER):
Fully Diluted Valuation (FDV): $16.5B
Annualized Fees: $110M
30D Perp Volume: $27.7B
Valuation multiple: 150x fees
Takeaway:
While $ASTER has seen explosive early performance, the fee-to-FDV ratio is stretched. Meanwhile, GETTEX:HYPE is already generating serious fee revenue and market share, making it fundamentally a stronger value proposition even at current levels.

$ASTER - LONG position IN-PLAY, at resistance... BREAKOUT next?Longed $ASTER yesterday at $1.953 and even added to size at $1.99, so now my average long entry price is exactly $1.97.
It did have a nice rally last night which ended in the resistance zone I had on the chart (around mid-$2.10s), so no surprises.
All that matters is that it went on to put in a HIGHER LOW at $1.89 and currently is fighting for a BREAKOUT above the TRIANGLE upper trendline.
If it does break above the triangle and the mentioned resistance zone, the price appreciation towards $2.4 and $2.8 could be very swift.
I moved my STOP LOSS up to $1.88, which is just below the TRIANGLE breakdown point.

ASTER elliot wave 5 on 4H tf this weekend imoTD9 reversal on a shorter elliot wave 3 on 4H. Wave 5 likely to match wave 1. Target $3.20 this weekend. Buy $1.9-$1.95

ASTER Market Update📊 ASTER Market Update
ASTER is testing the red resistance zone 🔴
If it breaks out with confirmation, the first target will be the blue line level 🎯

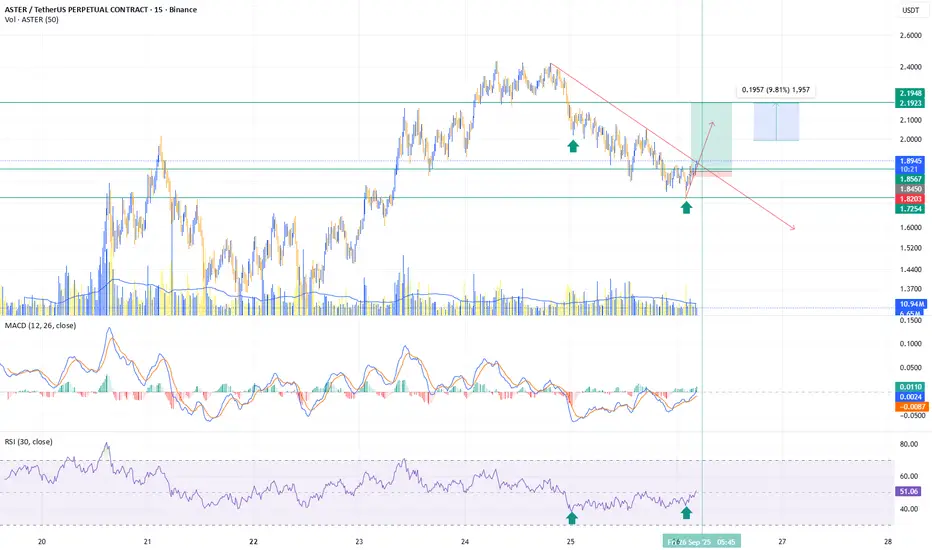
$ASTER: BULLISH market structure FLIP post-breakout. LONG $1.953Ok so I'm officially in the second $ASTER long, this one from $1.953.
Reason for entry: Bullish market structure change after finishing ABC correction and printing a higher high after closing above $1.95.
STOP LOSS: below the recent swing low cause that would invalidate BULLISH market structure. Simple methods work best.
Target is just below the former TRIPLE TOP because that (the ATH levels) turned out to be tough resistance, so taking profits at the FALLING WEDGE'S target ($2.39).
Would love to see volumes stepping in to buy, and I might close manually if I don't like the volume candles, so stay tuned if you are following, but don't follow (officially) I don't need the pressure 👽💙

$ASTER long position above $1.95 HOURLY close$ASTER LONG above $1.95 hourly candle close
higher low then higher high, rsi bullish shift, breakout from wedge, volumes, RSI BULL divergence
Stop loss $1.758
👽💙
ASTER/USDT bounced from golden 0.618 areaBO has bounced in golden 682 area, and will try to do a Breakout from a trendline resistance per this chart. can it? drop your insights
$ASTER 2nd move back up: LONG Same as the move before, trading the retracement.
Sentiment is still overall positive but price is moving off the majors ofc.
With a local bottom on BTC think the rally back up we can pull off $2.50 through the weekend.

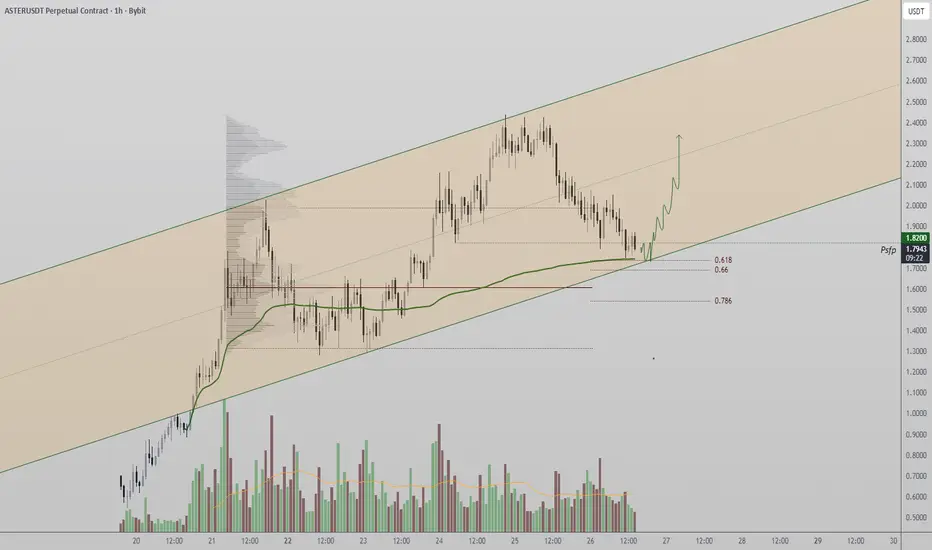
Aster Forms Higher Low at Channel Support, Targets 53% RallyAster (ASTR/USDT) has been consolidating within a well-defined channel structure, and the latest price action indicates the formation of a higher low. This development, occurring in alignment with Fibonacci and VWAP confluence, is technically significant. The setup reinforces the prevailing bullish bias, suggesting that Aster may soon attempt a breakout toward higher-timeframe resistance.
Key Technical Points
- Higher Low Structure: Price is forming a bullish higher low within the channel.
- Confluence Zone: Support aligns with both the 0.618 Fibonacci retracement and VWAP.
- Upside Objective: A move toward the channel high represents over 53% potential upside.
Aster’s recent pullback tested channel support to the dollar, an area that coincides with the 0.618 retracement level. This precise reaction underscores the market’s respect for technical levels and suggests that buyers are defending the bullish structure. Each test of support has seen notable buying interest, reinforcing the idea of accumulation at these levels.
The creation of a higher low is a hallmark of bullish continuation, especially when accompanied by structural confluence. The projected path is a rally toward the channel’s high-timeframe resistance, where supply previously capped upward momentum. If Aster can sustain its position within this channel, the probability of continuation toward the upside remains strong.
Volume has shown signs of stabilizing on pullbacks, a positive indication for buyers. Sustained inflows of demand would further validate the bullish case, as historically, low-volume retracements followed by high-volume breakouts have marked continuation phases in Aster’s price action.
What to Expect in the Coming Price Action
If Aster confirms the higher low at channel support, the next move could be a 53% rally toward channel resistance. This level will act as the primary upside target in the near term. Losing channel support, however, would invalidate the bullish structure and shift focus back to lower liquidity zones. For now, technicals remain firmly supportive of a bullish continuation.