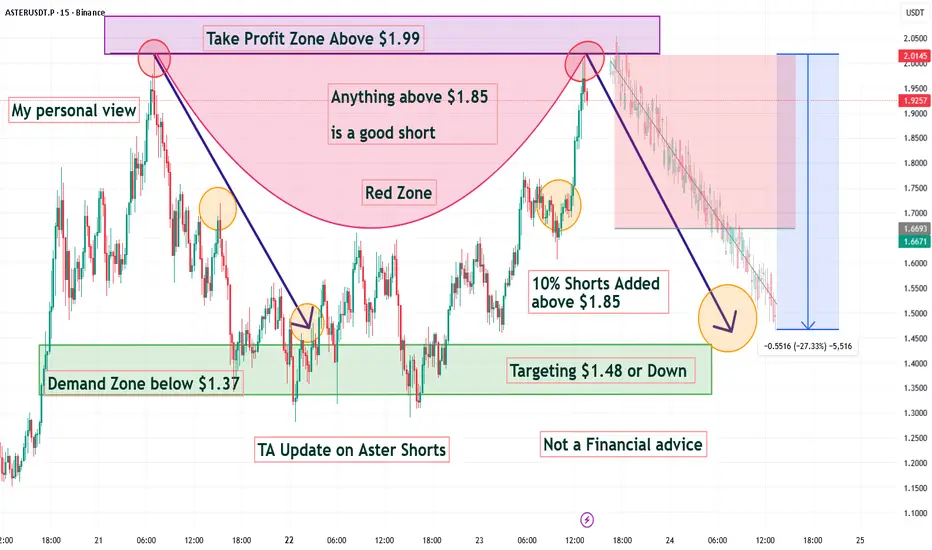
TA Update on ASTER Shorts Anything above $1.85 is a good shorTA Update on Aster Shorts
Anything above $1.85
is a good short
10% Shorts added above $1.85
Take Profit zone above $1.99
Demand Zone below $1.37
Targeting $1.48 or Down
Not a Financial advice
ASTERUSDT trade ideas
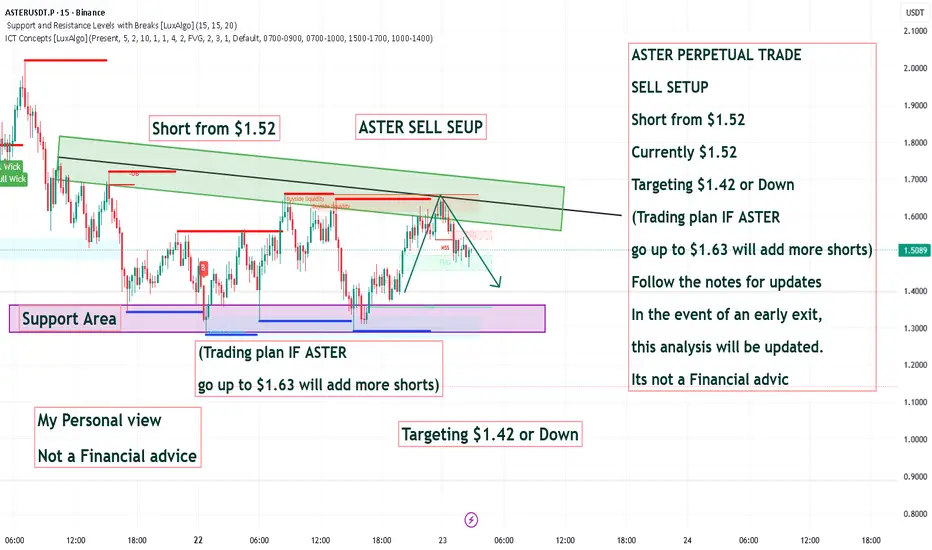
ASTER PERPETUAL TRADE SELL SETUP Short from $1.52ASTER PERPETUAL TRADE
SELL SETUP
Short from $1.52
Currently $1.52
Targeting $1.42 or Down
(Trading plan IF ASTER
go up to $1.63 will add more shorts)
Follow the notes for updates
In the event of an early exit,
this analysis will be updated.
Its not a Financial advic
$ASTER: bearish HEAD & SHOULDERS pattern after a TRIPLE TOP$ASTER late night UPDATE cause things could happen overnight.
Clearly a bearish HEAD & SHOULDERS chart patter with that nasty TRIPLE TOP. Looks like a castle to me. Not a good castle, it's an enemy one.
Breakdown level: $1.77, targetting $1.16.
Not good at all. I expected more momentum, but that died off, the RSI in a downtrend without divergences.
And all the fat LIQUIDITY clusters are overhead, too.
Support at $1.65, and the orange zone on the HOURLY chart.
Could we get a shocking correction to the technical targets just above $1? That would be a gift, actually, but let's wait and see. I put some super stink limit orders at $1.34 and $1.18.
They probably won't get triggered, but it costs nothing, and I could get lucky with catching a wick down, it happens, actually. You do you, things are looking rough for the time being💙👽

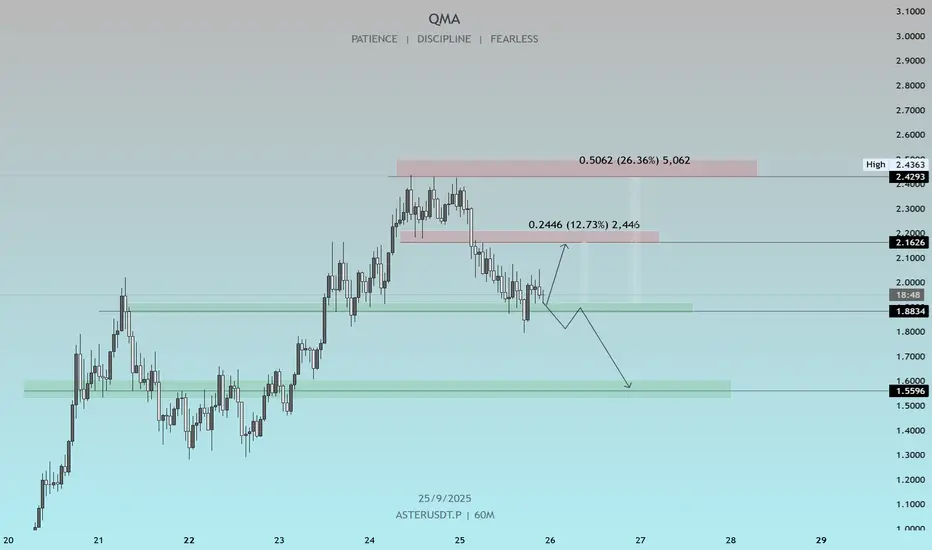
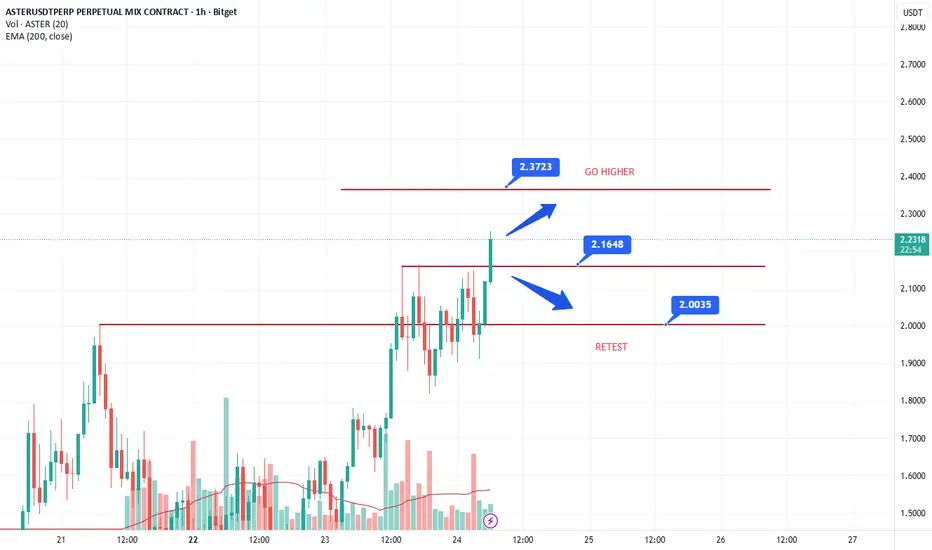
ASTERUSDT: Liquidity Grab & Key LevelsIt looks like $ASTER has made a clear move to grab liquidity below the recent swing low and is now showing signs of reversal. This is a critical juncture.
The Bullish Scenario:
For the move higher to materialize, we must hold the ≈1.90 range on the 1-hour timeframe. This area (highlighted in the chart) is acting as critical support following the liquidity sweep.
Target 1 : If ≈1.90 holds, we look for a push up to the first resistance zone at ≈2.16 (which represents a 12.73% move from current levels).
Target 2 : A break and hold above the first target opens the door for a continuation to the upper resistance/supply zone around ≈2.45 (which is near the swing high and a ≈26.36% move).
The Bearish Scenario:
If we lose and close below the ≈1.90 support range on the 1H, it would invalidate the immediate bullish reversal structure. In this case, we would expect a continuation of the downtrend to test the major structural support zone around ≈1.55.
Trade with discipline and patience. Always manage your risk.
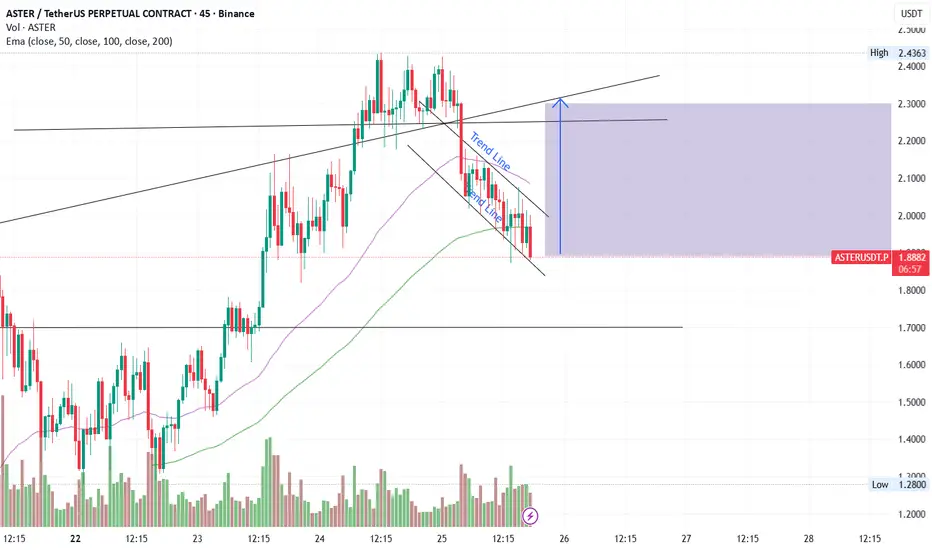
ASTER/USDT – Falling Wedge Setup with Bounce PotentialPrice has been consolidating inside a falling wedge pattern after the recent rejection near 2.40. Currently, it is sitting close to the 200 EMA support around the 1.89–1.90 zone.
A breakout above the wedge trendline could trigger a move back towards the 2.30–2.31 resistance area, which also aligns with the upper channel trendline.
Support: 1.89 / 1.87 (200 EMA + wedge bottom)
Resistance: 2.10 / 2.31 (wedge breakout + upper channel)
Bias: Bullish if wedge breakout confirms with volume
If the price fails to hold the 200 EMA, we may see further downside, but for now, the setup favors a potential trend continuation to the upside.
$ASTR in a DOWNTREND on 1-HOURLast night I was hunting for a second LONG on $ASTER after a great printer on the first one, was looking to enter on a BULLISH FLAG breakout at $2.46 but instead, the price reached $2.42, formed a TRIPLE TOP and corrected hard.
Then the triple top broke down below and reached the target at $1.93. Beautiful how these chart patterns hit one after another💙.
So right now the HOURLY has been in a DOWNTREND, so there are two options:
a) Try and buy/long in the flash crash zone (yellow box annotated on the chart) between $1.66 and $1.83.
The main chart support is down there at $1.65. Buyers should step in. 👽
b) Wait for a bullish market structure change and either catch another WAVE 3 or WAVE 5 impulses upwards.
That's the correct technical approach, when buying now is basically longing a DOWNTREND.
RSI also in a Downtrend after BEAR divergences, so we will need to see this change too.
Patience.

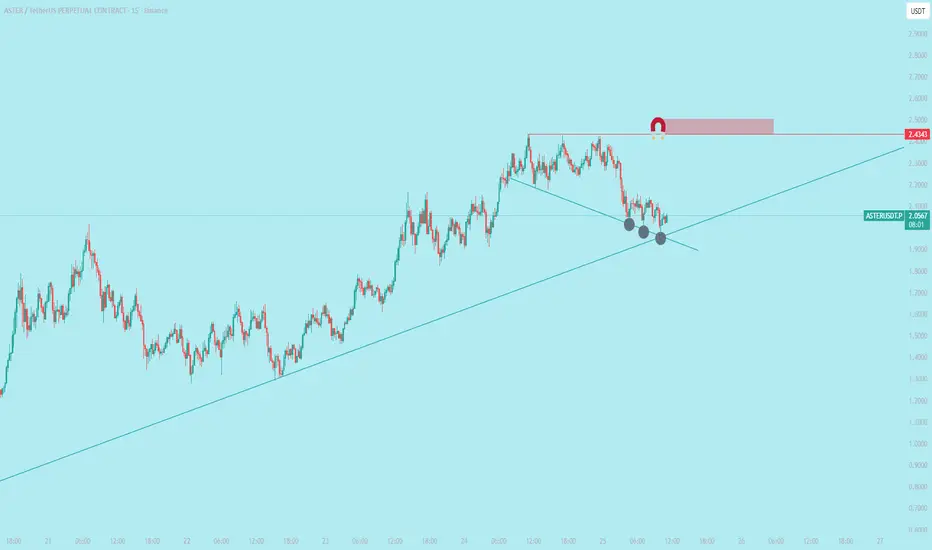
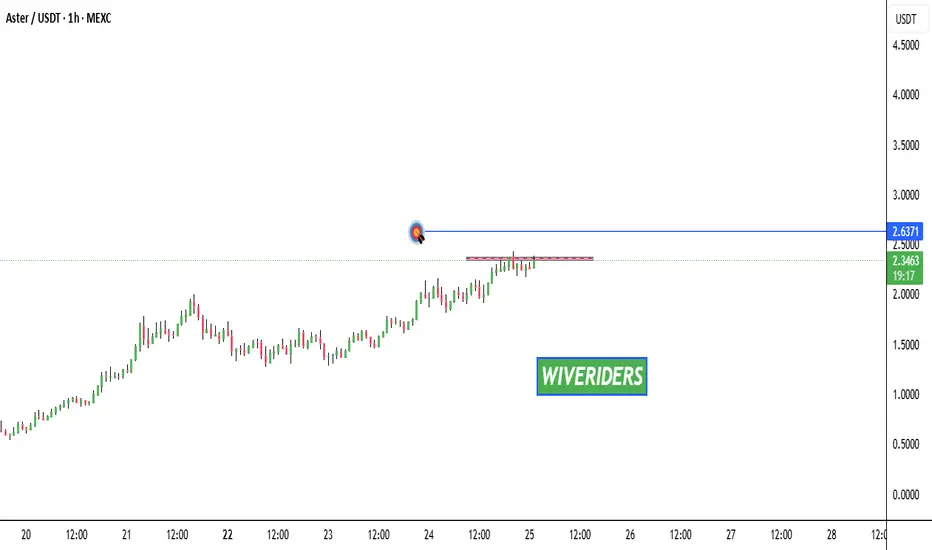
$ASTER is ready for ATH vibes again$ASTER is ready for ATH vibes again
Price Movement: The chart shows a significant uptrend from around $1,000 to a peak near $2,443, followed by a pullback to the current price of $2,049 (as of 10:44 UTC on September 25, 2025). This indicates a recent correction after hitting resistance.
Resistance Level: The horizontal red line at $2,443 acts as a key resistance level where the price struggled to break through, suggesting strong selling pressure at this point.
Support Zone: The intersection of the two trend lines (light blue upward trend and darker blue downward trend) around $2,000-$2,100 marks a potential support zone. The gray circles highlight this area where the price might find buying interest.
Trend Lines: The upward-sloping light blue line reflects the overall uptrend, while the downward-sloping darker blue line indicates a short-term correction or consolidation phase.
Volume and Momentum: While volume data isn't fully visible, the price action suggests momentum has slowed after the resistance test, with a 0.27% change indicating stability at the current level.
Outlook: The price is currently testing the support zone. A bounce from here could signal a retest of $2,443, while a break below $2,000 might lead to further downside toward $1,800-$1,900.
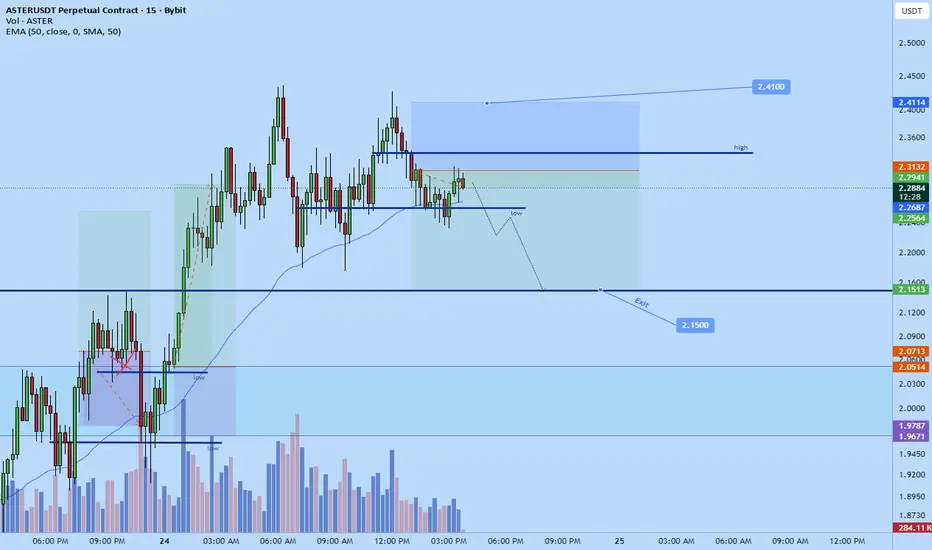
Aster scalp short back to $2.15Just now opened a scalp short position on aster.
Sl: 2.41
tp: 2.15
Time sensitive
High probability
1.65RR conservative as main trend is up
Aster/USDT Shorting idea.BINANCE:ASTERUSDT.P has been pumping lately, and now its slowing down plus showing Bearish Divergence.
Waiting for confirmation to short and earn a bit.
ASTER is testing the red resistance zone📊 $ASTER Market Update
$ASTER is testing the red resistance zone 🔴
If it breaks out with confirmation, the first target will be the green line level 🎯
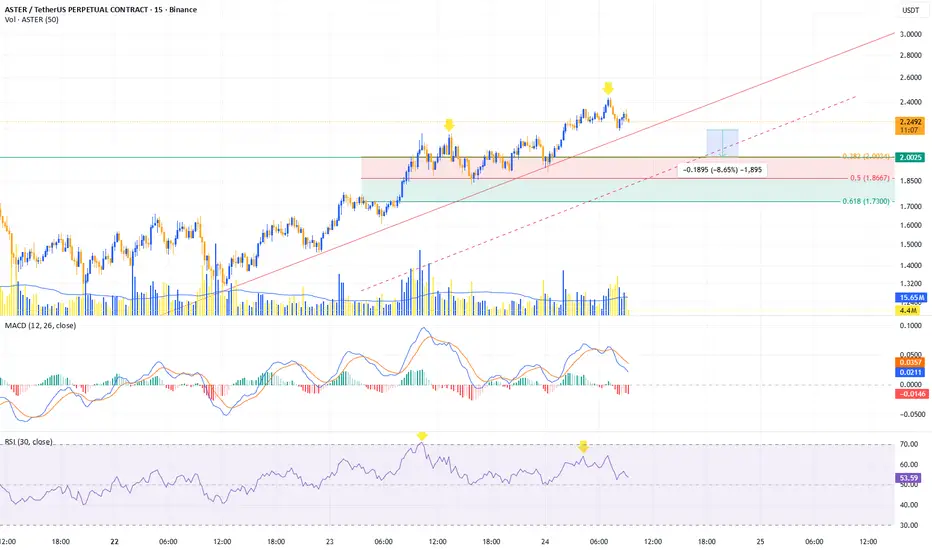
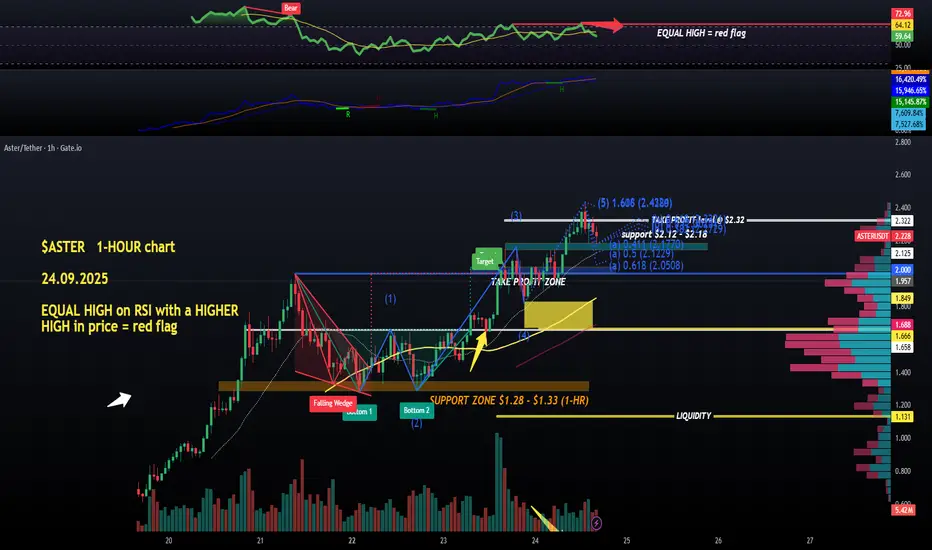
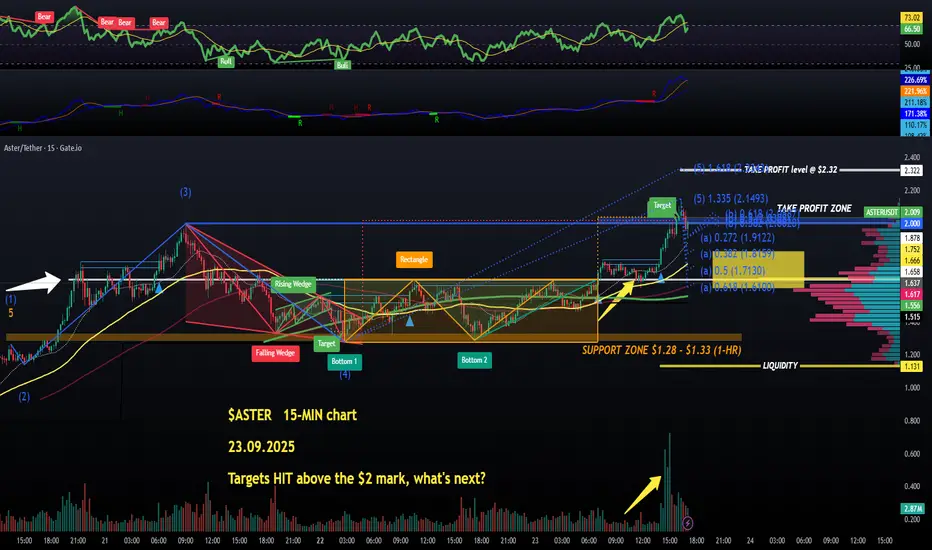
$ASTER with a red flag after an EQUAL RSI high while price ATH$ASTER did hit my full take profit level ($2.32) on the long opened at $1.71, it even extended to its #ATH at $2.43, so the leverage is gone and that was a perfect BREAKOUT trade.
What next, apart from a strong #HODL on my spot position ($1.4 average entry, not great, not bad)?
On the HOURLY chart it looks like that was WAVE 5 (the last impulsive wave up in Elliot's Wave Theory) reaching ATH but we got some form of a BEAR RSI divergence due to only an equal high while the price action clearly made a solid leg up.
So, i will be looking to catch some long entries on a correction, obviously, my first level to watch would be the support zone betwen $2 and $2.06.
Will need to see better volumes today and a better looking RSI profile first. OBV hidden bullish divergence recently.
So, waiting on a correction, basically and monitoring the 15-MIN chart (next post) 💙👽
ASTER ~ 1D
Exchange : Binance
SETUP
ENTRY : 1.9005
TRIMMING : 2.7292, 3.5879
INVALIDATION : 1.5826
BIAS :
- Fomo longs siting at the top making it a leverage derisk off for early bids after funding resets,
- Did be keeping eyes on 1.9005ish fills for limit orders leading into type 2 Expansion backed by cash inflow.

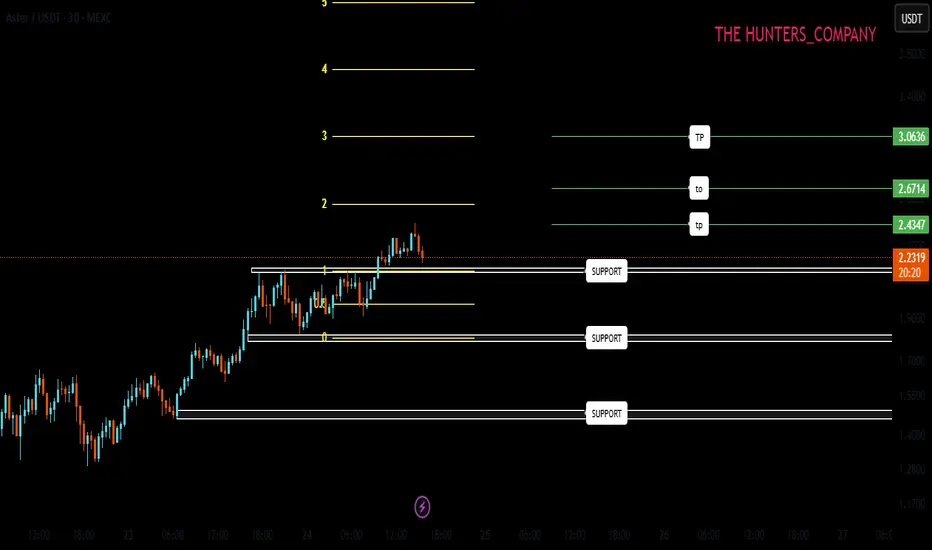
ASTER analysisHello friends
Given the upward trend of the market, we can expect a resurgence in the price during pullbacks.
Now we have identified 3 support areas that can support the price and if the price is supported, it can move to the specified targets.
*Trade safely with us*
ASTER Momentum Could Push Toward $6
Aster (ASTER) has been one of the strongest performers in the market this week, rallying over 2,000% according to multiple sources. The project positions itself as a decentralized perp DEX with features like hidden orders, multi-chain support, and even on-chain stocks trading up to 100x leverage. Backing from YZi Labs, a firm associated with Binance’s founder CZ, has further fueled speculation and attracted whales.
Why I see $6 as a realistic short-term target:
Strong Momentum — Price action shows parabolic growth with high-volume confirmation. Momentum plays like this often overshoot before retracing.
Low Float & Supply Pressure — With a limited circulating supply, ASTER reacts quickly to buying pressure.
Speculative Catalysts — CEX listings (Bitunix already listed ASTER/USDT and perps) show growing traction, and traders are betting on a potential larger exchange listing.
Market Psychology — After such rapid gains, round numbers like $5 and $6 act as magnet levels, especially when retail FOMO is high.
My Trading Plan:
Entry: Pullbacks around $2.5–$3 zones (support from recent consolidation).
Target: $6 (psychological and Fibonacci extension level).
Stop-Loss: Below $2.0 (invalidate momentum structure).
Risk Factors:
Token unlocks could flood supply.
Extremely high volatility with potential 40–60% intraday swings.
Regulatory and adoption risks for perp DEXs.
Drawing ASTERNice breakout on ASTER, but I’m not sure if it will retest support or push higher, since there’s a bullish engulfing candle.
Aster: Hidden Orders, Big Players & Q4 PotentialThe #Aster vs #HYPE confrontation could be one of the key narratives of Q4.
Main driver: hidden limit orders — a feature loved by whales for reducing exposure to monitoring groups.
Key points:
Bitfinex introduced this feature back in 2017 with higher fees compared to standard orders.
Current market conditions (advanced screeners, bots, higher liquidity, and demand for anonymity) make such functionality far more relevant.
CZ’s potential comeback adds additional weight to Aster’s expansion strategy.
Analysts estimate that for Aster to match Hype’s scale, the token would need to trade at $7.83.
Our accumulation zones (if correction occurs):
$1.70 — reasonable entry
$1.40 — ideal target
$0.90 — extended wish
Question remains: will Aster evolve into a Q4 market leader, or is it simply another hype cycle?
______________
◆ Follow us ❤️ for daily crypto insights & updates!
🚀 Don’t miss out on important market moves
🧠 DYOR | This is not financial advice, just thinking out loud.

$ASTER long PRINTING, initial TARGETS just above $2 HITWhat a great rally for $ASTER to break above the $2 mark. Partially profit-taken here, let's zoom in on the 15-MIN chart again to find the next target, both for profit taking and for re-entries.
Ok so this ongoing run is basically the last wave, it could be ending now or extending to $2.32 and above. So I will take some profits there and let the rest of the long run with a STOP LOSS at $2.63 like I previously said.
If we are going to see a minor correction, it will likely fall to $1.61 - $1.82 zone. This is where you could add/re-enter.
Support is at $1.65 so we don't wanna see MORE THAN ONE candle close below this level, or it will likely become a bigger correction.
Another big support zone is $1.28 - $1.33 (highlighted as an ORANGE BOX).
I don't think we will see the priceaction below it very soon, so I also put up some limit ORDERS in that zone.
Any of you guys started using ASTER dex yet? #Airdrop will be absolutely spectacular from this. I can make a #Tutorial if any people are interesed in free money, let me know in comments 👽💙
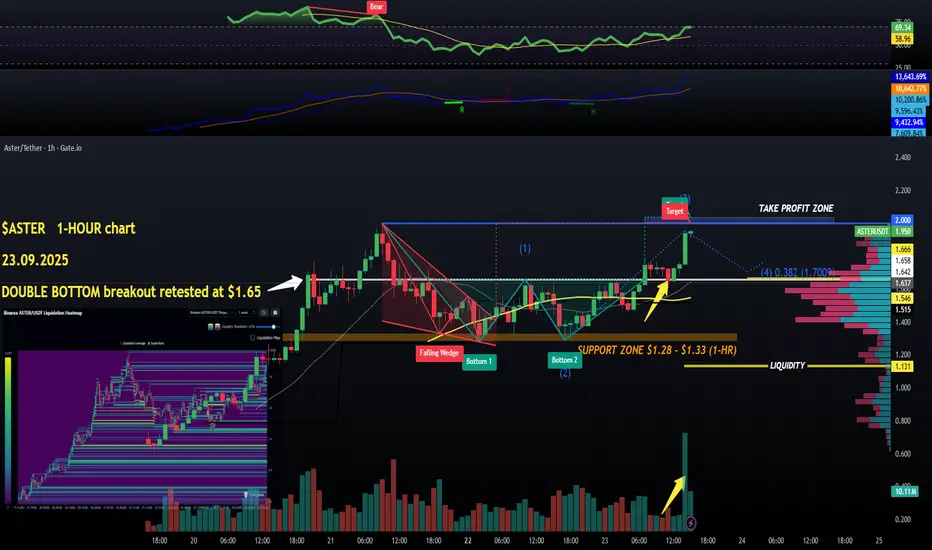
$ASTER about to reach BREAKOUT targets between $1 and $1.04$ASTER is starting to develop some solid levels to watch on the HOURLY chart, finally. So let's get into it, as my long position that I posted last night has NOW been triggered at $1.71.
So, a nice retest of the DOUBLE BOTTOM after breaking out above the resistance located at $1.65.
And a famtastic high volume candle to confirm the breakout.
After the breakout it's been going up very quickly and I expect some resistance at precisely the $2 - $2.04 zone (falling wedge/double bottom targets).
If we do get a hard rejection now at $2, I will move my STOP LOSS just below the breakout level which triggered my LONG = $1.63. The risk factor is very tiny, that's how i like it.
So initial take profit area just above $2, and if we do continue higher, refer to my previous posts for the targets higher.
This is also WAVE 3, the most explosive in Elliot's Wave theory, and once it's finished, we can buy again/more for the WAVE 5 rally ($1.70 projected for the WAVE 4 bottom, this could change depending on how high the WAVE 4 reaches).
Staying tuned into #ASTER is a good idea, the volumes have been incredible, higher than CRYPTOCAP:ETH or CRYPTOCAP:SOL 💙👽
Aster Price Up 16% in 24 Hours as Buyers Return StrongAt the time of writing, Aster is priced at $1.67, holding firm above its $1.58 support. For now, the altcoin is likely to remain rangebound between $1.58 and $1.71 as it consolidates recent gains.
If the broader market turns favorable, Aster could breach $1.71 and move toward $1.87. Such momentum would bring the token closer to retesting its all-time high of $1.99, a milestone last seen during peak bullish phases.
However, downside risks remain. A break below $1.58 would signal weakening demand, potentially driving Aster down to $1.48. This scenario would invalidate the current bullish outlook, highlighting the importance of strong market support.
Aster Price Action Rebounds Toward Point of Control Aster has rebounded from a 0.618 Fibonacci retracement in confluence with VWAP support. Price is now targeting the point of control, which could unlock momentum toward the $2 high-time-frame resistance.
Aster's recent price action has provided a textbook example of Fibonacci and VWAP confluence acting as a springboard for recovery. After retesting this major support, the market is now bouncing, with focus shifting toward the point of control (POC). A reclaim of this critical level could serve as the catalyst for a bullish continuation, potentially driving Astor toward its next structural high at $2.
Key Technical Points:
- Support: 0.618 Fibonacci retracement aligned with VWAP SR.
- Target: Point of control reclaim to open path toward $2.
- Market Structure: Consecutive higher highs and higher lows remain intact.
The rebound from the 0.618 Fibonacci and VWAP support underscores the strength of demand at lower levels. Technical traders often view such confluence zones as high-probability areas for trend continuation, and Aster's reaction here validates that perspective.
The next challenge lies at the POC, which has been acting as a magnet for price action. A successful reclaim of this level would restore confidence in the bullish trajectory, setting the stage for a rotation to $2. Importantly, Aster's broader market structure remains bullish, with consecutive higher highs and higher lows dominating the chart. This suggests that the recent retracement is corrective rather than trend-ending.
Should price fail to reclaim the POC, Aster may continue consolidating within the mid-range, delaying its advance. However, so long as the 0.618 Fibonacci support holds, the bullish bias remains valid.
What to Expect in the Coming Price Action:
If Aster reclaims the point of control, the next likely move is a rally toward $2 resistance. Until then, the structure remains constructive as long as Fibonacci and VWAP supports are defended.

Long Aster again lost my first trade today due to the fact that i didnt read the chart right, my analysis was wrong in that one. But here is the second setup that should work out.
Again iam aggressive tader, so i can see this bullflag is being made, so maybe as aggressive as it gets i identified the entry and i would be loose on tp.
If you are more cautious, then wait for the breakout and take a long position. Might work out, but also be aware that this is very risky asset with little to no liquidity

longing Astergiven the Risk to Reward, it seems like a good opp.
Wait until RSI gets oversold, then enter.

$ASTER to $4 - CZ would like thisMost of you have forgotten what happened with CAKE (biggest DEX on BSC) last cycle.
CAKE has gone from $3 million mcap to $6.6 billion mcap for 5/6 months. At that point of time biggest DEX and competitor to Pancakeswap was Uniswap which grew in the same time from $500 million mcap to $21.5 billion mcap (ATH)
Now we can see similar pattern. Just that Hyperliquid has been live already for a whole year.
-> This means BCS competitor doesn't have the same time to boost their token and will do it much faster.
Hype is trading around $17 and $20 billion mcap and there is still some time to break it's ATH mcap.
Very similar mcap as Uniswap at it's ATH moment.
Now with CZ backing personally ASTER and taking the $1000 per BNB moment, I see huge potential in the token price and both the fundamentals behind - ASTER exchange performance.
Minimum mcap of ASTER which I am looking to sell is same as in past cycle CAKE ATH mcap - $6.6 billion, which means at 1.65 billion tokens in circulation exactly $4 price per ASTER.
CZ's favourite number :)
1.65 billion tokens in circulation but if you take in consideration that 94% of total tokens are in founders hands, only 480 million tokens stay in real circulation. This means that pumping the token is much easier and needs less buy volume.
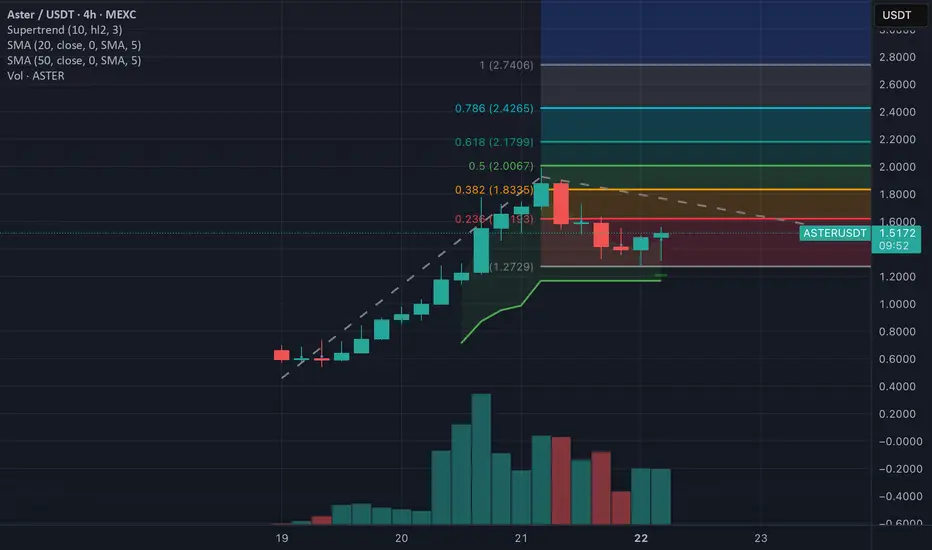
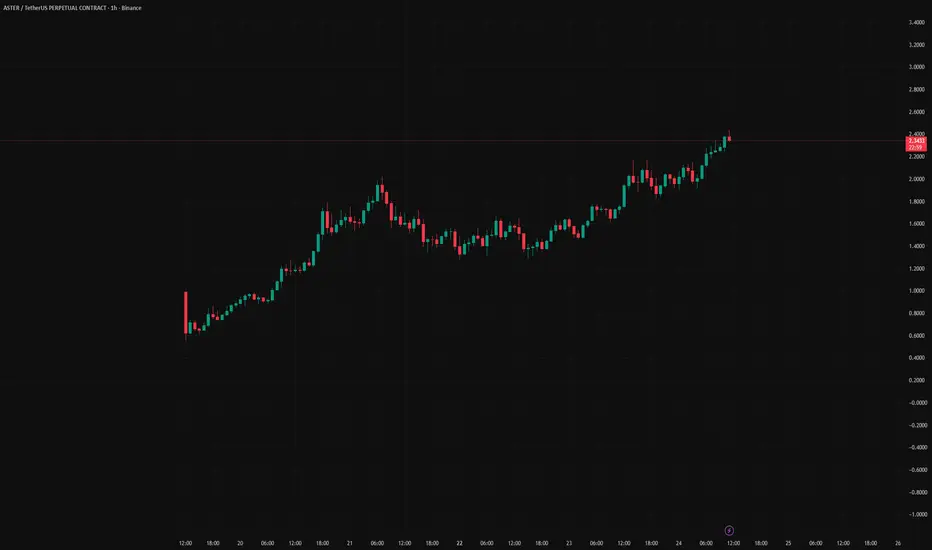
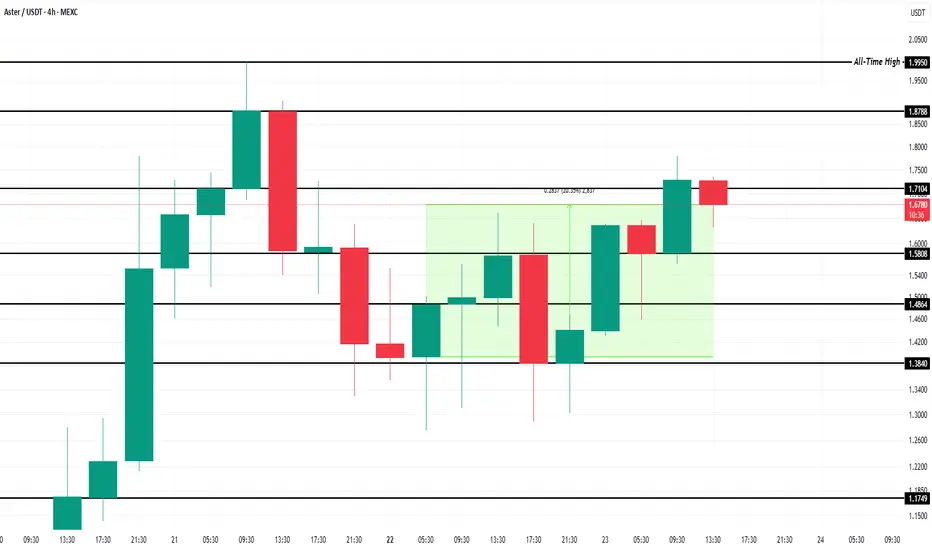
From the low info the graph gives us, we can predict the Fib levels.