HSN Shakeout Play: Smart Money Reloading for ATH Breakout?Hansen Technologies (HSN) — Strategic Long Setup
Hansen Technologies is shaping up as a compelling long-term play. On 20/08/25, a slight earnings miss (−0.07%) triggered a sharp intraday sell-off, with price spiking down to $5.00 before closing at $5.60, forming a bullish hammer. This candle reflects late retail capitulation into aggressive smart money absorption—a classic shakeout signature.
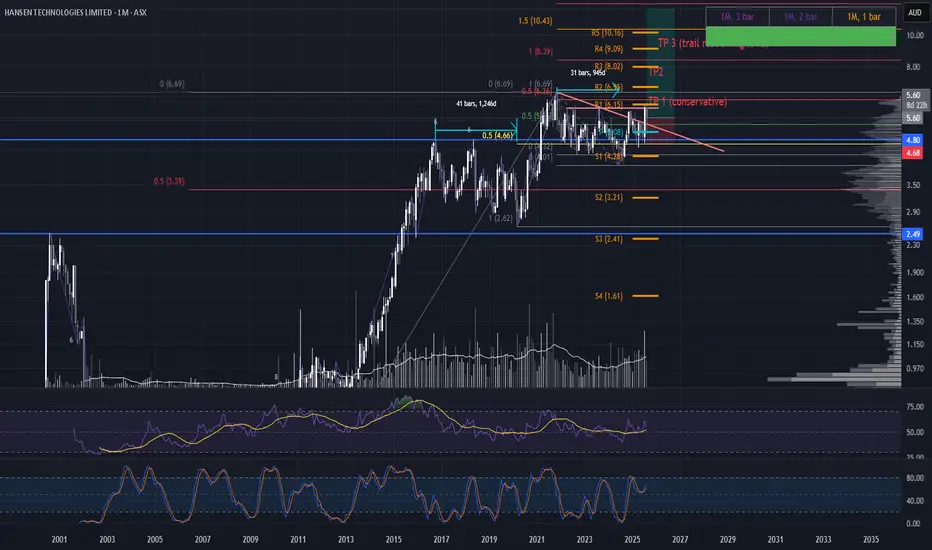
Confirmation Trigger To validate this as a true shakeout, price must close above the 20/08/25 high of $5.87. A reclaim of this level would likely ignite a strong rally toward all-time highs, as trapped shorts and sidelined longs scramble to reposition.
Monthly Structure — Bullish Reaccumulation
Price has been reaccumulating for ~4 years above the 2016 ATH, building a solid structural base.
The descending trend line has been broken and potentially successfully retested via the 20/08/25 spike low.
Price has also tested the yearly pivot and the 50% Fib level projected from the COVID low to ATH.
This multi-timeframe alignment suggests institutional accumulation and long-term bullish intent.
Trade Scenarios
Aggressive Long Entry: Enter now while price is still consolidating near the spike low. This approach anticipates a breakout and positions early. The stop loss would be placed just below the monthly 2-bar swing low to protect against deeper downside.
Confirmation Long Entry: Wait for price to reclaim and close above $5.87, the high of the 20/08/25 candle. This adds confluence and confirms the shakeout thesis. The stop loss for this setup would sit just below the spike low at approximately $5.00, giving room for volatility while protecting capital.
HSN trade ideas
Descending upswing patternWhile in the longer term HSN is trending downwards, this trend is happening within a range of roughly 50%. Swings within this range follow a pattern -
1. the price will shoot up to meet the upper trend line
2. falls downwards to meet the lower trend line
3. bounces back to the upper bounds of the light blue zone
4. retreats gradually into the yellow zone
Given the longer term downward trend, I predict this pattern will repeat once more, then the upper trend line will be in the light blue zone and the pattern will become -
1. price shoots up to meet upper trend line
2. trends downwards to meet lower trend line
3. bounce back to upper green zone
4. fall gradually into red zone
Let's see if I'm right...

Double top complete - Trend Reversal TBCHi All,
A double top pattern has complete and down trend seems to be reversing albeit not reaching its assumed target of peak to support distance. This might suggest a possibility for additional bearish movement however other indicators would suggest otherwise.
Short term trend reversal seems to have occurred, however an additional days confirmation above 3.09 would be recommended prior to entering long trade.
RSI seems to have begun bullish momentum.
MACD too seems to be turning bullish.
Based on the movement back in June we can assume retracement to previous support line at 3.27 pending trend reversal confirmation. Exit of trade would be recommended prior to seeking additional upside due to long term down trend. Confirmed clearance of this trend line at above 3.35 would suffice for an additional long trade with exit to next resistance at 3.66 OR confirmation of trend reversal as EXIT.
TRADE OPTIONS;
Possible long option; Enter at confirmed break of 3.09. EXIT first resistance @ 3.27 for 5.8% Gain.
Possible long option. Enter at confirmed break of 3.35. EXIT second resistance @ 3.66 for 9.2% Gain.
Possible short option; None, TA not providing enough support.
Let me know your thoughts,
Thanks all,
Trading Corner
**This is not financial advice, please act with due diligence when trading any market**

$HSN high volume breakout on Positive Earnings Result. Earnings read well in my opinion, a move through $4 would bode well for this stock.
