SPY Bounce or Bull Trap? Monday’s Trendline Decides Oct. 13SPY Oversold Bounce or Just Another Trap? Watch This Trendline Monday
Friday’s session was brutal — SPY sank nearly 3%, printing a full-day liquidation move after the volatility spike tied to the tariff shock. But after hours, something interesting happened: buyers finally showed up around the $650 zone, a level that matches both key technical and gamma support.
Heading into Monday, the market sits at an inflection point. Let’s look at the 15-minute structure for intraday momentum and the 1-hour GEX map for broader positioning clues.
15-Minute Intraday Technical View
SPY has been stuck in a clean descending channel, printing lower highs and lower lows for three straight sessions. But the 15-minute chart shows early signs that the selling pressure is slowing down.
The MACD histogram flipped from red to light blue, hinting at a loss of bearish momentum. Meanwhile, Stoch RSI has curled back up sharply from the oversold zone near 20, pushing toward 80 — a signal of short-term strength returning.
Right now, the key battle zone is the 655–657 trendline area. If SPY breaks and closes above it, that would confirm a mini intraday reversal setup. Above that, potential targets are 661, 666, and 673, where the upper trendline and prior liquidity pockets sit.
But if SPY fails at the trendline and rejects under 652, the next leg down could test 646–642, which is the deeper gamma and liquidity floor from Friday’s crash.
Scalp bias:
* Long above 657 → target 666–670 (gap-fill zone).
* Short below 652 → target 646–642 (continuation leg).
The structure suggests that Monday’s open will likely start with a volatility-driven reaction — expect either a strong bounce into resistance or a failed retest that sets up a fresh low.
1-Hour GEX Analysis — Options Sentiment
This is where things get tactical.
Friday’s selloff drove SPY into deep negative gamma, which forces market makers to sell into weakness. The HVL (Highest Volatility Line) sits around 660, making it the key pivot where volatility could begin to unwind if reclaimed.
Below that, there’s a cluster of Put Walls between 651 and 646, marking heavy hedging zones — this aligns perfectly with Friday’s low and the current support region. That area is the line in the sand for bulls.
Above, Call Walls start showing up around 674–680, which represent dealer resistance and likely gamma caps if the market tries to squeeze higher.
IVR sits at 28.7, and IVX is around 21.2, meaning volatility remains elevated but could compress quickly on a bounce. Put positioning (115.5%) is still extreme, suggesting sentiment is deeply bearish — and when positioning gets this lopsided, snapback rallies often follow.
If SPY closes above 660, dealers begin to unwind shorts, potentially fueling a relief rally toward 670+. But a failure to hold above 652 keeps the gamma pressure active, and new lows could form near 642.
My Thoughts and Trade Ideas
The market looks oversold, but not yet safe. SPY is trapped between heavy Put hedging below and resistance gamma above. The risk/reward favors a tactical bounce as long as 652 holds — but traders should treat it as a scalp, not a swing, until volatility confirms a reversal.
For intraday scalpers:
* Long bias: watch for reclaim above 657 with volume — aim for 666–670.
* Bearish continuation: rejection at trendline + VIX > 22 = retest of 646.
For option traders:
* Short-term recovery setup: 660C or 670C, tight expiration (if SPY stabilizes above 657).
* Hedge setup: 650P or 645P, if the market shows risk-off continuation.
This is a “reaction” day, not prediction day — momentum will decide direction early in the session.
Final Take
SPY is sitting right on top of a major volatility floor, where both technicals and options data align. The downside looks stretched, but a weak open could still shake out more stops before any recovery.
Above 657 = relief rally potential.
Below 652 = another leg of pain.
Watch volatility — it’ll tell you which side wins.
Disclaimer: This analysis is for educational purposes only and not financial advice. Always trade your plan and manage your risk carefully.
SPY trade ideas

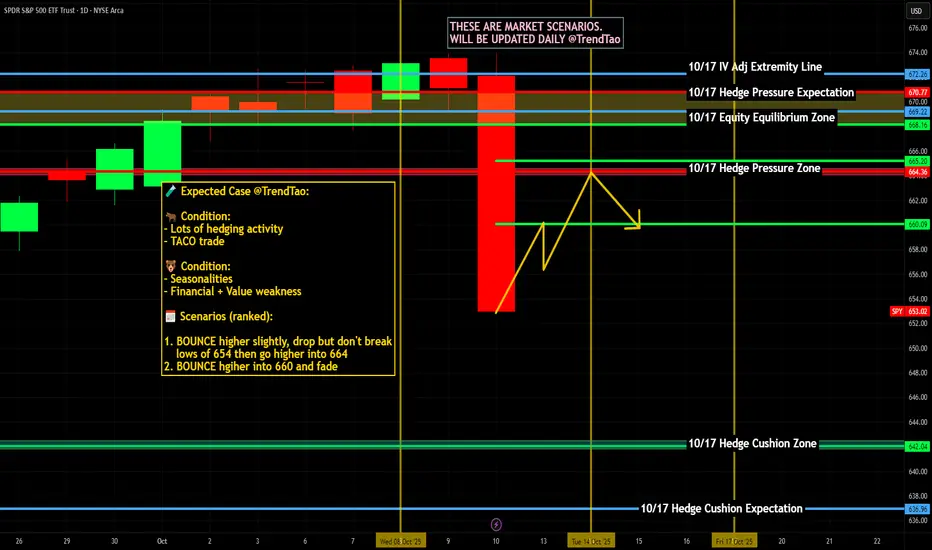
$SPY / $SPX Scenarios — Week of Oct 13–17, 2025🔮 AMEX:SPY / SP:SPX Scenarios — Week of Oct 13–17, 2025 🔮
🌍 Market-Moving Headlines
🚩 Inflation-heavy week: PPI, Retail Sales, and Industrial Production headline the macro slate — but several may be ⚠️subject to delay due to the shutdown.
💬 Fed circuit overload: 10+ Fed speakers including Bowman, Waller, Bostic, Barkin, and Miran — tone-watching replaces missing data.
📉 Consumer & housing pulse: Retail Sales, Homebuilder Confidence, and Housing Starts offer critical insight into demand — if they post on time.
💻 Earnings meets macro: Early Q3 results from banks + big tech guide sentiment alongside muted macro signals.
📊 Key Data & Events (ET)
📅 Mon, Oct 13 — Columbus Day 🇺🇸 (Bond Market Closed)
⏰ 12:55 PM — Anna Paulson (Philadelphia Fed) speaks
📅 Tue, Oct 14
⏰ 6:00 AM — NFIB Small Business Optimism (Sept)
⏰ 8:45 AM — Michelle Bowman (Fed Gov) speech
⏰ 3:25 PM — Christopher Waller (Fed Gov) speech
⏰ 3:30 PM — Susan Collins (Boston Fed) speech
📅 Wed, Oct 15
⏰ 🚩 8:30 AM — Empire State Manufacturing Survey (Oct)
⏰ 12:10 PM — Raphael Bostic (Atlanta Fed) speech
⏰ 12:30 PM — Stephen Miran (Fed Gov) speech
⏰ 1:00 PM — Christopher Waller (Fed Gov) speech
⏰ 🚩 2:00 PM — Fed Beige Book
📅 Thu, Oct 16
⏰ 🚩 8:30 AM — Retail Sales (Sept) — ⚠️ May be delayed due to shutdown
⏰ 🚩 8:30 AM — Producer Price Index (PPI, Sept) — ⚠️ May be delayed
⏰ 🚩 8:30 AM — Initial Jobless Claims (Oct 11) — ⚠️ At risk of delay
⏰ 9:00 AM — Waller & Miran (Fed Govs) speeches
⏰ 10:00 AM — Homebuilder Confidence (Oct)
⏰ 10:00 AM — Michelle Bowman (Fed Gov) remarks
⏰ 12:45 PM / 4:30 PM — Tom Barkin (Richmond Fed) speeches
📅 Fri, Oct 17
⏰ 🚩 8:30 AM — Housing Starts / Building Permits (Sept) — ⚠️ Possible delay
⏰ 8:30 AM — Import Price Index (Sept) — ⚠️ Possible delay
⏰ 🚩 9:15 AM — Industrial Production & Capacity Utilization (Sept) — ⚠️ Possible delay
⚠️ Shutdown Watch:
Several economic reports (Retail Sales, PPI, Jobless Claims, Housing, Industrial Production) depend on agencies like the Census Bureau, BLS, and BEA — if the shutdown persists, these will be postponed until government funding resumes.
Expect headline-driven trading, Fed-speak sensitivity, and lighter macro liquidity through the week.
⚠️ Disclaimer: Educational / informational only — not financial advice.
📌 #trading #stockmarket #SPY #SPX #Fed #Powell #Bowman #Waller #Bostic #Barkin #Miran #RetailSales #PPI #BeigeBook #inflation #bonds #shutdown #economy #housing #earnings #macro
SPY: Bullish Continuation & Long Trade
SPY
- Classic bullish formation
- Our team expects growth
SUGGESTED TRADE:
Swing Trade
Buy SPY
Entry Level - 653.12
Sl - 649.92
Tp - 659.88
Our Risk - 1%
Start protection of your profits from lower levels
Disclosure: I am part of Trade Nation's Influencer program and receive a monthly fee for using their TradingView charts in my analysis.
❤️ Please, support our work with like & comment! ❤️

$SPY - Pullback for the S&PA pullback looks likely, but it’s still within a bullish structure. Unless SPY breaks below 600 with heavy volume, it’s more of a buy-the-dip scenario than a trend reversal but we definitely hit resistance at the top of this channel.

Spy ideas Going long here because rsi is too oversold . If this keeps going lower would double down down calls at 640 but I think the market recovers next week

Opening (IRA): SPY December 19th -605P... for a 6.47 credit.
Comments: On second thought, going to ladder out a bit here on weakness plus higher IV. Targeting the strike paying around 1% of the strike price in credit.
Will look at add at intervals, assuming I can get in at strikes better than what I currently have on and/or roll out at 50% max.

Opening (IRA): SPY November 21st -625P... for a 6.26 credit.
Comments: Whoop, there it is. >21 VIX plus weakness. Targeting the strike paying around 1% of the strike price in credit.
Will look to add at intervals, assuming I can get in at strikes better than what I currently have on.

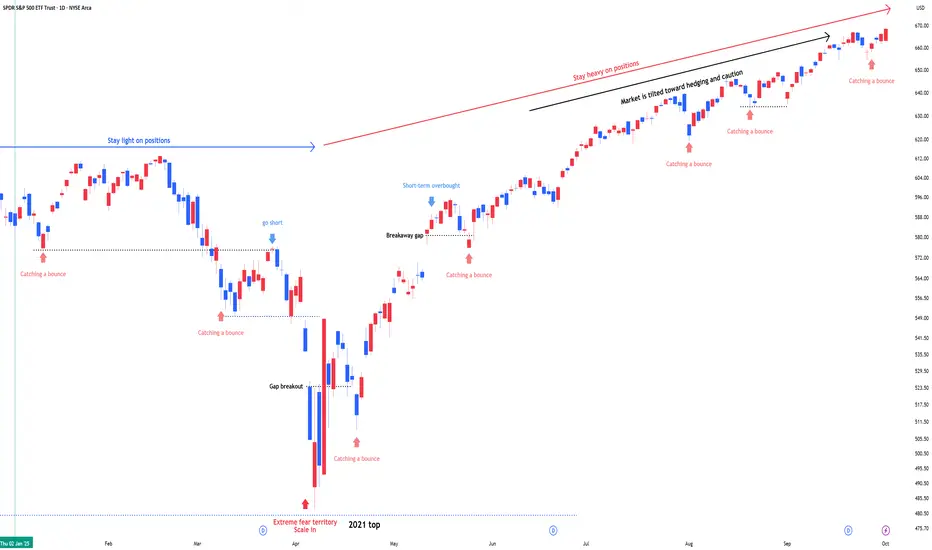
SPY : Stay heavy on positionsSPY : Stay heavy on positions (2x leverage)
Entering a risk-on, high-volatility zone.
In stay light on positions zones, I hold SPY(+QQQ) and reduce exposure.
In stay heavy on positions zones, I increase allocation using a mix of SSO(+QLD) and TQQQ.
** This analysis is based solely on the quantification of crowd psychology.
It does not incorporate price action, trading volume, or macroeconomic indicators.

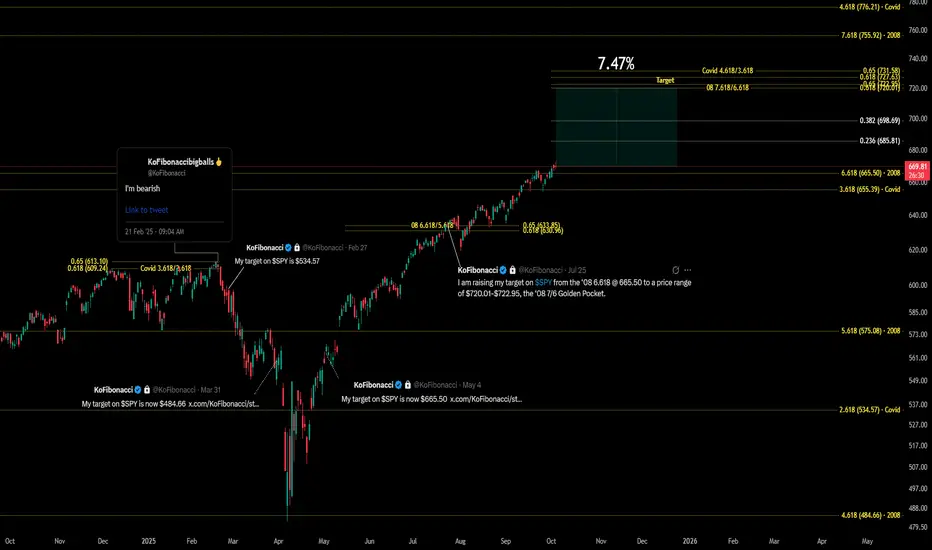
So complex, yet so simple. Only about 7.5% to go. $SPYAMEX:SPY Daily Historical Golden Ratio (9/24-Present)
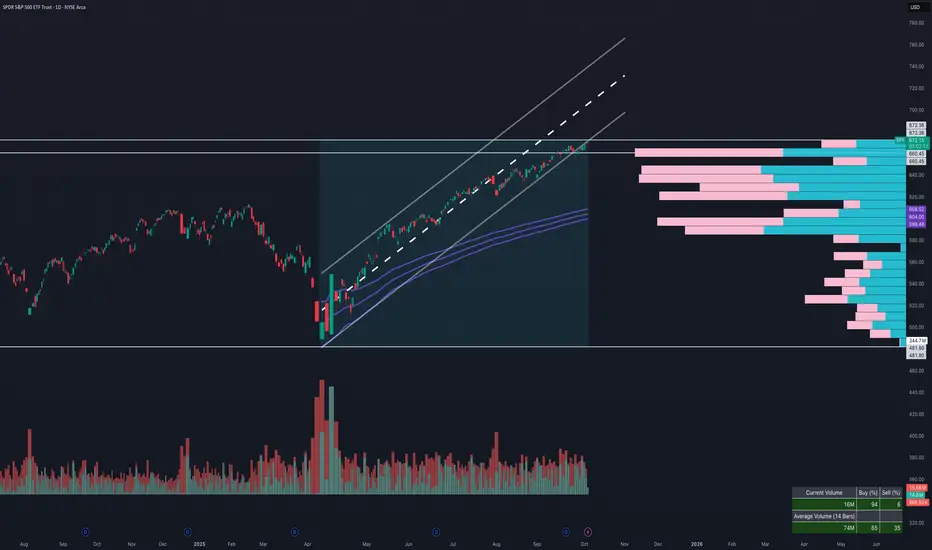
SPY on daily - trend still up but with fading volumeShows anchored vwap from April Lows around ~600 and has a gap on the same price.
SPY Currently at the lows of April channel and slightly outside.
I have also added volume profile to show where SPY bounced from the thick volume around 635.
If you want more finer charts like these with channels and vwaps / volume profile and at 3 different timeframes then message me on X - vickg81.
Elliott Wave Forecast: SPDR S&P 500 (SPY)’s Path to Record PeaksThe Short-Term Elliott Wave analysis for the SPDR S&P 500 ETF (SPY), starting from August 2, indicates an ongoing impulsive rally. From the August 2 low, the ETF surged in wave ((i)) to 647.04, followed by a dip in wave ((ii)) concluding at 634.92. The ETF then climbed in wave ((iii)) to 667.34. A corrective pullback in wave ((iv)) formed a zigzag Elliott Wave pattern. From the wave ((iii)) peak, wave (a) declined to 661.98, wave (b) rallied to 664.65, and wave (c) dropped to 654.42, completing wave ((iv)).
The ETF has since resumed its upward trajectory in wave ((v)), exhibiting an impulsive structure with internal extensions. From the wave ((iv)) low, wave (i) reached 662.37, and a brief pullback in wave (ii) ended at 657.88. The ETF then nested higher, with wave i peaking at 665.8 and wave ii correcting to 660.93. Wave iii ascended to 670.74, followed by a wave iv pullback to 666.78. As long as the pivot low at 654.42 holds, the ETF should continue its upward momentum in the near term.

SPY : Stay heavy on positionsSPY : Stay heavy on positions (2x leverage)
Entering a risk-on, high-volatility zone.
In stay light on positions zones, I hold SPY(+QQQ) and reduce exposure.
In stay heavy on positions zones, I increase allocation using a mix of SSO(+QLD) and TQQQ.
** This analysis is based solely on the quantification of crowd psychology.
It does not incorporate price action, trading volume, or macroeconomic indicators.
$SPY / $SPX Scenarios — Thursday, Oct 2, 2025🔮 AMEX:SPY / SP:SPX Scenarios — Thursday, Oct 2, 2025 🔮
🌍 Market-Moving Headlines
🚩 Shutdown watch: Traders brace for possible delays in major data releases; only essential reports like jobless claims likely to print.
📉 Post-ADP/ISM digestion: Markets recalibrate after Wednesday’s jobs + factory data ahead of Friday’s 🚩 NFP.
💵 Fed chatter: Dallas Fed’s Logan adds to policy tone as markets parse shutdown + labor signals.
📊 Key Data & Events (ET)
⏰ 🚩 8:30 AM — Initial Jobless Claims (weekly) (will publish even under shutdown)
⏰ 10:00 AM — Factory Orders (Aug) (at risk of delay if shutdown persists)
⏰ 10:30 AM — Fed Speaker: Lorie Logan (Dallas Fed)
⚠️ Disclaimer: Educational/informational only — not financial advice.
📌 #trading #stockmarket #SPY #SPX #joblessclaims #factoryorders #Fed #shutdown #bonds #Dollar #economy
SPY MONEY PRINTER GO BRRR|LONG|
✅SPY with the FED lowering rates, liquidity injections perspective fuel risk assets. Price has broken out above the key level, signaling bullish order flow. SMC outlook suggests momentum could push into new all-time highs as money printer effects unfold. Time Frame 1H.
LONG🚀
✅Like and subscribe to never miss a new idea!✅

TANKTOBER!SPY eyeing a break below 6600—shutdown looms, Powell’s silence speaks volumes. Holding shorts, rolling puts into November 655s if we gap. #SharpShooterStocks #Trading #SPY #Shutdown2025

$SPY / $SPX Scenarios — Tuesday, Sept 30, 2025🔮 AMEX:SPY / SP:SPX Scenarios — Tuesday, Sept 30, 2025 🔮
🌍 Market-Moving Headlines
📉 Q3 closeout: Last trading day of September = quarter-end rebalancing flows in equities and bonds.
💵 Fed watch: Multiple Fed speakers across the day keep policy tone in focus.
💻 Mega-cap drift: NASDAQ:AAPL , NASDAQ:MSFT , NASDAQ:NVDA leadership remains sensitive to yields + growth data.
📊 Key Data & Events (ET)
⏰ 🚩 9:00 AM — S&P Case-Shiller Home Price Index (Jul, 20-city)
⏰ 🚩 10:00 AM — JOLTS Job Openings (Aug)
⏰ 🚩 10:00 AM — Consumer Confidence (Sep, Conf. Board)
⏰ 9:45 AM — Chicago PMI (Sep)
🗣️ Fed Speakers:
• 6:00 AM — Philip Jefferson (Fed Vice Chair)
• 9:00 AM — Susan Collins (Boston Fed)
• 1:30 PM — Austan Goolsbee (Chicago Fed)
• 3:30 PM — Austan Goolsbee (Chicago Fed, TV appearance)
⚠️ Disclaimer: Educational/informational only — not financial advice.
📌 #trading #stockmarket #SPY #SPX #Fed #Powell #JOLTS #ConsumerConfidence #CaseShiller #PMI #Dollar #bonds #megacaps
SPYBASED ON OUR AI FEDRATE MODEL HIGHER LONG TERM PROJECTIONS HAVE BEEN POSTED ON THE CHART.
THERE IS $7.7 TRILLIONS parked in #MONEY market funds. The #FED is going to cut rates next month. THIS COULD BE THE SOURCE OF 🚀 TO PUSH #SPY #SPX much higher.

SPY – Bulls Regain Control as Gamma Frame the Next Move. Sep 291-Hour Technical Outlook
SPY has rebounded sharply off the $654–$655 demand zone, reclaiming $662 and now grinding toward the top of its rising wedge. The hourly MACD shows strong positive momentum and the Stoch RSI is elevated near overbought, suggesting bulls are in short-term control but may need a healthy pullback or consolidation to reset.
Key resistance lies at $664–$667, with a larger breakout level at $668. Support to monitor sits at $660, then $657, the key inflection area that triggered Friday’s bounce.
Gamma Exposure (GEX) Confirmation
The options market echoes the chart setup:
* Highest positive GEX / Call Resistance sits at $664–$667, with the strongest wall near $668, matching the upside breakout zone.
* Heavy Put Support rests at $657, with secondary layers around $655, forming a robust floor.
* Dealers are currently net short gamma, which can add fuel to intraday moves as price approaches these extremes.
A decisive hourly close above $667 could create a gamma squeeze toward $668+, while a drop under $657 would likely trigger defensive selling toward $655.
Trade Ideas & Option Plays for This Week
* Bullish Setup: Long on a clean break above $664–$667, targeting $668. Option setups: 0DTE or 2DTE 665/670 call spreads to manage risk and cost.
* Bearish Setup: Short if SPY fails at $664 and closes back below $657, targeting $655 or even $650. Consider 660/655 put spreads or short-dated puts.
* IVR around 14.5 and IVx ~13 mean option premiums are relatively low—good for debit strategies.
My Take
SPY is attempting a trend resumption after last week’s pullback. The gamma map lines up perfectly with the technical picture: $657 is the line in the sand for bulls to defend, while $667–$668 is the breakout trigger. Expect increased volatility once price decisively moves beyond either side.
Disclaimer: This analysis is for educational purposes only and does not constitute financial advice. Always do your own research and manage risk before trading.
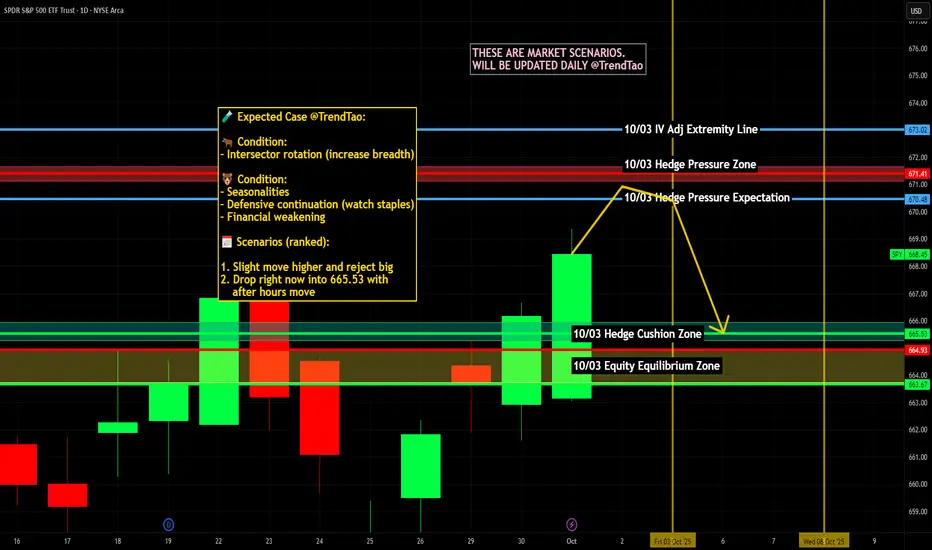
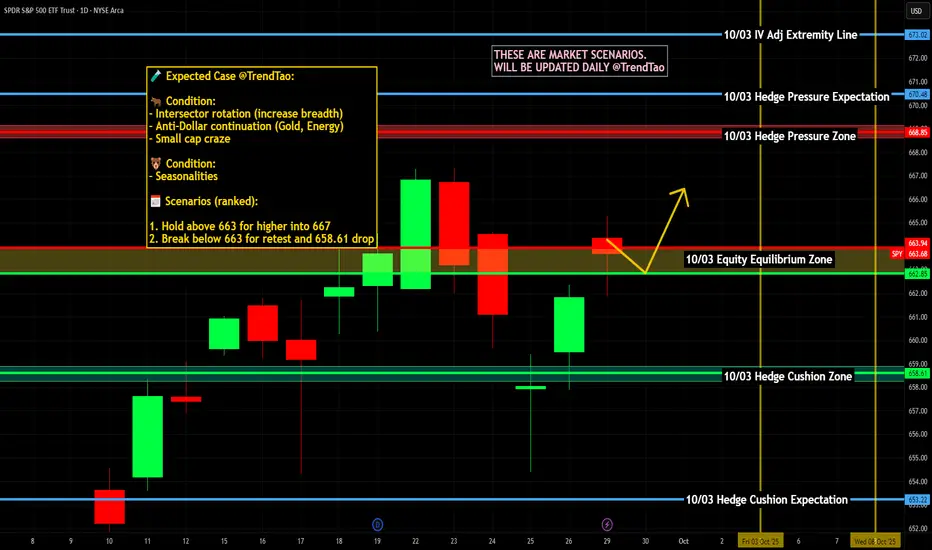
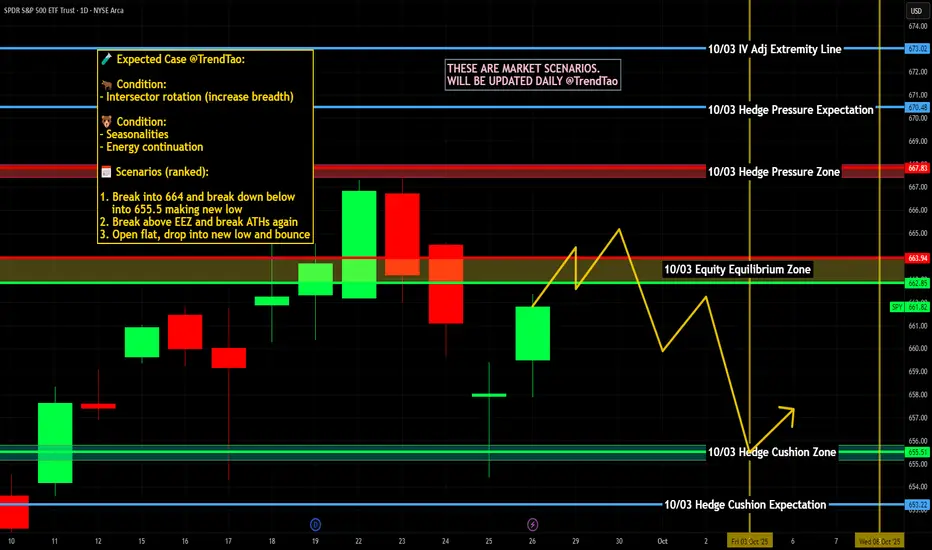
$SPY / $SPX Scenarios — Week of Sept 29 → Oct 3, 2025🔮 AMEX:SPY / SP:SPX Scenarios — Week of Sept 29 → Oct 3, 2025 🔮
🌍 Market-Moving Headlines
📉 Month/Q3 closeout: Quarter-end rebalancing + fund flows set tone early in the week.
🚩 Jobs Week: ADP (Wed) + NFP (Fri) will dominate macro narrative and Fed expectations.
💻 Mega-cap rotation: NASDAQ:AAPL , NASDAQ:NVDA , NASDAQ:MSFT drive tech leadership amid yield volatility.
🌐 Housing + confidence: Home sales + Case-Shiller + sentiment test consumer resilience.
💵 Rates & Fed tone: Packed Fed speaker slate keeps policy path in play alongside data.
📊 Key Data & Events (ET)
Mon 9/29
⏰ 10:00 AM — Pending Home Sales (Aug)
Tue 9/30
⏰ 🚩 9:00 AM — S&P Case-Shiller Home Price Index (Jul)
⏰ 🚩 10:00 AM — JOLTS Job Openings (Aug)
⏰ 🚩 10:00 AM — Consumer Confidence (Sep)
⏰ 9:45 AM — Chicago PMI (Sep)
Wed 10/1
⏰ 🚩 8:15 AM — ADP Employment (Sep)
⏰ 🚩 10:00 AM — ISM Manufacturing (Sep)
⏰ 10:00 AM — Construction Spending (Aug)
⏰ TBA — Auto Sales (Sep)
Thu 10/2
⏰ 🚩 8:30 AM — Initial Jobless Claims (weekly)
⏰ 10:00 AM — Factory Orders (Aug)
Fri 10/3
⏰ 🚩 8:30 AM — Nonfarm Payrolls (Sep)
⏰ 🚩 8:30 AM — Unemployment Rate (Sep)
⏰ 🚩 8:30 AM — Average Hourly Earnings (Sep)
⏰ 10:00 AM — ISM Services (Sep)
⚠️ Disclaimer: Educational/informational only — not financial advice.
📌 #trading #stockmarket #SPY #SPX #NFP #ADP #Fed #Powell #jobs #unemployment #wages #housing #consumerconfidence #PMI #bonds #Dollar #megacaps
SPY trend Broken? Use this Long / Short StrategyLast week was a choppy sell off in the markets.
We did see the bulls defend price later into the week by bouncing the main indices very nicely.
We discuss the simple support / resistance where you should be watching.
Using the daily 7MA as resistance can be shorted however if we recapture and close above, then the markets remain a long to new highs.
The trend of higher lows is still in tact signaling bullish strength... can we search for a new higher high?

SPY pull back before rip!my theory from what it looks like we're in wave 2 getting ready for a wave 3 i anticipate a pull back to 657 possibly even testing my green trend line i have marked i will try longs around that area aiming for minimum 687

SpyNext week marks end of the quarter and the week after is a black out week with no earnings. Any pullback or major correction has that 2week window. Once new earning season kicks off you usually don't see a significant correction before tech earnings.
Here's the indexes and where we stand
Most indexes are at the top of that trendline resistance from 2010.
Here's TVC:DJI dow jones
Weekly
Daily
Rising wedge near the top here at 46,700
I don't think this breaks over 46,700 but it's only bearish back below 45,000!
AMEX:IWM
Weekly top near 247-250. Tagged it early last week
Daily
Still inside its summer uptrend.
235 support and 247 resistance.. I don't think this breaks back over 245 this week. I think channel support will get tag
. Below 233 and 225 comes
NASDAQ:QQQ
Market runs on tech
Weekly
Top of trend similar to Iwm
Daily
Price action up here at Weekly trend looks eerily similar to last year
AMEX:SPY
Weekly is a mirror to Iwm and Qqq
Daily
Wedged here at the top
I don't think Spy will Crack above 670 here...
May tag 666 again but it will all depend on Qqq.
Example, if Qqq pushes above 598 then it's most likely going back to 602 and with that move Spy will likely tag 666 again.
But if Qqq can't Crack back above 598 then flush we will for the next week or 2.
End of month and quarter rebalancing will give some selling but the bigger pullback will come with either government shutdown or monthly jobs report due out friday.
As you can see we are at long term resistance here on the indexes , the long is wrong here with out a 5-7% pullback.
Looking for a move to 630-640 in the next 2 weeks

Are We About To See A HUGE Change In The Market...Stock Market Forecast | QQQ SPY CME_MINI:NQ1! CME_MINI:ES1! SP:SPX NASDAQ:NDX
Mag 7 | TSLA NVDA AAPL AMZN META MSFT GOOGL
