IRI Integrated Research WeeklyIRI Weekly
Looking for an entry into this, as fundamentals are good and it appears undervalued
Technically near long term support level and has 2x bullish harmonic patterns being a bullish bat and a bullish anti shark
These patterns complete at different levels being $0.40c and $0.205c
Clearly I p
Integrated Research Limited
No trades
Next report date
—
Report period
—
EPS estimate
—
Revenue estimate
—
0.075 AUD
13.36 M AUD
68.26 M AUD
95.14 M
About Integrated Research Limited
Sector
Industry
CEO
Ian Lowe
Website
Headquarters
North Sydney
Founded
1988
IPO date
Dec 13, 2000
Identifiers
2
ISIN AU000000IRI3
Integrated Research Ltd. engages in the design, development, implementation, and sale of systems and applications management software. It operates through the following geographical segments: Americas, Europe, Asia Pacific, and Corporate Australia. The Americas segment is involved in North, Central, and South America operations. The Europe segment focuses on operations in the United Kingdom and Germany. The Asia Pacific segment includes Australia and Singapore. The Corporate Australia segment includes research and development, and corporate head office functions. The company was founded by Stephen John Killelea in August 1988 and is headquartered in North Sydney, Australia.
Related stocks

IRI bounces again from long-term support 2.10. IRI is a fairly stable stock focused on tech SAAS products in the BI space (and others). This has bounced yet again along long-term support $2.10 and may achieve targets (again) around 2.20-2.50. Good repeat trade cycle with this one.


IRI looks to have found some support + director buying.Recent director buys around $2.15 and now $2.50 are giving some credence to IRI for future positive growth. Having taken a beating in the last 6 months or so, it seems to have found some support, and it looks like management have taken the message that change is needed.. likely with how licensing is

IRI starting to lift off after good HY reports.IRI has been consolidating for a while, but may be ready to lift off after some good volume yesterday (due to decent HY reports). Target around 2.80-3.00.'

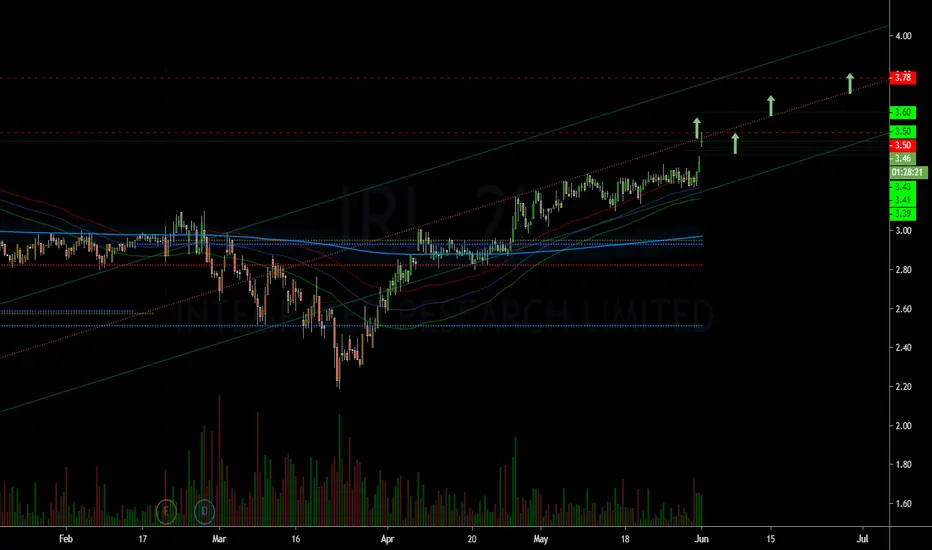
IRI - Trying to break at 3.50 to the upsideIRI - Trying to break at 3.50 to the upside
The price and volume breakout we seeing today could lead share prices to its next target at around 3.78, but first, it needs to hold above 3.50
IRI Breakout out of baseIRI has been in a stage one consolidation for a while now. History says it knows how to trend. It might need another week or so to tighten up, but looks like it has been supported and accumulated. Supply may dry up soon and a new trend will begin

$IRI breakout, back the tl breakDon't particularly like the left side on this chart, but the base break out followed by the pull back looked worth a punt. #trendfollowing


IRI Over-bought in this horizontal pattern
Offers 15% potential between top and bottom drawn support and resistance
If it makes higher highs past $3 then continue to be patient and wait for further higher highs and higher lows to confirm that it's on the uptrend before getting in for a swing trade
On the weekly chart, IRI is in a do

See all ideas
Summarizing what the indicators are suggesting.
Neutral
SellBuy
Strong sellStrong buy
Strong sellSellNeutralBuyStrong buy
Neutral
SellBuy
Strong sellStrong buy
Strong sellSellNeutralBuyStrong buy
Neutral
SellBuy
Strong sellStrong buy
Strong sellSellNeutralBuyStrong buy
An aggregate view of professional's ratings.
Neutral
SellBuy
Strong sellStrong buy
Strong sellSellNeutralBuyStrong buy
Neutral
SellBuy
Strong sellStrong buy
Strong sellSellNeutralBuyStrong buy
Neutral
SellBuy
Strong sellStrong buy
Strong sellSellNeutralBuyStrong buy
Displays a symbol's price movements over previous years to identify recurring trends.
Frequently Asked Questions
The current price of IRI is 0.320 AUD — it has decreased by −3.03% in the past 24 hours. Watch Integrated Research Limited stock price performance more closely on the chart.
Depending on the exchange, the stock ticker may vary. For instance, on ASX exchange Integrated Research Limited stocks are traded under the ticker IRI.
IRI stock has fallen by −7.25% compared to the previous week, the month change is a −3.03% fall, over the last year Integrated Research Limited has showed a −25.58% decrease.
We've gathered analysts' opinions on Integrated Research Limited future price: according to them, IRI price has a max estimate of 0.31 AUD and a min estimate of 0.31 AUD. Watch IRI chart and read a more detailed Integrated Research Limited stock forecast: see what analysts think of Integrated Research Limited and suggest that you do with its stocks.
IRI stock is 1.56% volatile and has beta coefficient of 1.10. Track Integrated Research Limited stock price on the chart and check out the list of the most volatile stocks — is Integrated Research Limited there?
Yes, you can track Integrated Research Limited financials in yearly and quarterly reports right on TradingView.
Integrated Research Limited is going to release the next earnings report on Feb 25, 2026. Keep track of upcoming events with our Earnings Calendar.
Integrated Research Limited revenue for the last half-year amounts to 39.40 M AUD, despite the estimated figure of 39.20 M AUD. In the next half-year revenue is expected to reach 27.60 M AUD.
IRI net income for the last half-year is 8.79 M AUD, while the previous report showed 4.57 M AUD of net income which accounts for 92.17% change. Track more Integrated Research Limited financial stats to get the full picture.
Integrated Research Limited dividend yield was 4.82% in 2025, and payout ratio reached 26.46%. The year before the numbers were 2.15% and 12.85% correspondingly. See high-dividend stocks and find more opportunities for your portfolio.
As of Feb 12, 2026, the company has 131 employees. See our rating of the largest employees — is Integrated Research Limited on this list?
Like other stocks, IRI shares are traded on stock exchanges, e.g. Nasdaq, Nyse, Euronext, and the easiest way to buy them is through an online stock broker. To do this, you need to open an account and follow a broker's procedures, then start trading. You can trade Integrated Research Limited stock right from TradingView charts — choose your broker and connect to your account.
Investing in stocks requires a comprehensive research: you should carefully study all the available data, e.g. company's financials, related news, and its technical analysis. So Integrated Research Limited technincal analysis shows the sell today, and its 1 week rating is sell. Since market conditions are prone to changes, it's worth looking a bit further into the future — according to the 1 month rating Integrated Research Limited stock shows the sell signal. See more of Integrated Research Limited technicals for a more comprehensive analysis.
If you're still not sure, try looking for inspiration in our curated watchlists.
If you're still not sure, try looking for inspiration in our curated watchlists.