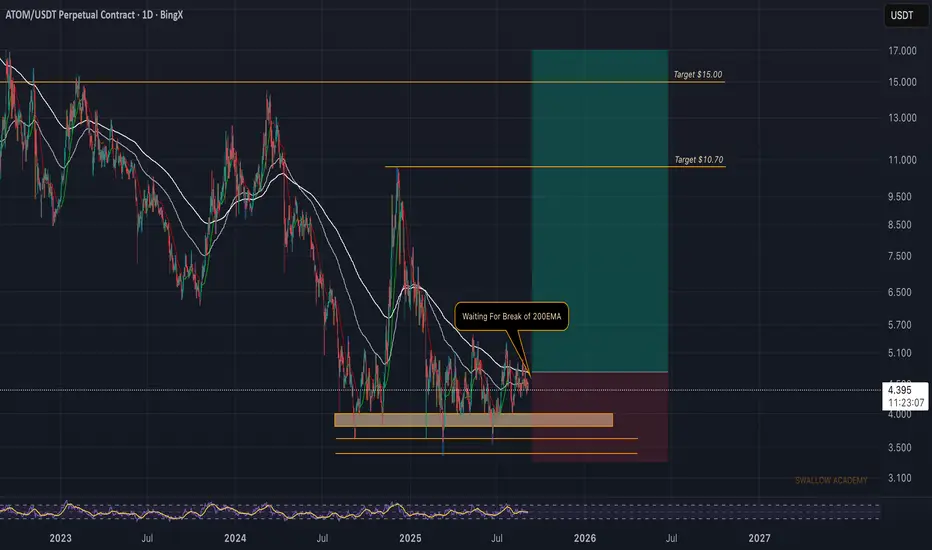
Cosmos (ATOM): Waiting For Break of 200EMA | BULLISH AFATOM is pressing against the 200EMA, which has been acting as dynamic resistance for a while. A clean break above this level would be the confirmation we’re waiting for to target higher zones.
The structure remains intact above the support zone, and as long as buyers defend this level, we’re positi
ATOM USDTATOM USDT
SPOT
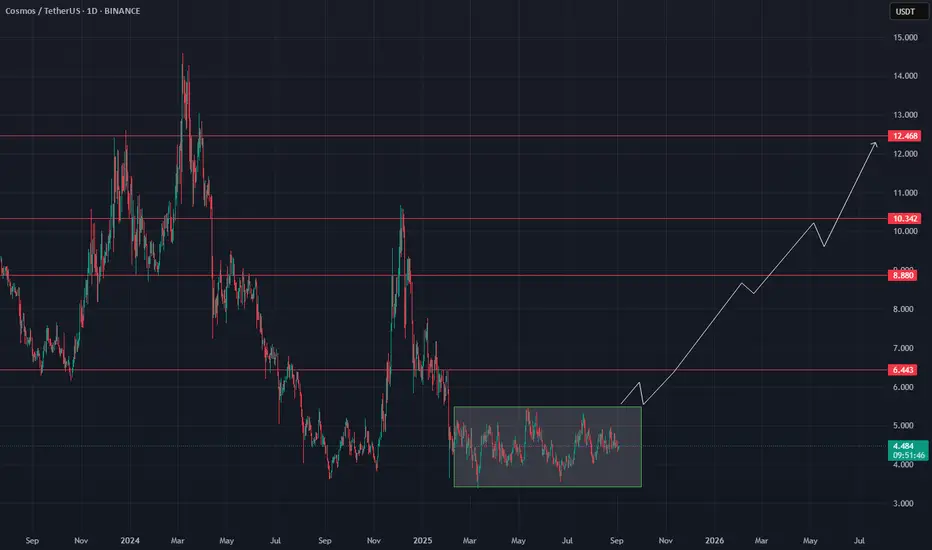
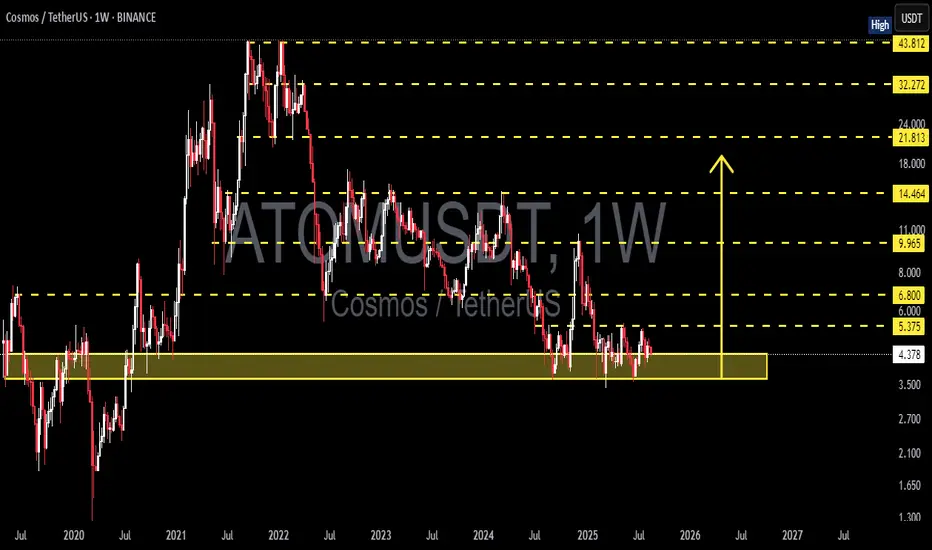
On the daily timeframe, after breaking above the green box, this altcoin has the potential to move toward the resistance levels highlighted by the red lines.
Personally, I’ve entered a small long position on this altcoin while strictly applying risk management.
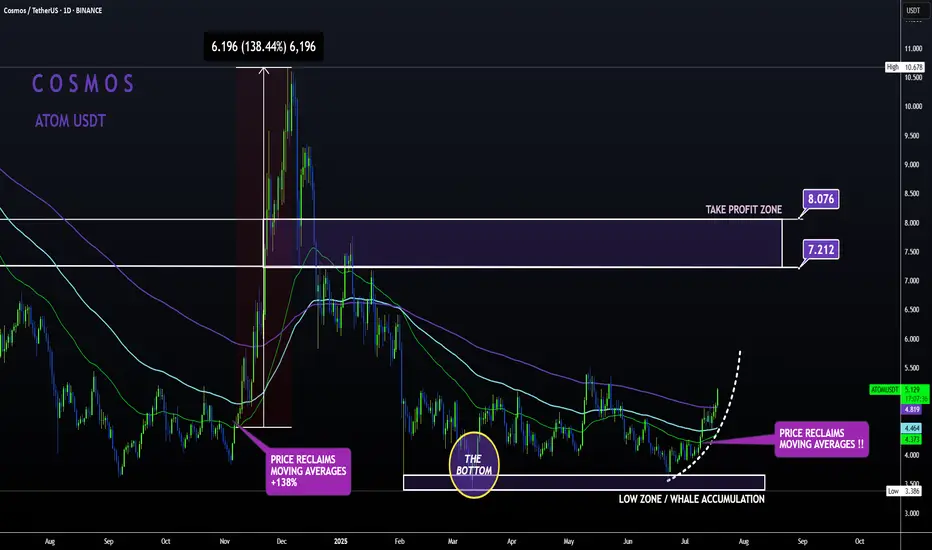
ATOM Sleeping GIANT ALT | Moving Averages BULLISH like NOV24'ATOM is slowly but surely making a turn up towards the first Take Profit point.
From the bottom, Cosmos has already increased a whopping 52% , with even more room to grow:
In my previous update, the 4 was still bearish when looking at trend lines and moving averages.
However, this has flipped
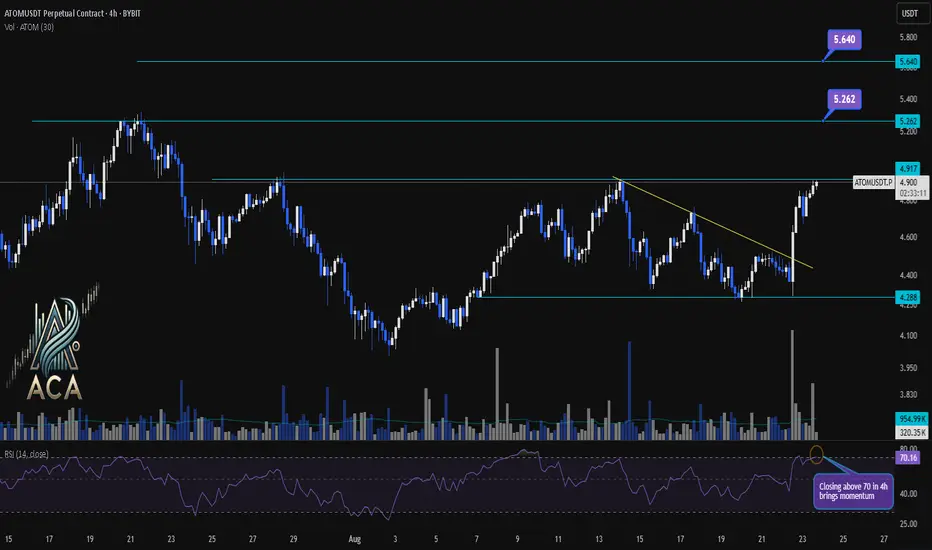
ATOMUSDT 4H Chart Analysis | Momentum Breakout in PlayATOMUSDT 4H Chart Analysis | Momentum Breakout in Play
🔍 Let’s dive into the ATOM/USDT perpetual contract and analyze the latest price action, outlining key bullish setups and momentum signals.
⏳ 4-Hour Overview
The 4-hour chart reveals a strong bullish push, with price surging above the trendli
Cosmos (ATOM): Looking For Break of Structure | Bullish AFOne of the most undervalued coins, ATOM, might be going for a decent BOS, which could open for us a smaller scalping opportunity. On a bigger timeframe, this coin is still a sleeper!
More in-depth info is in the video—enjoy!
Swallow Academy

ATOM/USDT Weekly – Strong Accumulation, Is a Major Reversal?📊 Overview
The ATOM/USDT weekly chart shows that the price is currently in a long-term accumulation phase after a massive downtrend since 2022.
The 3.5–4.6 USDT demand zone has acted as a strong historical support level since 2020 and has once again proven its strength during 2024–2025.
In simple t
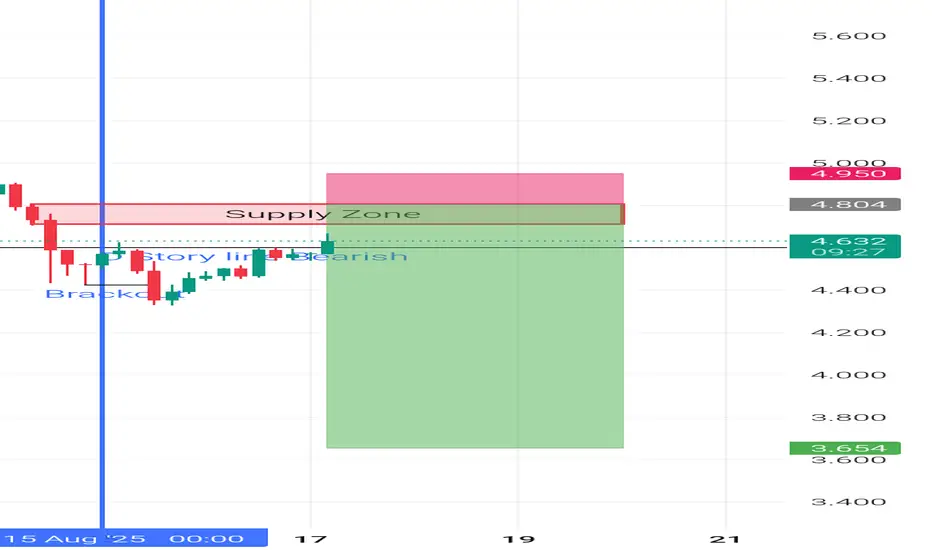
ATOM_USDT 4H Sell Trade.Atom is reaching to the 4H supply right now. When I added Fibonacci Indicator on the chart I can see Golden Pocket zone on that area. This is a good sing for Market revasal.Other wise Im expecting 15munutes divergence could be created. So keep watching on the Market to catch a good trade.
HAPPY TR
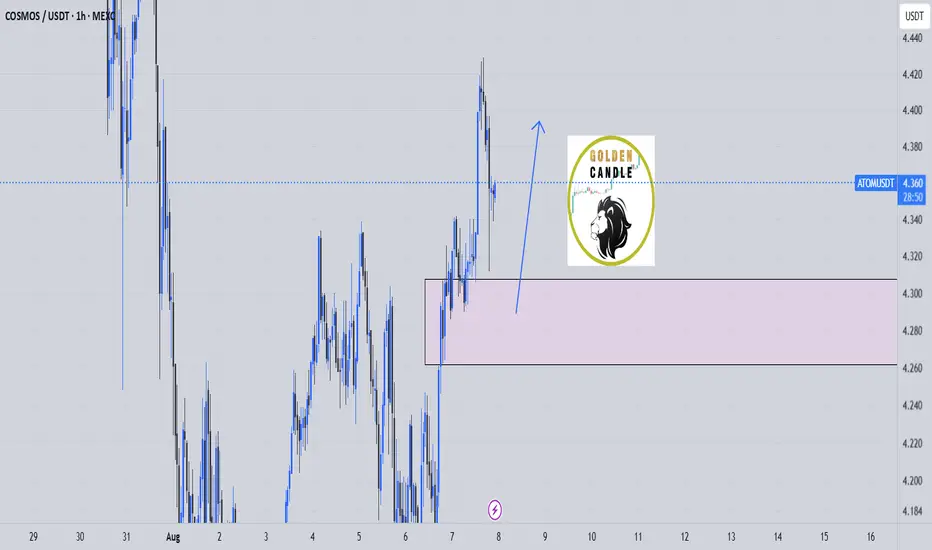
buy midterm atom "🌟 Welcome to Golden Candle! 🌟
We're a team of 📈 passionate traders 📉 who love sharing our 🔍 technical analysis insights 🔎 with the TradingView community. 🌎
Our goal is to provide 💡 valuable perspectives 💡 on market trends and patterns, but 🚫 please note that our analyses are not intended as buy o
Cosmos (ATOM): Seeing Potential 8% Movement Towards FVGAfter a successful H&S pattern, we are seeing a good opportunity to take a few long positions here on the ATOM coin, so that's what we are looking for: a potential 8% movement to happen here!
More in-depth info is in the video—enjoy!
Swallow Academy

Cosmos 365 · Proof of Bullish · Bull Market Wave NextCosmos (ATOMUSDT) has been sideways for an entire year now. The current trading range is a long-term support, buy and accumulation zone. This zone is already proven to be a bullish launchpad based on late 2024. The same levels were active in August-October-November 2024 leading to a mild bullish wav

See all ideas
Summarizing what the indicators are suggesting.
Oscillators
Neutral
SellBuy
Strong sellStrong buy
Strong sellSellNeutralBuyStrong buy
Oscillators
Neutral
SellBuy
Strong sellStrong buy
Strong sellSellNeutralBuyStrong buy
Summary
Neutral
SellBuy
Strong sellStrong buy
Strong sellSellNeutralBuyStrong buy
Summary
Neutral
SellBuy
Strong sellStrong buy
Strong sellSellNeutralBuyStrong buy
Summary
Neutral
SellBuy
Strong sellStrong buy
Strong sellSellNeutralBuyStrong buy
Moving Averages
Neutral
SellBuy
Strong sellStrong buy
Strong sellSellNeutralBuyStrong buy
Moving Averages
Neutral
SellBuy
Strong sellStrong buy
Strong sellSellNeutralBuyStrong buy
Displays a symbol's price movements over previous years to identify recurring trends.