ATOMUSD Bullish Forecast Atom looks bullish in the 9.046 area with a bias of 10.867.
There are a lot of supply zones that need to be broken to complete the directional bias, so monitoring is required.
5 could drop heavily or midway; extremes are given for 9.4 to pull back up.
Trade ideas

ATOM's correction and longs again.Long time no see.
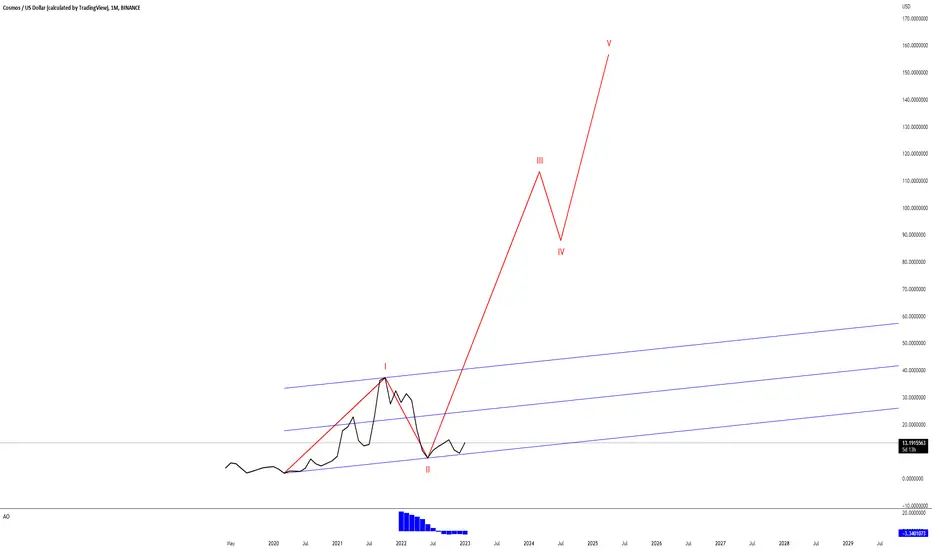
I believe ATOM is forming the fifth wave as ending diagonal and we formed only the leg A of ABC.
After correction I'm going to go long. Pretty much the same picture across other cryptos.

ATOM/USDT 1DAY UPDATE BY CRYPTO SANDERS !!Hello, welcome to this ATOM/USD update by CRYPTO SANDERS.
CHART ANALYSIS:-Cosmos (ATOM) was another notable mover in today’s session, with the token climbing for a second straight day.
Following a low of $13.15 on Tuesday, ATOM/USD moved to a peak of $13.84 earlier in the day.
Wednesday’s rally saw the cosmos move above a ceiling at $13.50, nearing its highest point since November 8 in the process.
Whilst this resistance level was broken, the 14-day RSI was approaching one of its own at 66.00.
As of writing, the index is tracking at 61.77, after it bounced from a support point at 58.00
Should this ceiling at 66.00 be hit, it is likely that ATOM could be trading above the $14.00 mark.
I have tried to bring the best possible outcome to this chart.
Hit the like button if you like it and share your charts in the comments section.
Thank you

ATOMUSD Triangle bullish break-outCosmos (ATOMUSD) broke today above the Triangle pattern that started forming after the June 17 2022 Low. By doing so it hit the 1W MA50 (red trend-line), a major Resistance during the Bear Cycle. This is the first bullish signal on the long-term and if it manages to close the candle above the 1W MA50, we expect a short-term extension to the 17.1550 September 09 High.
Closing above this Resistance, would set in motion filling the upper Fibonacci levels of 0.382 and 0.5, which as you see happen to be exactly on the May 05 (20.350) and April 20 (25.100) Highs respectively.
-------------------------------------------------------------------------------
** Please LIKE 👍, FOLLOW ✅, SHARE 🙌 and COMMENT ✍ if you enjoy this idea! Also share your ideas and charts in the comments section below! **
-------------------------------------------------------------------------------
💸💸💸💸💸💸
👇 👇 👇 👇 👇 👇

Atom chart analysisHere is the chart of ATOM. short position from blue line after closing the red candle of 30 min chart. Not a financial advice. Just a analysis. By the way line AB and CD are forming a wedge at point E , So , this may be a good short from E.
Do your own research.
Not a financial advice.

Wave Forecast...Like many other charts they're looking like a big wave 1-2, If you know what happens next under wave theory you should be very excited as a bull for the potential of parabola.

LONG OPPORTUNITY IN "ATOM USDT"Here we can see that "ATOM USDT" chart in 1 day time frame has a resistance by a trendline on at "13.216" and a support zone at "10.922". We can see that the price reacted varios times from both the resistance and support zone. We can look for a LONG OPPORTUNITY at the "10.992" zone with a tight STOPLOSS of 2.43% at "10.584" and TARGET ZONE at "13.064". If this trade gets successfull it has a RISK REWARD ratio of "1:6". TAKE TRADE IN FUTURE WITH 20X LEVERAGE.
ENJOY!!!

ATOM FORMING ANOTHER LOWER HIGH - BEARISHAs you can see $ATOM #COSMOS is forming a new LOWER HIGH & RSI is in extreme overbought territory.
This is not how bull runs begin.
Almoust every other altcoin has same pattern, aswell as #BITCOIN. The market has to correct to get more fuel to rise higher.
Earnings season is estimated for TradFi to be bad compared to previous year. If SPX corrects, crypto will follow.
Fundamentaly $ATOM is the strongest crypto project in our view, but macro view and TA makes us think we're ready for correction.
Maybe no new lows will be made, but due to extreme overbought levels in RSI price needs to correct a bit.

ATOM MA200Watch ATOM's interaction with the MA200. I initiated a long on MATIC based on the MA200 yesterday, but with ATOM, there are a lot more fake-outs. I'd like to see ATOM move higher in the coming days and drop down for a retest of it in about a week. I believe BTC will have a correction in the coming days here, so if ATOM can hold the MA200, it will be a strong signal.

Cosmos: Sweet Dreams Are Made of This 🪄📈Hello Mr. Overachiever! Cosmos finally made it out of the red target zone and won't stop here. We're expecting the coin to climb further upwards to fulfill its movement higher North.

ATOMUSDTHi everyone,hope you are doing well !
i'm waiting patiently to retrace in #ATOM and then if react well its my trigger to go long.
Hope you Enjoy it
Like n Share if you like it!
Not financial Advice just my view


$Atom ShortAtom
broken demand daily and retest to the supply. should be ok to short to sell side liquidity.

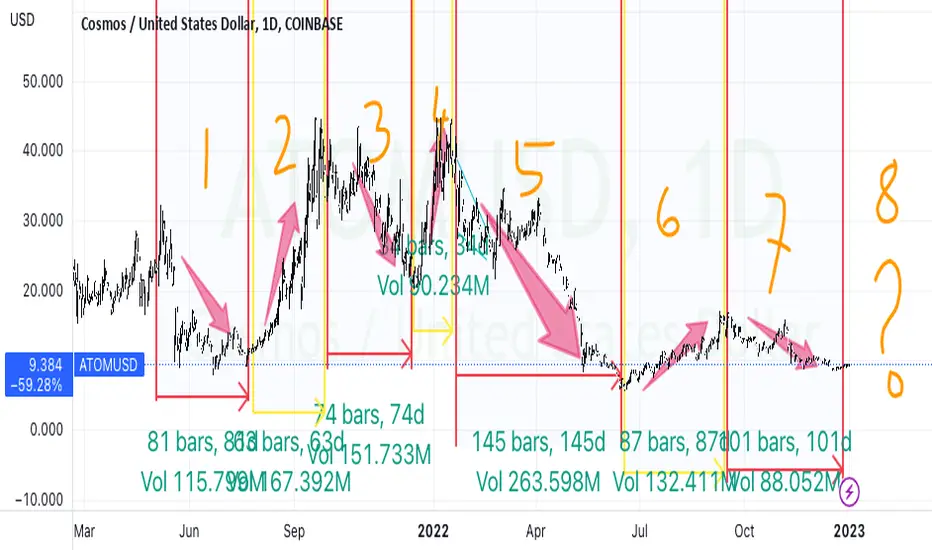
ATOM ? Again ?
If all the analysis is simple as this.
My observation is always wrong. Do not rely on it to make your investment.
Point:
1 and 2 >> 80 days down subsequent is 30-40days up
3 and 4>>> 75 days down subsequent is 30-35 days up
5 and 6>>>> and so on and so on about 505
Guess what #8 would last if #7 had ended the trend.
We are all subjected to bias.
I am a newbie in crypto. I had started buying Atom earlier/my posting , and of coz I'm hoping to be right, that's where money is made.
AND Always remember that I'm not your guru.
Please ask your guru to buy anything.
www.tradingview.com

ATOM/USDT. Price should be breakdown the channel and retest it successfully then we can open short till TP.
Open 8.869 * TP 7.792 * SL 9.348

atom USDThis page is made solely for displaying price information and the status of the projects in the market, and does not mean investment or approval of the project

ATOMUSDT 1D Interval ReviewHello everyone, welcome to the ATOMUSDT 1D chart review.
Using the white line we will mark the trend line, as you can see the price is trying to break through the indicated trend, when it did it did not test it and quickly reversed. Currently, we can determine the local downtrend line with which the price is fighting.
As for setting support, we will explore it with Fib Retracement, the first support is at $8.05, when it is broken the next support is at the last low at $5.56.
Looking the other way, we have a lot of room for growth, however, the zone from $ 12.83 to $ 17.16 is significant, only when the price goes above this zone, and then positively tests it and establishes a new support, we will see an open road towards the price of $ 22.40, and then $ 31.26 .
At the moment, the volume is insignificant, the energy has been used for the last correction, the MACD begins to indicate the entry into a local uptrend, while the RSI after touching the lower limit begins to slowly increase.


ATOM. Bear market test.For the second time in half a year, and for the fourth time in its history, ATOM is testing the lower of the global ascending channel. ATOM tests being in RSI oversold zone and with falling volumes against increasing lows. It is extremely controversial to be an ATOM holder at the moment.
