ATOM Bullish View!If COINBASE:ATOMUSD finds support in this area, it could be a good buying opportunity with a good risk-reward ratio.
Trade ideas

ATOMUSD Channel Down bottom rebound with immediate target $10.Cosmos / ATOMUSD is rebounding after almost reaching the bottom of the long term Channel Up.
This rebound is being fuelled by an enormously oversold 1day RSI.
Buy and target the 1day MA50 and dashed trendline at 10.00 short term.
If the price closes over Resistance A (11.00), buy again and target Resistance B (13.00) on the medium term.
Follow us, like the idea and leave a comment below!!

Falling wedge playing out COINBASE:ATOMUSD
Since February a falling wedge has appeared in the ATOM price. It is contained inside a neutral wedge, so it could have been both. Since yesterday the falling wedge becomes more clear. Volume is also declining, which is why the falling wedge could be considered bullish.
ATOM moves with in an upward channel still, which is invalidated when the price goes below $10.18. So far it's fine.
RSI indicates a slight rise, while prices are falling on the daily chart. This could be considered a bullish divergence.
ATOM has a strong community, and recent developments (Neutron, Stride) is not priced in imho.
The current economic situation makes me nervous and ATOM is not having a lot of press coverage at the moment. For that reason I remain cautious and would expect a furth drop to $10.18 first before a recovery to $14 would be possible.
No financial advice.

ATOM Looks AMAZINGATOM looks like a BUY here.
Broke out of resistance and landed on support.
Doesnt get any better than this.

ATOMUSD (1H) - Bearish breakoutHi Traders
ATOMUSD (1H Timeframe)
The market is in a downtrend, and we are waiting for an entry signal to go SHORT below the 9.33 support level. Only the upward break of 9.64 would cancel the bearish scenario.
Trade details
Entry: 9.33
Stop loss: 9.64
Take profit 1: 9.14
Take profit 2: 8.83
Score: 8
Strategy: Bearish breakout

Bearish Pennant Bearish pennant on the monthly has been in formation for some time now. I expect atom to retrace down to the $6-8 range.

ATOMUSD: Holding Support Above 0.786 RetraceAfter crashing below it and bottoming at the 0.886, ATOM has come back above the 0.786 and is Double Bottoming while Bullishly Diverging above a local trendline. If this action holds firm then I think it can see $22-$44.

W10-34 ATOM BULLISH IDEAPotential Bullish Entry Dow Theory In Place -
Higher High and Higher Low Expected in Place
Formation of double bottom coupled with bullish divergence (Bullish reversal pattern)
Entry, SL & TP Levels are defined.

ATOMUSD looks very bullish ATOMUSD broke the downsloping resistance line and it's pumping now.
If we get any pullback, it will be a great buying opportunity.
17 $ is the target for longs.
take profit level: 15,39
Good luck

Patience/Conviction holding/buying $ATOM right now(LONG)been watching this Inverse h&s pattern forming over the last several months. I hear Inverse H&S patterns usually happen on a reversal. Well, we been bearish for a long time, so maybe the trend is reversing and this pattern will confirm so and thus start of a bullrun on ATOM?
Left shoulder formed(Sept.-Oct.). Head Formed(Nov-Jan). Right shoulder(Feb-Now) is looking over halfway formed right about now, neckline still in tact.... pattern should be validated once price gets over $13.50- HKEX:14 area. should breakout to the 20$ zone if validated.
invalidated if price drops below HKEX:9

ATOMUSD Yes, alot of coins and cryptos are bearish but we all waiting on investing and holding the long positions when we get the chance. Here's the level I'm waiting for to get a long.

ATOM - Choose your poisonUptrend on monthly; broke its monthly downtrend with last month’s close. If it keeps holding the uptrend, we see $15 and higher; break the uptrend, and go back to $ 7 and possibly $ 2.
If you are longing here, aim for a 3-6 month trade at least.


ATOM/USDT BUY LONG🟢ATOM/USDT LONG 🟢
Entry price - 11.20$
Take Profit- 12.60$
Stop Loss- 10.80$
Stop loss importent
#btc #BTC #BITCOIN #ATOM

W9-9 ATOM BEARISH IDEA (DOUBLE TOP)Potential Bearish Entry
Dow Theory In Place - Lower High and Lower Low Expected in Place
Formation of double Top coupled with bearish divergence (Bearish reversal pattern)
Bullish Trend Is Still Intact. (careful for your levels)
SL & TP Levels are defined.

ATOMUSD - Bullish Trend - 1H TFBased on the chart pattern analysis, it appears that the price is forming higher highs (HHs) and higher lows (HLs), which indicates a bullish trend. Furthermore, the Relative Strength Index (RSI) showing divergence is synced currently. I recommend taking a long trade with a risk/reward ratio of 1:1
Please note that this is my personal analysis and trade plan, and it is important for you to conduct your own research and risk management strategies before making any trading decisions.

ATOM (Cosmos) set for a 1 to 1 extension! Atom (Cosmos) aims to be the “internet of blockchains” by allowing developers to build their own blockchains, each of which are interconnected via the Cosmos network. ATOM is the native cryptocurrency, used for staking and securing the “Global Hub,” which connects all of these blockchains. Well respected throughout the industry and widely known for being a great technology.
Atom (Cosmos) has built a STRONG ecosystem that I believe is about to take off!!!
Having an annual interest reward of over 5% on Coinbase this one is looking like a very safe play through the coming BULL!
IMO Atom (Cosmos) has bottomed and a reversal is underway!

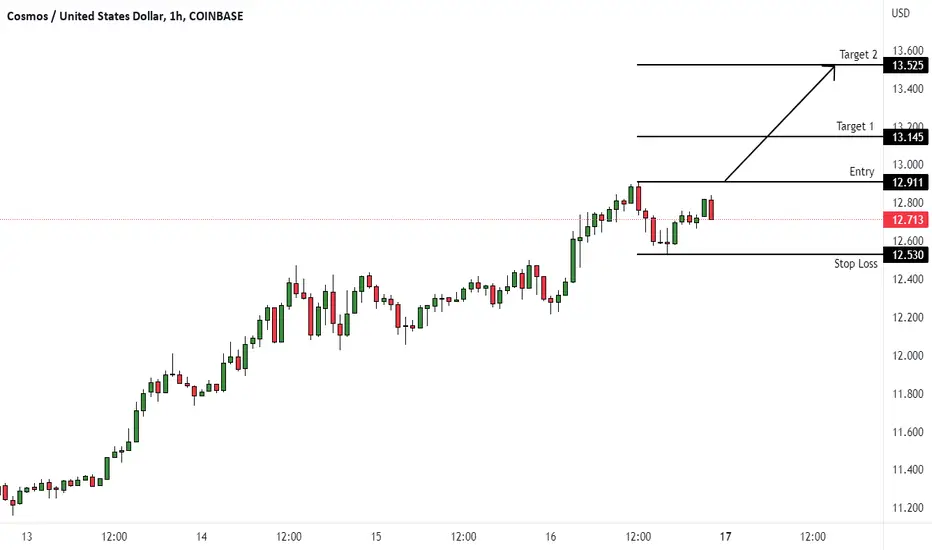
ATOMUSD (1H) - Bullish breakoutHi Traders
ATOMUSD (1H Timeframe)
The market is in an uptrend and we are waiting for an entry signal to go LONG above the 12.911 resistance level. Only the downward break of 12.530 would cancel the bullish scenario.
Trade details
Entry: 12.911
Stop loss: 12.53
Take profit 1: 13.145
Take profit 2: 13.525
Score: 8
Strategy: Bullish breakout
Cosmos momentum shiftanother really simple chart that seems to be suggesting a shift in momentum for the foreseeable future.


ATOM Strong Support LevelATOM is currently trading at a key support level, which has historically provided a strong foundation for price reversals. This support level has been tested multiple times in the past and has consistently held, demonstrating the strength and reliability of this technical indicator. Given the asset's performance at this support level, there is potential for a significant price increase throughout 2023.
With market conditions aligning and technical indicators suggesting a potential upward trend, ATOM could experience a remarkable growth of up to 1100% by December 2023. This projection is based on historical price action, trend analysis, and the assumption that the asset will continue to respect the established support level.
However, it is important to remember that past performance does not guarantee future results, and market conditions are subject to change. Investors should carefully consider their risk tolerance and investment strategy before entering any trade.


ATOM accumulation is unfolding, long or short?In general longs are preferred, with one simple note though, we might sink on 10.0-9.n in the current ending diagonal, which is highly possible. I protected my long position in the wallet with a small short, because drop can be 15% from the current price.
Also there's a chance that we might rocket any time soon, and ending diaogonal just becaomes a correction, though my gut feeling is telling me that it's not that simple.
Good luck trader!
