AudCad Sell IdeaWith AudCad still being in a bearish trend and a bearish range I've decided to short the pair. This will be my last trade of the week with Friday creeping up. There was news earlier with AUD so I simply waited on price to settle down and show me some type of set up. Once news happened and price moved we could see a low that price couldn't break below until now. Once the retest happened and gave a bearish rejection I decided to short for a 1:3rr. We'll see what happens.
Trade ideas

#033: Long Investment Opportunity on AUD/CAD
The Australian dollar/Canadian dollar exchange rate has been consolidating for several sessions, establishing a clean base just above a key demand area. Hello, I'm Forex Trader Andrea Russo, an independent trader and prop trader with $200,000 in capital under management. Thank you in advance for your time.
It's not just the support itself that's interesting, but also the way the price has reacted each time it's tested: strong rejections, increasing volume, and clear signs of institutional traders absorbing the market.
On higher timeframes, the bearish pressure is showing signs of exhaustion. The latest candles have pronounced lower wicks, a sign that buyers are returning to activity while the sellers' pressure is slowing. The price continues to move within a descending channel, but the structure is starting to show the first signs of a possible reversal.
Volumes also tell the same story: each test of the low zone has been accompanied by an increase in activity, typical of an accumulation phase. The main moving averages are flattening, confirming a loss of strength in the previous trend.
From a macro perspective, the Australian dollar continues to benefit from the stability of the commodity market and a relatively neutral monetary policy, while the Canadian dollar is suffering from the recent weakening of oil prices. This intermarket divergence often heralds a corrective or impulsive move in favor of the AUD.
In summary, the technical and fundamental context suggests a possible resumption of bullish momentum. However, it will be crucial to wait for a decisive close above the short-term resistance zone to confirm the entry of directional momentum.

AUD/CAD: Bearish Drop to 0.9097?As the previous analysis worked exactly as predicted, FX:AUDCAD is signaling a bearish continuation on the 1-hour chart , with price testing a downward trendline and forming lower highs, indicating sustained selling pressure. The entry zone sits near the resistance zone , aligning with the trendline for a high-probability short setup if sellers maintain control.
Entry between 0.9182-0.9200 for a sell position. Targets at 0.9116 (first) and 0.9097 (second) near the support zone for a solid risk-reward ratio. Set a stop loss on a close above 0.922 to protect against an unexpected reversal. Look for confirmation with a break below 0.9182 accompanied by increasing volume, driven by the prevailing bearish momentum.
Fundamentally , tomorrow—Thursday, October 16, 2025—we have the Australian Unemployment Rate report, which could trigger volatility in AUD. Additionally, the Bank of Canada Governor’s participation in a friendly session in Washington tomorrow may influence CAD movements, adding another layer of uncertainty to the pair. 💡
📝 Trade Plan:
✅ Entry Zone: 0.9182 – 0.9200 (short setup near resistance & trendline)
❌ Stop Loss: Close above 0.9220
🎯 Targets:
TP1: 0.9116 (initial support)
TP2: 0.9097 (extended downside target)
What’s your take on this setup? Share below! 👇

mrmoney limited AUD/CAD position trading ideawaiting for price to get to our monthly support or resistance zone so as to make informed trading decision

AUDCAD - Potential BUYHi Traders,
Looking at AUDCAD, i believe another move up is possible.
Good Luck


AUDCAD: Bearish Move From Resistance Confirmed 🇦🇺 🇨🇦
There is a high chance that AUDCAD will retrace from the underlined resistance.
A bearish violation of a support line of a rising channel after its test
provides a strong intraday bearish confirmation.
Goal - 0.9123
❤️Please, support my work with like, thank you!❤️
I am part of Trade Nation's Influencer program and receive a monthly fee for using their TradingView charts in my analysis.

AUDCAD Long Trade IdeaTrend: Bearish
Divergence: Bullish
Reversal Pattern: Double Bottom
Bias: Bullish
Scenario: Broke LH we will take entry at 0.382 FIB
Trade Plan
Stop Loss: 0.90565
Entry Level: 0.91215
TP: 0.9187

AUD-CAD Will Fall! Sell!
Hello,Traders!
AUDCAD reacts to the horizontal supply area, showing clear signs of Smart Money distribution. A bearish move is expected toward the next liquidity pool near 0.9130$. Time Frame 4H.
Sell!
Comment and subscribe to help us grow!
Check out other forecasts below too!
Disclosure: I am part of Trade Nation's Influencer program and receive a monthly fee for using their TradingView charts in my analysis.

AUDCAD Continuation to the down Side!!AUDCAD has come under renewed selling pressure, sliding back toward key support zones after failing to sustain gains above 0.9200. The Canadian dollar remains supported by solid employment data and oil market stability, while the Australian dollar faces headwinds from weaker Chinese demand and a cautious RBA. With momentum shifting lower, AUDCAD looks poised for further downside if support levels give way.
The structure reveals a retest of the upward trendline under a descending resistance channel, suggesting a possible corrective pullback before resuming downside pressure. If price fails to sustain above 0.9160, a decline toward 0.9111 or lower remains likely. Market structure favors a bearish continuation as long as the pair trades below the descending red trendline.
Current Bias
Bearish – Price is testing the lower end of its recent consolidation and risks breaking down toward 0.8950.
Key Fundamental Drivers
AUD Weakness: RBA’s cautious tone and China’s slower growth outlook weigh heavily on the Australian dollar.
CAD Strength: Stronger-than-expected labor market data and oil resilience underpin CAD.
Commodity Flows: Oil boosts CAD, while iron ore softness limits AUD upside.

Lingrid | AUDCAD Key Swap Level Shorting OpportunityFX:AUDCAD recovered from its double-bottom formation near 0.9063, pushing back into the swap zone around 0.9160 after breaking the short-term resistance. The structure reveals a retest of the upward trendline under a descending resistance channel, suggesting a possible corrective pullback before resuming downside pressure. If price fails to sustain above 0.9160, a decline toward 0.9111 or lower remains likely. Market structure favors a bearish continuation as long as the pair trades below the descending red trendline.
⚠️ Risks:
A sustained breakout above 0.9160 could invalidate the bearish outlook.
Stronger Australian employment or CPI data may fuel short-term upside volatility.
Broad CAD weakness tied to oil price drops could trigger unexpected rallies .
If this idea resonates with you or you have your own opinion, traders, hit the comments. I’m excited to read your thoughts!

AUDCAD anticipating bullish moveMy bias on this pair remains bullish. Price reacted very good to that resistance area, creating fractal structure and providing us with a retracement. This allows us to get into long positions at a discount.
What I want to see now , is some bullish reaction to 1 of the highlighted areas. I believe we will see a deeper retraction to 1 of the order blocks (yellow), but it's possible that price won't get past 1 of the support areas (green).
Either way, I want to see bullish structure on the lower TF's before I go long on this pair.

Audcad Hi guys. I think the price has a correction in the Audcad and the pice is failure to return (FTR) and the market will be bullish.

AudCad Sell IdeaI'll try to be more consistent with these. I currently shorted Audcad with price still being overall bearish on the higher time frame. Once price got to the level I wanted to see get retested I waited on price to change directions to confirm the overall bearish trend to continue. Looking for a 1:3rr set up on AudCad. We'll see what happens.


AUD/CAD BULLS ARE STRONG HERE|LONG
Hello, Friends!
We are going long on the AUD/CAD with the target of 0.917 level, because the pair is oversold and will soon hit the support line below. We deduced the oversold condition from the price being near to the lower BB band. However, we should use low risk here because the 1W TF is red and gives us a counter-signal.
Disclosure: I am part of Trade Nation's Influencer program and receive a monthly fee for using their TradingView charts in my analysis.
✅LIKE AND COMMENT MY IDEAS✅

13.10.25 Morning ForecastPairs on Watch -
FX:AUDNZD
FX:AUDCAD
A short overview of the instruments I am looking at for today, multi-timeframe analysis down to what I will be looking at for an entry. Enjoy!

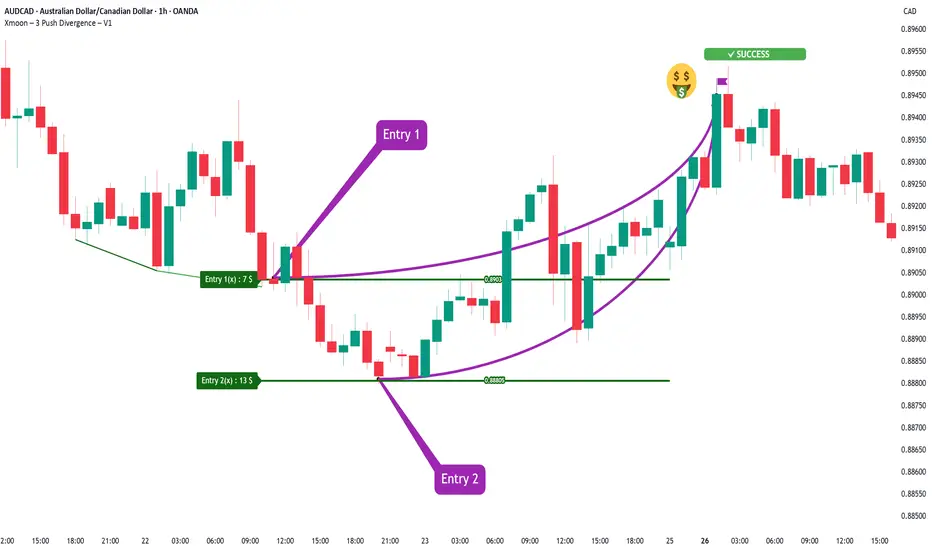
Xmoon Indicator Tutorial – Part 3 – Step Entry (DCA Entry)📘 Xmoon Indicator Tutorial – Part 3
🎯 Step Entry (DCA Entry)
Step-by-step entry, also known as DCA (Dollar Cost Averaging), is one of the key parts of the Xmoon – 3 Push Divergence strategy.
🔹 Why is it important?
After a 3 Push Divergence pattern appears, the market usually doesn’t reverse immediately.
It often moves a bit further in the same direction before turning back.
If we put all our capital in at once, the risk of liquidation increases.
🔹 The solution
We split the capital into several parts and enter the market step by step:
✦ If the market doesn’t reverse from Entry 1 , the chance of reversal at Entry 2 is higher
✦ If it doesn’t reverse from Entry 2, the chance at Entry 3 increases even more
✦ And so on — with each new step, the probability of reversal grows
Benefits of step entries:
✅ Lower overall risk
✅ Higher win rate
✅ Positions reach the Risk Free point faster
📣 If you have any questions or need guidance, feel free to ask us. We’d be happy to help.
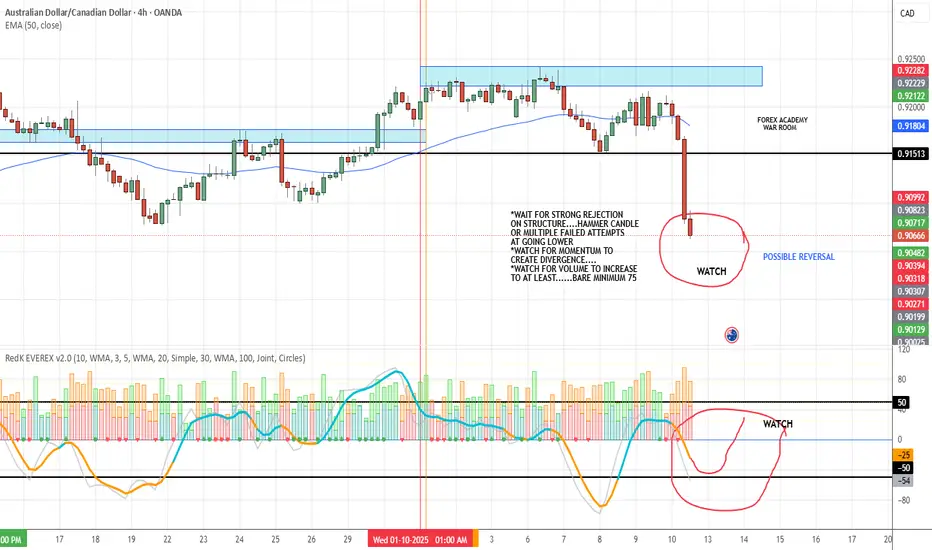
AUD/CAD – Reversal Setup Watch (4H Chart)AUD/CAD just made a strong move down, but instead of reacting, I’m observing the chart closely for a possible divergent reversal setup. This is not a trade entry—this is a watchlist note based on what would qualify as a potential long.
Key Conditions I'm Watching For
✅ Momentum divergence developing—momentum is high but starting to tilt downward
✅ Rejection pattern such as:
A hammer candle
Multiple failed attempts to go lower
Strong wick showing price rejection
✅ Volume must be at least 75+ to validate the shift
✅ Structure must align with the idea—price should show hesitation at the lows, not continuation
Chart Notes
This chart currently shows:
2 documented losses—included for transparency and improvement (1 provided a valuable lesson to be applied in all future trades)
Final Thoughts
This is a high-potential scenario developing, not a confirmation to enter. My strategy requires multiple layers of alignment before committing to any trade. I’ll continue monitoring this pair for a setup that meets all conditions.
If it comes, I’ll be ready. If not, I wait.


AUDCAD short Looks like AUD weakness all across the board is coming into play.
A ITA CURRENTLY IN A DOWN TREND
it is creating a continuation pattern which is a chance to enter the downtrend
