AUDCAD
AUDCAD recently broke below the ascending structure and extended lower. Price is now retesting the 0.9163 – 0.9172 zone, which acted as previous support.
🔽 Bearish case: Rejection here could confirm the retest and send price back towards 0.9136 and 0.9129.
🔼 Bullish case: A strong break and hold above 0.9172 may signal recovery and open room back into 0.9200+.
📌 This retest zone will decide if sellers maintain control or if bulls regain momentum.
⚠️ For educational purposes only, not financial advice.
Trade ideas

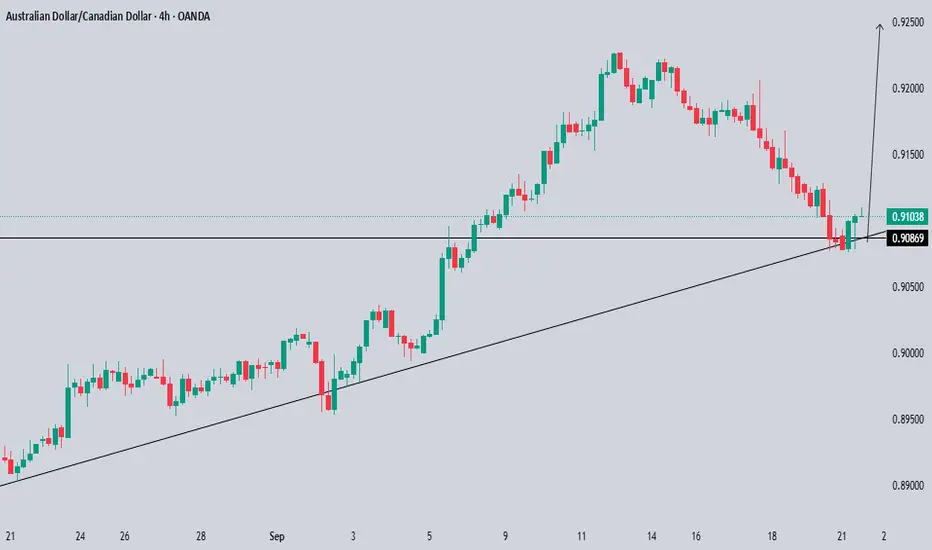
AUDCAD longAustralian economy is in a better position than the Canadian economy. Nothing seems to be rolling for Canada.
On Monday, the BoC cut rate by 25 bps which was already priced in... no surprise there. We had some pretty dovish comments from Governor Tiff Macklem. He highlighted concerns over the softening labor market and noted that while no forward guidance was offered, the bank would assess risks over a "shorter horizon than usual." Markets left the meeting continuing to price around 20bps of further cuts by year-end.
The August CPI report reinforced the BoC's dovish case. Headline inflation printed slightly below forecast at 1.9% Y/Y (vs. 2.0% exp.)
July Retail Sales data pointed to a weakening consumer. While the headline -0.8% M/M print was in line with expectations, the core ex-autos figure fell by a larger-than-expected 1.2%.
August Housing Starts fell to 245.8k, well below the 277.5k forecast, signaling a slowdown in the housing market and adding to the picture of a cooling economy.
GDP growth surprised to a contraction of -0.1% m/m (forecast +0.1%). It was the third month in a row in contraction.
Canadian employment slumped for a second month in a row with a loss of 65.5K jobs (forecast +4.9K)
Anyways, I could go on and on. As for the Australian economy, it is pretty resilient, but we had a bad job number last week with a surprised loss of 5.4K jobs.
So here what is my thinking, We are getting into a nice pullback zone. Risk was a bit off with the strength of the USD and the US Yields. Friday, CAD was the best performing currency even after some pretty bad retail sale numbers that came out during the session. I can't figure out why the CAD pushed up, but I still have a bearish outlook on the currency.
Technically we are coming back to the top of the 4 months consolidation zone. We will have to keep an eye on market sentiment. If the USd keeps grinding higher on a ''somewhat'' hawkish Fed and some pretty good data release for the US economy, the AUD could keep pushing lower. I still expect a technical bounce from the level.
Good luck and please monitor the market sentiment... this is what will push the pair in the right direction.
Good luck

AUDCAD-bullish ideaAUDCAD is in bull run as it has broke out from desending channel at retracement of 0.5-0.6.

AUDCADTechnical Analysis
Trend: Market is in a bullish channel. Price is respecting higher highs and higher lows, so structure favors buyers.
Momentum: Current candles show consolidation near the channel top, suggesting a pause rather than a reversal.
RSI: Showing mild bearish divergence → momentum is flattening, which often means price may retest lower channel or support before continuing up.
Multi-Timeframe:
1H → Bullish.
4H → Sideways with bullish tilt.
Daily → Bullish, which supports continuation.
📌 Trade Plan Logic
Bias: Strong bullish (fundamental + technical alignment).
Strategy:
Wait for a dip/pullback inside the bullish channel to join buyers at better pricing.
OR, if price consolidates then breaks higher with momentum, treat it as a continuation entry.
Risk Management:
Place stops below the last swing low / channel floor.
Take partial profits at the next impulse push, let the rest ride.
Invalidation: A clean 1H close below the bullish channel = bullish plan is off the table.au


Sell AUD CAD M15Please do not trade solely on my analysis as it might be incorrect.
I encourage constructive feedback.
If you did trade, make sure the drawing is respected, don't use exact values as they might differ from a broker to another.
Check the news before trading - they my affect the analysis.
Explanations:
MIN - last minimum point
MAX - last maximum point
BOS - break of structure
SMS - shift in market structure
SL - stop loss
TP - take profit
RR - risk reward
OB - order block
OB (15) - order block (based on M15) timeframe

AUDCAD Technical & Order Flow AnalysisOur analysis is based on a multi-timeframe top-down approach and fundamental analysis.
Based on our assessment, the price is expected to return to the monthly level.
DISCLAIMER: This analysis may change at any time without notice and is solely intended to assist traders in making independent investment decisions. Please note that this is a prediction, and I have no obligation to act on it, nor should you.
Please support our analysis with a boost or comment!
AUDCAD Bullish setup based on Volume ProfileIn this chart we have a very interesting setup.
In this trending leg, we can see that the volume profile aligns with previous resistance.
My plan is to enter at the POC of the volume profile and then just exit at a 1:1.

#025: LONG AUD/CAD Investment Opportunity
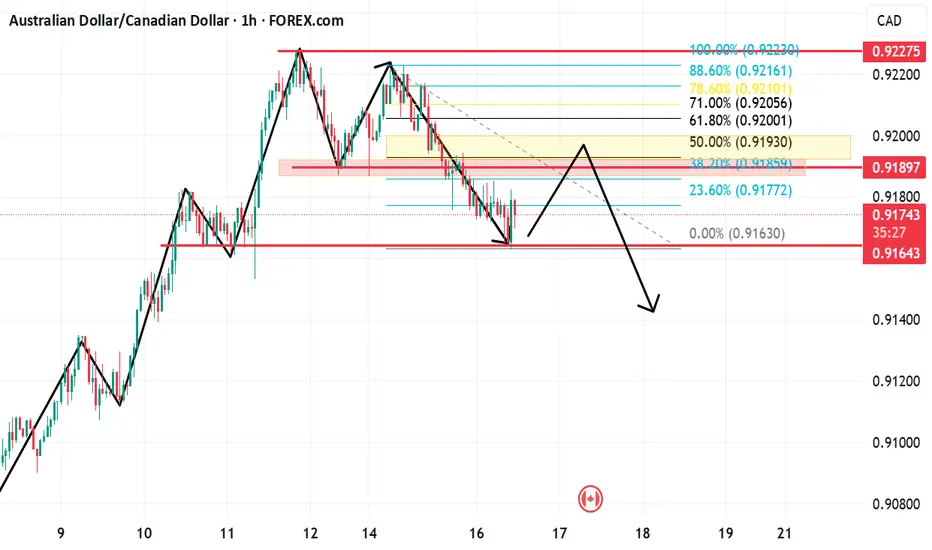
The AUD/CAD pair has experienced a period of marked weakness in recent weeks, with a sequence of lower highs and lower lows that has consolidated a medium-term bearish trend. However, the latest developments on the H4 chart show the emergence of signals that deserve attention. Hello, I'm Andrea Russo, an independent Forex trader and prop trader with $200,000 in capital under management. Thank you in advance for your time.
🔍 Technical Analysis
After the decline, a key support area can be seen around the psychological threshold of 0.9100, where prices have slowed the bearish pressure.
Momentum indicators (RSI and MACD) show an oversold condition accompanied by a bullish divergence, often a prelude to a technical reversal or at least a pullback.
The latest H4 candles signal the entry of buying volumes, with a consolidation pattern that could transform into a rebound phase.
Australia remains exposed to a moderate economic cycle, but the recent decline in energy commodities has reduced the relative strength of the CAD, which is closely correlated with oil prices.
The Bank of Canada maintains a dovish tone, but the latest macroeconomic data shows signs of an economic slowdown that have dampened the Canadian currency's momentum.
Conversely, global risk sentiment appears to be improving, a factor that tends to favor cyclical currencies like the AUD.
In this scenario, AUD/CAD could begin a pullback phase from recent lows. The natural target lies in the nearest resistance areas, while the holding of current support remains the key to the validity of this scenario.

AUDCAD Price Forecast – Structural Shift in MomentumAUD/CAD has recently completed a strong trending phase, characterized by a well-defined upward channel with consistent expansions. The sequence of price action showed clear momentum as each retracement was absorbed and followed by renewed buying interest, maintaining structural order throughout the move.
However, the latest developments reflect a notable shift in behavior. After a prolonged climb, price is showing signs of losing momentum, with market structure shifts (MSS) indicating that control is gradually transitioning. This suggests that the market is entering a phase of rebalancing, where prior bullish momentum may give way to corrective activity.
The projection implies that the pair could be preparing for a deeper adjustment, where short-term liquidity cycles reset positioning before a more sustainable trend emerges. This type of rotation is natural after extended directional moves and often signals the beginning of a new phase rather than immediate continuation.
Overall, AUD/CAD is transitioning from strength into a corrective cycle. While the broader market has proven its ability to trend effectively, near-term behavior suggests that the focus will be on how efficiently the market absorbs this correction before defining the next directional phase.

AUDCAD - The next Big Short?AUDCAD is surging on a combination of Gold reaching new highs and Oil testing Quarterly lows affecting the AUD and CAD currencies respectively, each nations exports being closely tied to those commodities.
AUDCAD has been parabolically walking a bullish trend fan-line pattern with several attempts to test support.
All technical indicators are at historical overbought extremes with many trading programs feeling the impact of the previous weeks readings, many trapped participants exiting their positions to reduce their exposures.
Any strengthening of the US dollar will affect the AUD more so than the CAD and could act as the trigger of a sharp longer-term reversal. In the meantime there may be sharp and short bearish pullbacks to test support, so short-term opportunities exist.

Running deep blues AUDCAD a perfect imbalance fill. Now we going for the swing high. Plan, Excute, Wait (Patience pays)

AUD BIASAUDCAD has broken down from the triangle structure after consistent lower highs. Price is now testing the support zone between 0.9163 – 0.9136.
🔽 Bearish bias remains while price stays below triangle resistance.
🟨 Support zone: 0.9163 / 0.9136 – key demand area to watch for reaction.
📌 If buyers defend this zone, we could see a corrective bounce back into 0.9180+.
📌 A clean break below 0.9136 may extend bearish momentum towards 0.9100.
⚠️ For educational purposes only, not financial advice.

AUDCAD SELL POSITION We're anticipating a bearish momentum, Price formed a double top, broke its neckline and retested it as a clear sign that its selling hard

AUDCAD — Holding > 0.91477; Stay bullishChronex | AUDCAD - Bullish - Conviction - Medium | buy pullbacks
Structure: Bullish
Market Phase: Extension
Orderflow: Bullish
Daily: Bullish
H4: Bullish
H1: Bullish
Liquidity: Target IRL then ERL
Entry Model: Chain
Follow for timely Signals and Setups
What would make you stand aside today?

Double Top formation on AUDCAD - Risky, okay?Price made a strong rally on AUDCAD, climbing aggressively.
But now, we’re spotting a possible Double Top formation, two peaks at roughly the same level.
At first glance, this looks like a bearish setup.
But here’s the caution: in the context of such a powerful uptrend, a Double Top can be tricky.
Sometimes, it’s just a pause before buyers push even higher.
We can say that the neckline broke rather cleanly, with strong confirmation, but I don't see that much conviction yet from the sellers. Buyers could come back, and the uptrend continues. This is what makes it risky. Above, there’s a strong resistance zone, and that’s exactly where price could be heading next.
So, don’t jump in too early.
Because fading a strong trend is always risky business… or should I say risky biscuit?

What are your thoughts for for AUD/CAD!I am still new to trading. I'm using 1H time frame for my analysis then going down to 15m for my entry. Here I drew up Highs and lows, As for me, I see a potential bearish coming. If price pulls back into any on my markings, especially the my golden zone, then I'll look to sell with my TP1 at the first support, and if it breaks, then TP2 to second support.
Please let me know if I'm on the right track with this analysis. I'm trying to focus and come up with a plan to stay consistent. I'm using price action style, with highs and lows.
Thank you and God Bless!

"AUDCAD – Double Top Formation: Potential Reversal in Play"The chart is showing a classic Double Top pattern, which is one of the strongest bearish reversal signals in technical analysis.
Pattern Structure
Price formed two peaks near the same resistance zone, indicating strong selling pressure at that level.
The neckline is established at the recent support area where both peaks pull back.
This structure signals that buyers have failed twice to break higher, increasing the probability of a downside move.
Market Psychology
The first peak reflects buyers testing resistance.
After the pullback, buyers attempt another push but fail to create a higher high.
This failure confirms weakening bullish momentum and gives control to sellers.
Trading Plan
A confirmed break below the neckline support strengthens the bearish bias.
Entry can be planned after a clear close below neckline or a retest rejection.
Stop Loss: above the second peak.
Target: projected by measuring the height of the Double Top and extending it downwards from the neckline.
Risk Management
Position sizing must respect account risk (1%–2% rule).
Avoid chasing the move; wait for confirmation to avoid false breakouts.
Final Note
This Double Top on AUDCAD signals a potential trend reversal from bullish to bearish. However, always confirm with additional confluences (EMA trend filters, volume, RSI divergence) before execution.

AUD/CAD Support at 0.9170 – Buyers Ready to DefendAUD/CAD has a key support at 0.9170, created by a heavy volume cluster where buyers accumulated longs during a pause in the uptrend. This zone aligns with the beginning of a fair value gap, making it a strong technical confluence. On a pullback, I expect buyers to defend this area, creating a solid long opportunity.

AUDCAD M15The AUD/CAD pair remains in a strong uptrend. If the price reaches the identified support zone and receives candlestick confirmation, I expect the bullish trend to continue.

Audcad going for a sell tomorrow Starting from daily time frame it says we are on a down trend and we are running back for that liquidity sweep I marked out the high level of the liquidity and marked out the buyside liquidity and went to four hour timeframe marked out my FVG waiting for the confirmation a one full candle stick that closees right below our retracement..then we hit a sell🔥🔥📈💰🛬

AUD/CAD Daily AnalysisWith price having had a 5 day bullish run, we finally see a Doji candle print at the end of last week.
This could possibly mean that a correction is about to play out or possibly a top in the market.
Look for a trade that meets your strategy rules.
