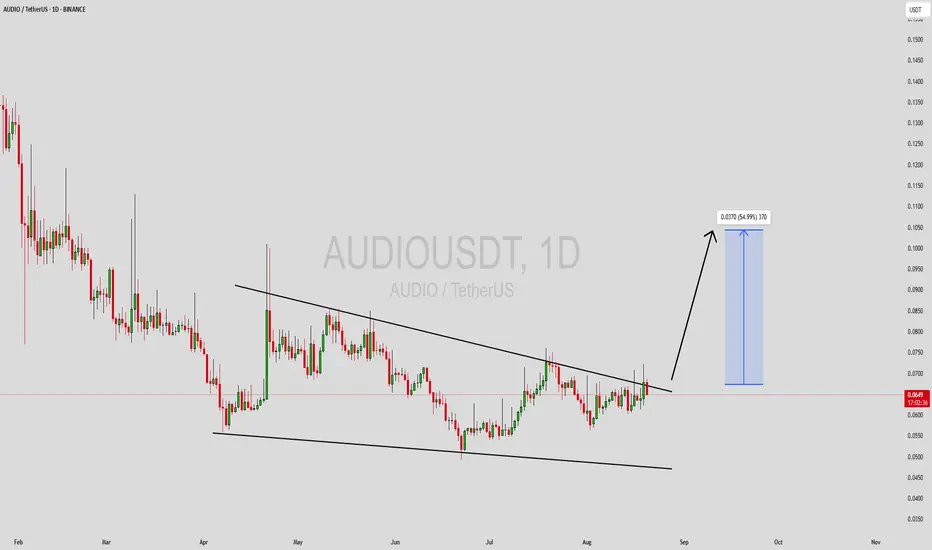
AUDIOUSDT Forming Falling WedgeAUDIOUSDT is currently forming a textbook falling wedge pattern, a structure widely recognized for its bullish reversal potential. After a prolonged downtrend, the price appears to be finding strong support near the lower boundary of the wedge. This tightening formation, coupled with decreasing vola
AUDIO/USDT 4H Technical AnalysisAUDIO/USDT 4H Technical Outlook
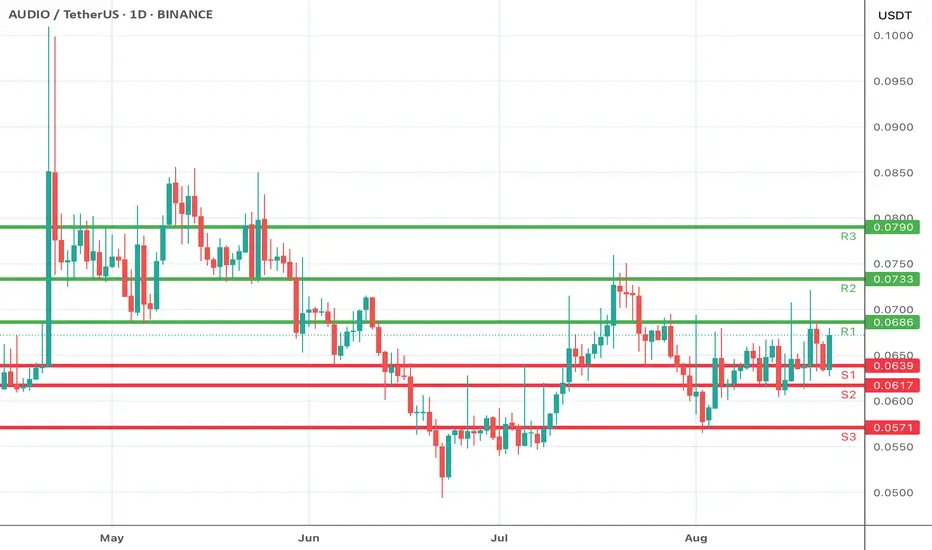
AUDIO is consolidating within a defined range. S1 and S2 act as immediate downside levels where buyers may attempt to hold the price, while a deeper pullback could test lower supports. On the upside, R1 and R2 serve as resistance barriers that must be cleared for bull
AUDIO Breakout Alert: Parabolic Move Loading?SEED_DONKEYDAN_MARKET_CAP:AUDIO has successfully broken above the long-term descending resistance line, signaling a strong shift in momentum. However, the price is currently facing rejection from the upper marked resistance zone.
If AUDIO manages to close decisively above this zone, it could trigg

channel patternWith this volume of buying in this cryptocurrency, I expected it to be able to hold the box, but it seems to be moving like a descending channel, we still expect a rise after completing the head.

#AUDIO Bulls Getting Ready for a Massive Bull Wave | Key LevelsYello Paradisers! Are you keeping an eye on #AUDIOUSDT or not? If not, you might want to start now because #Audius is showing some textbook Elliott Wave patterns that could signal either a massive breakout or a steep drop:
💎Currently, #AUDIO is in a corrective phase following its five-wave impulsiv


$AUDIO CUP AND HANDLEa bullish cup and handle on a lagging coin means only one thing right?
audio has broke out of the downward trend line on the handle and has retested but still indecisive of true direction

AUDIOUSDT 1WAUDIO ~ 1W
#AUDIO If you still have Conviction on this coin,. This support block would be a very good buying place for now,. with a minimum target of 20%++

AUDIOUSDT Long-Term Accumulation StrategyI would like to share a long-term accumulation strategy for AUDIOUSDT that I've been eyeing.
Chart Patterns and Indicators:
Descending Channel: The price is currently moving within a descending channel, indicating potential breakout opportunities.
Harmonic Pattern (XABCD): The pattern suggests pote

AUDIO / USDT : poised for breakout ?Audio/USDT: Poised for Breakout?
Audio/USDT is approaching a key trendline resistance level. A successful breakout could ignite a significant upward move. Key factors to watch:
* Trendline Resistance: Audio/USDT is nearing a critical trendline that has previously capped price action.
* Volume: Inc

See all ideas
Summarizing what the indicators are suggesting.
Oscillators
Neutral
SellBuy
Strong sellStrong buy
Strong sellSellNeutralBuyStrong buy
Oscillators
Neutral
SellBuy
Strong sellStrong buy
Strong sellSellNeutralBuyStrong buy
Summary
Neutral
SellBuy
Strong sellStrong buy
Strong sellSellNeutralBuyStrong buy
Summary
Neutral
SellBuy
Strong sellStrong buy
Strong sellSellNeutralBuyStrong buy
Summary
Neutral
SellBuy
Strong sellStrong buy
Strong sellSellNeutralBuyStrong buy
Moving Averages
Neutral
SellBuy
Strong sellStrong buy
Strong sellSellNeutralBuyStrong buy
Moving Averages
Neutral
SellBuy
Strong sellStrong buy
Strong sellSellNeutralBuyStrong buy
Displays a symbol's price movements over previous years to identify recurring trends.