AUDIO/USDT Technical Analysis: Inverse Head & Shoulder PatternAUDIO/USDT Technical Analysis: Inverse Head & Shoulder Pattern Indicates 200% Potential Upward Movement
In the world of cryptocurrency, Audio (AUDIO) is currently trading at $0.37. Traders and investors are always on the lookout for potential breakout opportunities to earn profits. In this technical analysis, we will look at the Audio/USDT chart and identify a possible inverse head and shoulder pattern that could indicate a significant upward movement. However, it is essential to note that this is not financial advice, and investors should always conduct their research before investing in any coins.
Overview of Audio/USDT Chart:
On the Audio/USDT chart, we can observe a possible inverse head and shoulder pattern. This pattern is a bullish reversal formation that occurs after a significant downtrend. In this pattern, the left shoulder, head, and right shoulder create a shape that resembles a head with two shoulders. The neckline is formed by connecting the two valleys between the shoulders and the head. A breakout above the neckline indicates a potential upward movement.
Key Levels:
The support level for Audio is at $0.25, while the resistance levels are at $0.42, $0.72, and $1.21. The critical level to watch out for is the neckline resistance at $0.40-$0.42.
Technical Analysis:
Currently, Audio is forming an inverse head and shoulder pattern on the chart. The trend line resistance has already been broken, which indicates a bullish trend. However, a breakout above the neckline resistance at $0.40-$0.42 is crucial for confirming the pattern. If Audio breaks out above this level, it could potentially see a 200% upward movement from the current price.
Takeaways:
Audio is currently forming an inverse head and shoulder pattern on the chart, which is a bullish reversal formation.
The neckline resistance at $0.40-$0.42 is a critical level to watch out for.
A breakout above the neckline resistance could potentially indicate a 200% upward movement.
The support level for Audio is at $0.25, while the resistance levels are at $0.42, $0.72, and $1.21.
Conclusion:
In conclusion, the Audio/USDT chart is showing a possible inverse head and shoulder pattern, indicating a potential upward movement. However, investors should always conduct their research and analysis before investing in any coins. The support and resistance levels mentioned in this technical analysis should be used as a guide to making informed investment decisions.
Follow us for More Quality Content.
Thank you.
Trade ideas

AUDIO/USDT🔵🐇 #Audio/USDT
🪄Audio Position Based On Fresh Liquidity and Order Blocks and Structures
📍as you can see we had a strong bullish structure and now we are close to a fresh liquidity level and main support , so we can consider this area for a short term bullish move
#eth #btc #bitcoin #ethereum #cryptocurrency #crypto #Trade #trading #Invest #Trader #Signal #forex #Scalp #altcoins #chart #RTM #ICT
@aliceinmoneyland

Audio breakout has confirmed now it will fill the gapAUDIO LONG
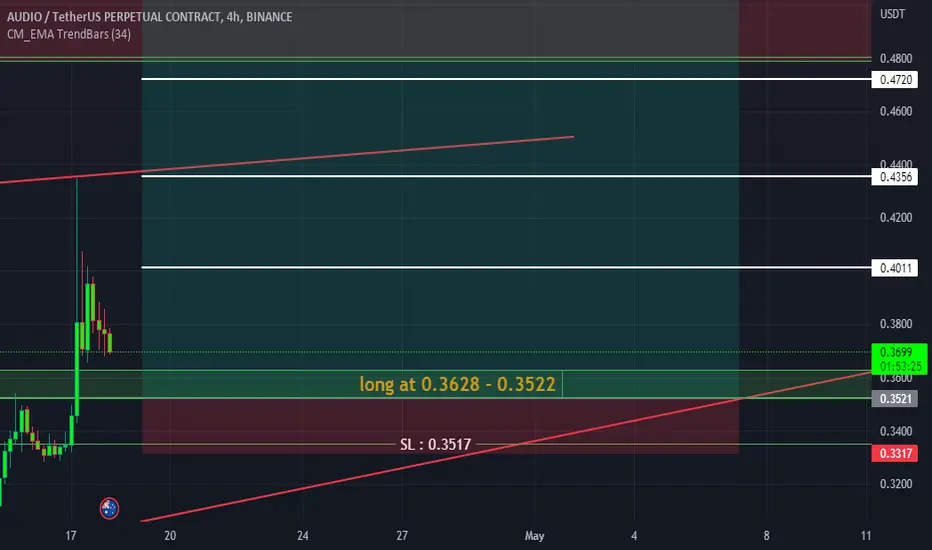
Hello Guys. Check out the Audio buying setup. Audio breakout is confirmed but we have a strong chance to catch a Almost 40% profit. it will defiantly fill the fear value gap and that point you will enter and sit in Rocket. it may take more than a week to achieve our last target but it will achieve for sure.
Entry: 0.3628 - 0.3522
Stop loss: 0.3517 (6.36% Loss)
Target 1: 0.4011 Spot (14.27% Profit) Future 20x Leverage (285.4% Profit)
Target 2: 0.4356 Spot (23.56% Profit) Future 20x Leverage (471.2% Profit)
Target 3: 0.4720 Spot (33.72% Profit) Future 20x Leverage (674.4% Profit)
Target 4: 0.5117 Spot (45.15% Profit) Future 20x Leverage (903% Profit)
This will make our week!
#AUDIO Wait for the trend to continueWhile returning to the range of 29 cents, the specified range can be the continuation of the currency target.
Because it is on the way to rise, it is preferable to have approval, it has an attractive priority for a long position.
also In the specified range of red color, you can look for a short trade.

Audio Target ReachedTraders,
Just wanted to let you know that if you are still in this trade, Audio has reached and exceeded it's final target. Congrats to all those who were ballzy enough to hodl to the target (I wasn't).
Stew

AUDIO/USDT Long 0.3906Long based on cup and handle, stop loss below support and target is at a fib retracement.

AUDIO USDT TODAYPLZ DO NOT SELL MY SIGNALS
1-Apply your own risk management.
2-Daily and Weekly Targets
3-Hunt the profits at any level you see convenient for you.
4-Green Zone for entry,
5-Red Level Exit by OCO
6-Yellow levels are targets.
have a good day guys.

AUDIOLong-term accumulation is happening now. Potential outcomes if the Bulls are successful from the current price at 0.45 is 27X @ 2.618 and 37X @ 3.168.

Audio on the go...42% profit in just 15 mins with our 7-star buy and sell indicator
to get access to our indicator send me a message

$audio- scalp waiting for a break of yellow line then stop tad underneath it
target line above or range high
scalp good to hodl too till .59 possibly
Cz spoke about this a while ago and am sure he ain't forgotten it...
44444444444444444444444444444444444444444444444444444444444444444444444444


AUDIO/USDT🔵🐇 #AUDIO/USDT
⚠️Caution : its inverted chart
🪄 AUDIO Has a Bullish Structure on bigger view
- We have a fresh liquidity zone around +0.52 and the target of structure is around there too
- but we can retrace around 0.2 - 0.15 before main bullish move or we can remain bullish
- the bigger structure is more reliable for me and DCA is a good decision for me
- it's a midterm view
- it's not a financial advice
- its just a structure not a signal with R/R
- there are a lot of bullish structures for midterm view in crypto market right now and i will share them with you
#Audio #Auidus #eth #btc #bitcoin #ethereum #cryptocurrency #crypto #Trade #trading #Trader #Signal #forex #Scalp #altcoins #chart #RTM #ICT

TRADE ALERT - LONG AUDIO Traders,
After beating the 50-day moving average, and a level of support above that, we are now resting on support. I think this is the perfect time to enter here in audio. And that is what I did. My goal is to at least hold some of this trade to the 39 cent level.
In a future post, I will update you on all the stop limits of this and my previous trades.
Stew

AUDIO broke Trendline ResistanceAUDIO broke Trendline Resistance
Wait for Proper retest confirmation for Bullish Continuation

Audio/USDT🐇Audio/USDT
⚠️⚠️Caution : its inverted chart
🪄 Audio in daily time frame looks bullish ! there is a fresh liquidity area around 0.18 - 0.15
But In Bigger View Target Of This Structure is + 0.5 !
NFA
#Audio #Auidus #eth #btc #bitcoin #ethereum #cryptocurrency #crypto #Trade #trading #Trader #Signal #forex #Scalp #altcoins #chart #RTM #ICT

AUDIOUSDT 2H HR MTAUDIO has started the first upward wave and after correcting to the 618 Fibonacci area, it should continue to move up to 1.27 Fibo.

AUDIO 19% upside moveTargeting the low volume nodes to be filled on the audio price chart with a 2:1 risk to reward ratio.

Audius with a potential breakout!Traders,
Audius looks to be breaking out to the upside here. As reviewed in my previous altcoin video, we were in a bullish descending wedge. I wanted to see both a break above the topside of our descending wedge as well as a break above that level of resistance at .276 cents. Those two criteria have been met. So finally, I'd like to see a confirmation on the daily. We need to see a close above .276 and another candle both opening and closing above that same price. This would confirm the break.
Now, to look for entry.
Often after a breakout, price comes back to retest the upperside previous resistance. In this pattern, this ends up being the topside of our descending wedge. Once touched (after confirmation), this is where I would be looking to enter this particular trade.
One thing I don't like, is that 50 day ma above us. This may dis-sway my enthusiasm in this trade a bit.
Stay tuned. I will post if/when I do. Along with potential targets and SLs.
Best,
Stew

Long Setup After Meaningless Sell OffBYBIT:AUDIOUSDT.P
The all info is in the chart why we plan long setup...
After 0.26 level we will be ready to search for bullish price action signal.
When we see it do not hesitate to execute it with a logical risk reward plan.
May the force be with you...


Audio Is Ready To Make Some NoiceHere Is My Study On Audio.
This analysis is for informational purposes only and should not be considered financial or investment advice. The information presented in this analysis is based on my own research and is subject to change without notice. The analysis is not a recommendation to buy or sell any specific cryptocurrency Stocks Or Forex, including This Pair. Please conduct your own research and consult with a financial advisor before making any investment decisions.

Audio Still Looking Good To Continue Its Uptrend Getting Ready For Massive Breakout
forming descending broadening wedge in daily timeframe incase of breakout expecting 200 to 220% bullish move

BULLISH PATTERN ON AUDIOBULLISH SHARK PATTERN CAN BE confirmed once it touched the fib level and complete the 1.618 retracement level.
