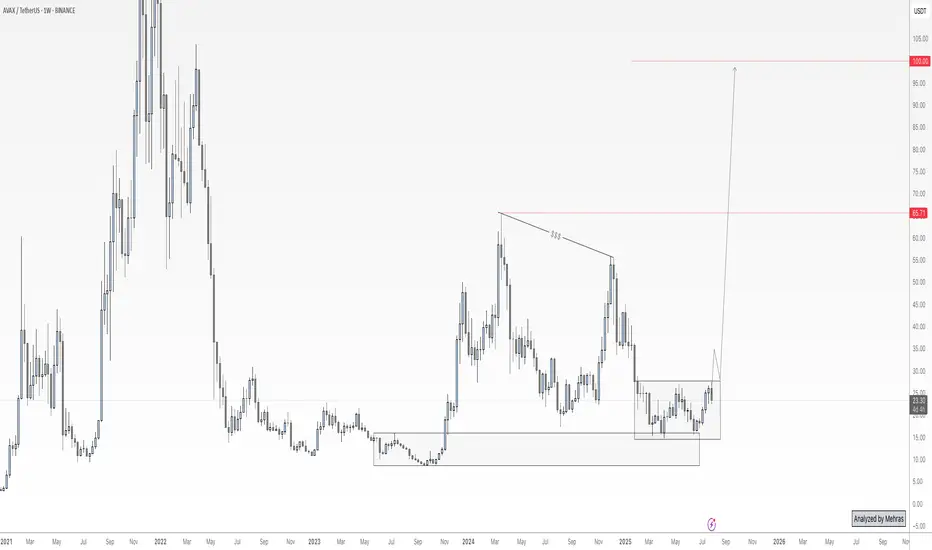
AVAX 4H Holding Above Golden Pocket SupportAVAX is holding above short-term ascending support after rebounding from the 0.5–0.618 Fibonacci retracement zone. The highlighted golden pocket aligns with a prior demand zone, adding confluence for bulls. A break below $22 could open the door to deeper retracement toward the 0.786 level at $19.23, while holding here could set up another push toward $25+.
AVAXUSDT.3L trade ideas
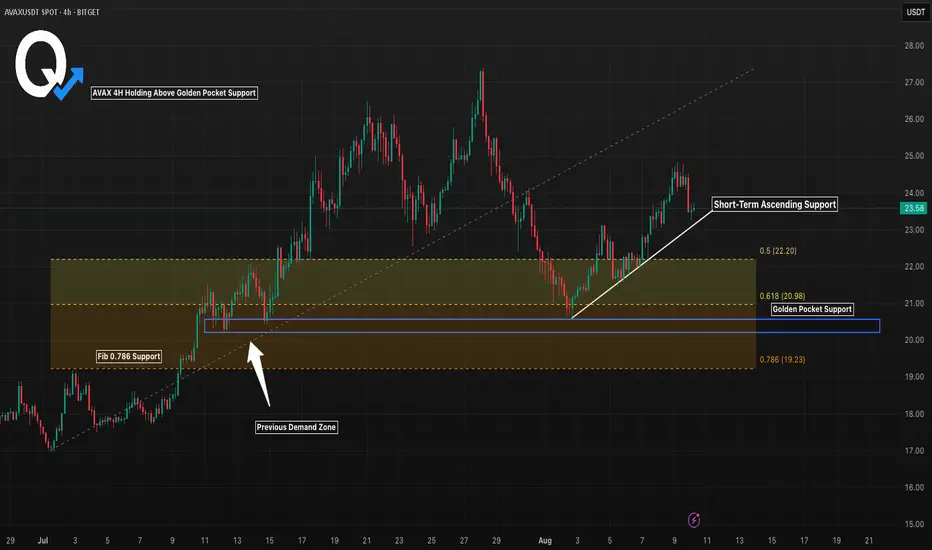
AVAX Long Only | Moving Average Trap Heist in Action🧨“Avalanche Crypto Vault Break-In 💣 | Thief Trader’s Long Playbook”⚔️💸🚀
(AVAX/USDT Crypto Heist Plan – Swing/Day Trade Blueprint)
🌍 Hi! Hola! Ola! Bonjour! Hallo! Marhaba! 🌟
Welcome, Money Makers, Market Pirates, and Chart Snipers! 🤑💰💼✈️
This ain’t just another setup — this is a strategic crypto ambush on AVAX/USDT, cooked up with the 🔥 Thief Trading Playbook 🔥. We're planning a clean, no-fingerprint heist into the Red Moving Average Zone. That’s the liquidity vault, and yes — the police (market makers) are watching 👮♂️🚨... but so are we. Stay sharp. 💼🔦
💥 Mission Objectives:
🎯 Entry Point (The Infiltration Point)
"The vault's wide open! Swipe the Bullish loot at any decent price" 📈
Smart thieves wait for pullbacks on the 15m or 30m chart to plant their limit orders near swing lows/highs. Use layered orders (DCA style) to scale in like a pro. 💣🔁
🛑 Stop Loss (Your Getaway Exit)
Secure your trade. SL at the nearest wick low/high on the 1D timeframe (around 21:00 candle).
Your SL = your personal risk code. Choose it based on lot size & how deep you're inside the vault. 🎭🚫
🏴☠️ Take Profit Target (The Treasure Room)
🎯 Target: 28.00 USDT
...or escape early if the heat (volatility) gets too intense. Protect the bag. 💼💰
⚡ Special Note for Scalpers:
🧲Only operate on the Long Side.
If you’ve got deep pockets, smash in directly. Otherwise, ride with swing bandits. Use trailing SL to secure stolen profits. 🧨📉📈
🔍 Market Heat Map & Rationale:
The AVAX/USDT setup is flashing bullish strength, backed by:
🧠 On-Chain Metrics 📊
💡 Market Sentiment
📰 Macro Catalysts
🌐 Intermarket Synchronicity
📡 Go grab the full breakdown on:
⚠️ Red Alert: News Zones Ahead! 📰🚫
Avoid fresh trades during high-volatility news releases.
Lock in gains with trailing SL. Risk management is not optional — it’s the escape vehicle. 🚗💨
📝 Legal Talk (Don’t Skip):
This isn’t investment advice. Just a well-planned blueprint from a market thief.
You're responsible for your own loot and losses. 🎭📉📈
❤️ Boost the Brotherhood 💥
Smash the 🔥BOOST BUTTON🔥 if you found value.
Every boost powers our Thief Trading Gang’s next big score. 🚀💸
Stay tuned for the next heist plan. I’ll be back with more charts, more loot, and less mercy. 🐱👤📊💥
avaxusdtThe Avaxusdt is in the two areas, one of the supports is 618, the corrective wave before, and one is dynamic support. If supported, it can rise to 0618.

AVAX/USDT Long Opportunity – Bullish Setup Developing!AVAX is currently forming a potential bullish reversal on the 4H timeframe. Price recently bounced off the strong demand zone between $20.70 – $21.35, where previous support held and buyers stepped in aggressively.
🔍 Technical Breakdown:
Support Zone: $20.70 – $21.35 (Strong demand zone highlighted in orange)
Current Price: $22.10 (slightly above support, indicating bullish interest)
First Target (TP1): $24.01 (minor resistance and previous structure level)
Second Target (TP2): $26.25 – $27.00 (major supply zone; high probability reaction area)
✅ Confluences:
Clean bullish structure forming off demand zone
Volume profile (LuxAlgo VRVP) supports the bounce
Higher low confirmed on the 4H
Strong imbalance above, price likely to fill it
📌 Trade Idea:
If momentum continues and price stays above $21.35:
Entry Zone: $21.90 – $22.20 (current range)
SL: Below $20.70 (beneath demand zone)
TP1: $24.01
TP2: $26.25+
🧠 Notes:
Watch how price reacts at $24.01; breaking this confirms bullish strength.
The $26.25 area is a historical supply zone, so consider partial profits here.
Maintain good risk management; crypto remains volatile!
🟢 Bias: Bullish

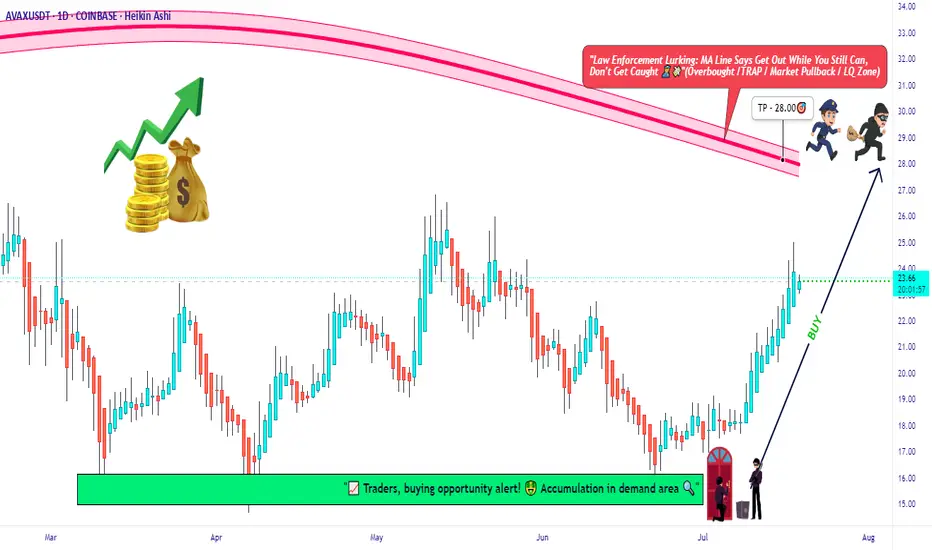
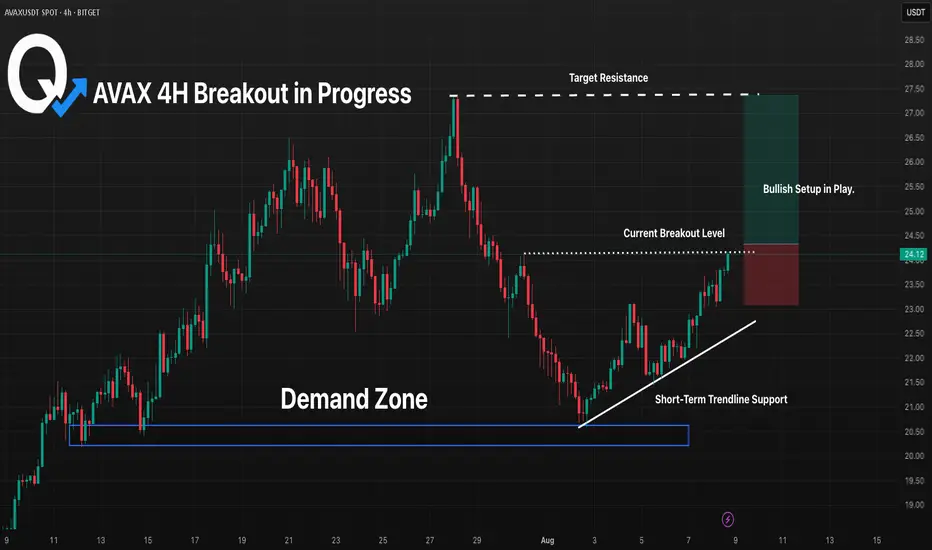
AVAX 4H Breakout in Progress, Will Bulls Push Toward July Highs?AVAX has broken above short-term resistance around $24, with buyers showing strength off the trendline support. The setup points toward the July highs near $27 as the next major target if momentum holds. A sustained close above $24 could confirm bullish continuation, while a failure to hold would shift focus back toward the $21 demand zone. The risk-to-reward remains attractive for trend-following setups.
Buy Trade Strategy for AVAX: Tapping into High-Speed DeFiDescription:
This trading idea highlights AVAX, the native token of the Avalanche blockchain, known for its high-speed transactions, low fees, and scalable infrastructure. AVAX powers a robust ecosystem that supports decentralized finance (DeFi), NFTs, and Web3 applications, making it a strong contender in the competitive smart contract platform space. With its unique consensus mechanism and growing list of partnerships, Avalanche has attracted developers and users seeking efficient and eco-friendly blockchain solutions. The increasing adoption of AVAX in DeFi protocols, cross-chain interoperability, and institutional interest reinforces its long-term growth potential.
Still, the cryptocurrency market remains highly volatile, with AVAX’s price influenced by market sentiment, regulatory shifts, and broader economic conditions. Proper risk management and awareness of potential downsides are essential when considering positions in AVAX.
Disclaimer:
This trading idea is for educational purposes only and should not be taken as financial advice. Trading cryptocurrencies like AVAX carries substantial risks, including the possibility of losing your entire investment. Always conduct independent research, evaluate your risk tolerance, and consult with a licensed financial advisor before investing. Past performance does not guarantee future results.
AVAXUSDT – potential swing tradewith a risk factor of 2.59 Avax is ready to take an upward ride with a potential 50% fib retracement target at least.
Disclaimer: Not financial advice – just sharing my market outlook. Always manage risk and do your own research before taking trades.
💡 Educational Note: For sharper precision, drop to 4H or 2H charts and identify the latest ChoCH (Change of Character) and BoS (Break of Structure) before entering. This helps align with the momentum shift and avoid premature entries.

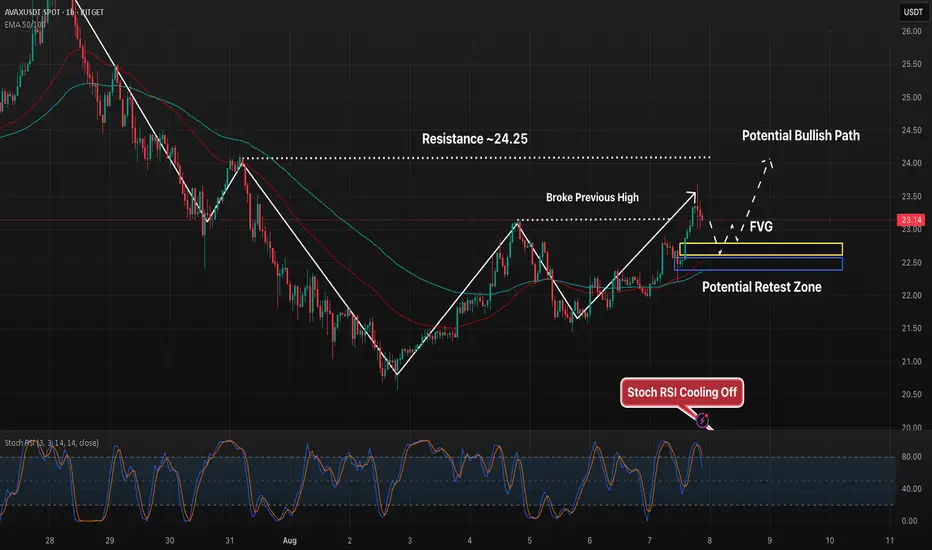
AVAX 1H – FVG Retest Lining Up, But Will 24.25 Cap the Move?Avalanche broke above a prior swing high and filled upside space before pulling back toward an unfilled Fair Value Gap (FVG) in the 22.8–23.0 range. This zone aligns closely with EMA support and prior structure, making it a key short-term decision point.
If buyers step in here, the next upside target remains the 24.25 resistance — a level that has capped price action in the past. A failure to hold the FVG zone could open the door for a deeper retrace into the 22.2–22.3 support area.
Key watchpoints:
– FVG retest at 22.8–23.0 for potential bounce
– Overhead resistance at 24.25
– Stoch RSI cooling off from overbought, allowing room for a fresh leg higher
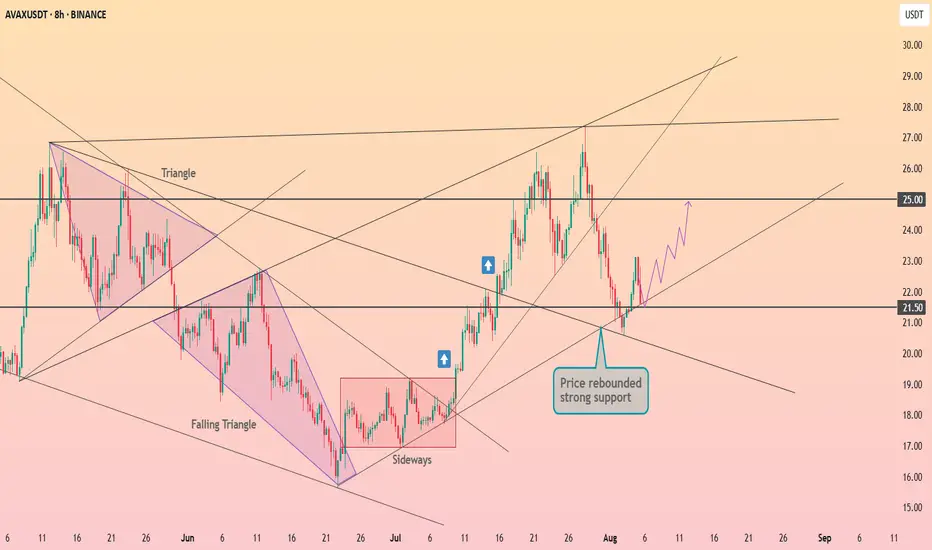
Avalanche will retest the $21.5 level ┆ HolderStatBINANCE:AVAXUSDT bounced sharply from the $21.50 support, confirming the level as a pivot zone. Previous breakout patterns remain intact, and the current price action indicates potential for a move toward $25.00 resistance if buyers maintain control.
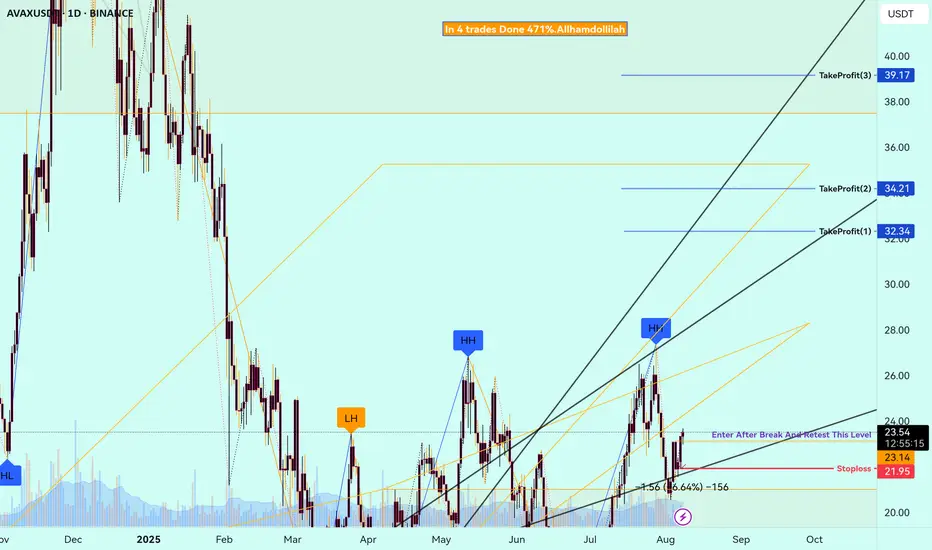
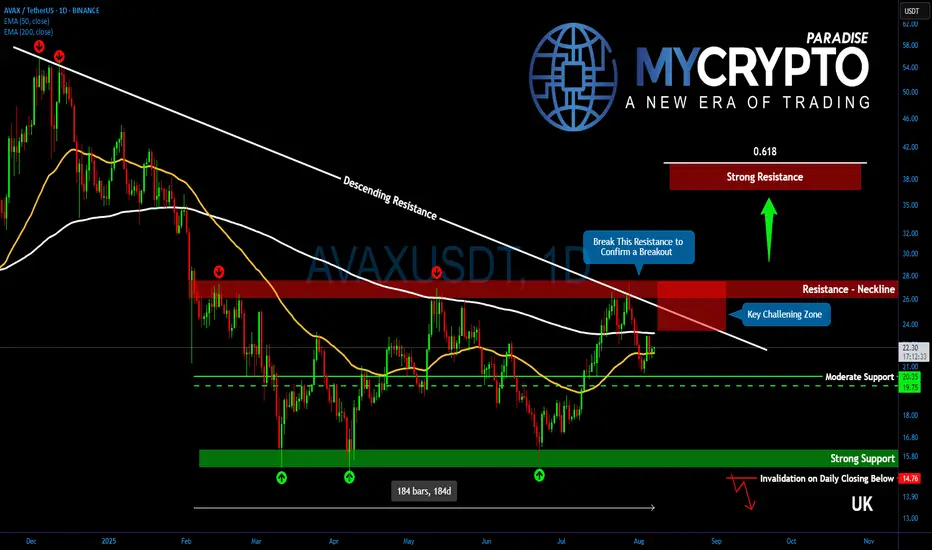
AVAX Has Been Quiet for Too Long! Don’t Miss What Comes NextYello, Paradisers! Have you been ignoring #AVAX because of its sideways chop? That might be a costly mistake, because what’s forming now could be the foundation of a major trend reversal that catches most traders completely off guard.
💎After an extensive downtrend, AVAX has been trading sideways for nearly 184 days, signaling the market is in accumulation mode. This long consolidation is beginning to take shape as a possible reversal base, and when it breaks, it could break hard.
💎Right now, #AVAXUSDT is battling a complex resistance zone between $23.50 and $27. This region is packed with overlapping technical barriers, many of which date back to December 2024, adding to its significance. It's a make-or-break zone.
💎Once $27 is broken with strong volume confirmation, the stage will be set for a powerful breakout, with upside potential targeting the next major resistance between $36 and $39.20. This zone aligns perfectly with the 61.8% Fibonacci retracement, which is historically where larger moves tend to conclude or stall.
💎On the downside, support remains solid between $20.30 and $19.75. This band has been a reliable support/resistance flip during the range and continues to act as the primary defense zone.
💎Adding fuel to the bullish outlook is the potential golden cross formation between the EMA 50 and EMA 200. If this confirms, it would add serious momentum to any breakout and attract trend-followers back into the market.
Paradisers, strive for consistency, not quick profits. Treat the market as a businessman, not as a gambler.
MyCryptoParadise
iFeel the success🌴
AVAX 4H – Trendline Capped Every Rally, But Can Bulls Break?AVAX continues to be suppressed by a long-standing macro downtrend line that has rejected every major rally since December. The current structure shows three critical interactions with the same horizontal zone: the original breakout, a failed reclaim, and the most recent rejection near $28.
Unless AVAX can flip the trendline with volume, the trend remains technically bearish. That said, price is still holding higher lows and has avoided a full breakdown toward major support at $14–16.
This is a textbook compression between higher timeframe resistance and major support — expect volatility ahead.
Key areas:
– $28–30 = major horizontal + trendline confluence
– ~$14 = last clean demand zone
– Flip = breakout potential to ~$33+
– Fail = sweep of support possible
Wait for the reaction — this is where bias is defined.

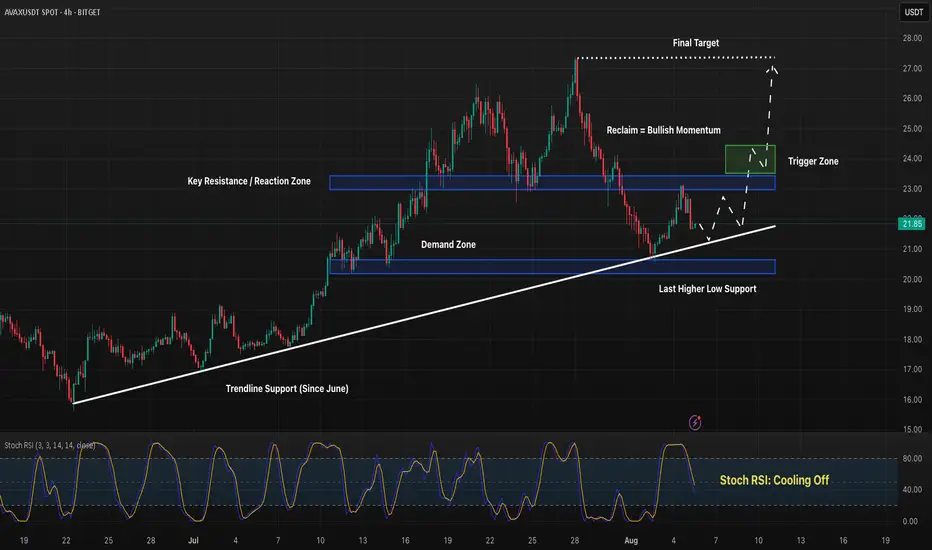
AVAX 4H – Support Retest Underway, But Will the Trendline Hold?Avalanche is approaching a high-stakes support cluster — with ascending trendline support and a previous demand zone lining up perfectly. After a sharp move down from the $26 highs, bulls are watching closely to see if this higher low structure can hold.
🔹 Key Structure & Zones
Price is consolidating between the $20–$23 range.
The mid-level supply zone around $22.80 has repeatedly rejected price — a reclaim would flip structure bullish again.
The white trendline has been respected since late June and is lining up with key support — this is a textbook decision point for trend continuation.
🔹 Momentum Check
Stoch RSI is near oversold, priming for a bounce setup.
Bullish case: higher low → reclaim $23 → push toward $26.30 and possibly $27+.
Bearish case: trendline break → revisit the lower $20 demand box.
🔹 Scenario to Watch
Entry setups may emerge on wick into the trendline with momentum curling up.
$23 is the key short-term reclaim level — above that, momentum could accelerate fast.
Will this structure hold and launch the next leg up — or is AVAX setting up for a deeper flush?
Let’s talk setups 👇
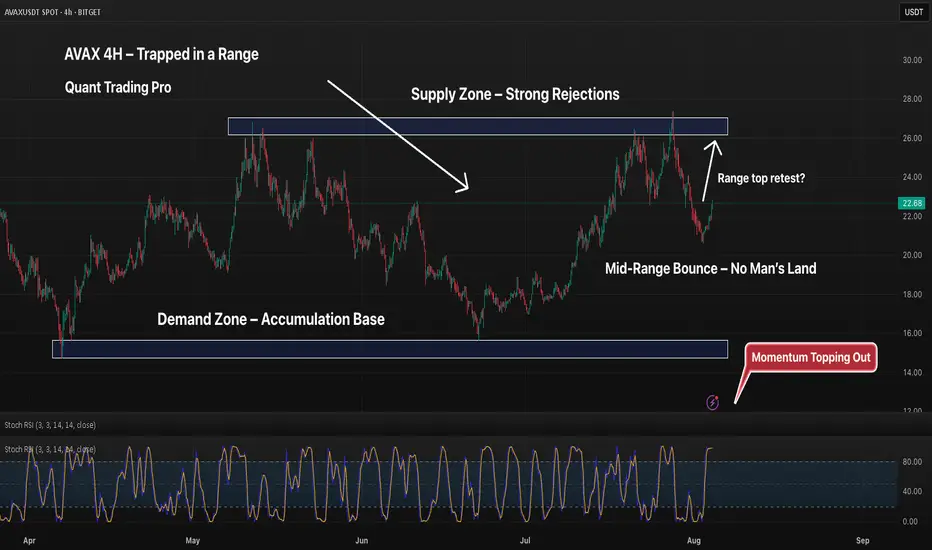
AVAX 4H – Range-Bound Between Supply and Demand, Can It Escape?AVAX has been locked in a well-respected range for months, bouncing cleanly between a strong supply zone around $26–$28 and a well-established demand zone near $15–$17. Each visit to either extreme has resulted in sharp reversals, signaling a balanced market stuck in accumulation/distribution.
Currently, price has bounced from mid-range and is approaching the upper half — but with Stoch RSI entering overbought, bulls may face short-term exhaustion.
📉 Key Levels:
– $26–$28: Heavy supply / previous double rejection zone
– $15–$17: Accumulation base that triggered two rallies
– $22.5–$23.5: Mid-range turbulence with no clear bias
⚠️ Until price breaks either extreme with conviction, range trading logic applies: fade extremes, avoid the middle chop, and wait for expansion.
Breakout traders: Stay patient.
Range traders: Eat well.
👇 Let me know if you're playing the bounce or waiting for the break.
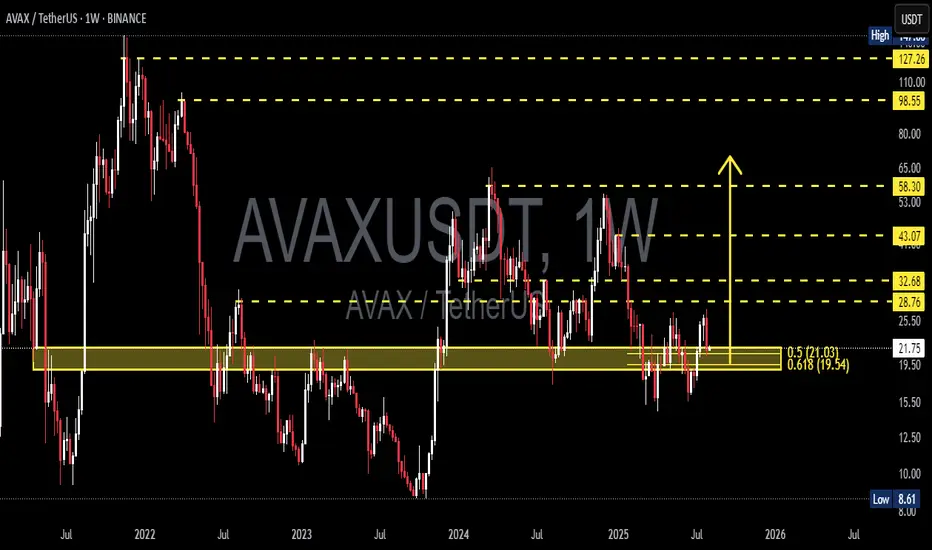
AVAX at the Edge: Golden Pocket Support or Breakdown Incoming?🧠 Overview:
AVAX is currently trading at a decisive support zone, aligned perfectly with the Fibonacci golden pocket (0.5–0.618) at $21.03–$19.54. This level has historically acted as a strong pivot zone, serving both as resistance during bear markets and support in bullish recoveries.
The market has compressed into this key demand zone after a prolonged sideways structure. Now, all eyes are on how price will react — this zone will likely determine AVAX's mid-to-long-term trend.
---
🔍 Key Technical Highlights:
🔸 Fibonacci Confluence Zone (Golden Pocket):
0.5 Fib Level: $21.03
0.618 Fib Level: $19.54
This area coincides with a weekly demand block — a high-probability reversal zone where buyers have historically stepped in.
🔸 Major Resistance Levels to Watch:
$28.76 – First significant supply zone.
$32.68 – Previous lower high, potential breakout confirmation zone.
$43.07 – Weekly structure resistance.
$58.30 – Mid-term bullish target.
🔸 Support Levels Below:
$15.00 – Local base during early 2023.
$8.61 – Multi-year low (critical support if demand collapses).
🔸 Structure Insight:
Price is currently forming a macro higher low, suggesting a potential accumulation phase. However, failure to hold this zone could trigger a bearish continuation.
---
🚀 Bullish Scenario:
If price sustains above $19.54–21.03 and breaks above $25.50, the following upside targets could be reached:
1. $28.76 – Local resistance
2. $32.68 – Break of bearish structure
3. $43.07 – Momentum extension
4. $58.30 – Bullish macro target
Catalyst to watch: Weekly bullish engulfing candle + volume spike + break of structure → these would confirm buyers are in control.
---
🔻 Bearish Scenario:
If the price breaks below $19.54 with strong bearish volume, then:
1. $15.00 – First zone of interest for buyers
2. $8.61 – Critical long-term support zone
This would confirm a distribution pattern and signal that the market may revisit lower accumulation zones before any major uptrend resumes.
---
🧩 Market Psychology Insight:
This current range is where smart money positions themselves — either for continuation or reversal. Retail traders often get shaken out in this kind of compression. Stay patient and wait for confirmation rather than anticipation.
---
🎯 Conclusion:
AVAX is now at a make-or-break point. With the price sitting in a high-confluence demand zone, traders should prepare for volatility and monitor weekly closes. A strong move in either direction will likely determine the next multi-week trend.
> “The bigger the base, the higher in space.” – If this is true accumulation, the upside could surprise many.
#AVAX #AVAXUSDT #CryptoTechnicalAnalysis #AltcoinWatch #FibonacciLevels #SupportResistance #BullishOrBearish #SmartMoneyZone #WeeklyChart #CryptoTrading #BreakoutOrBreakdown
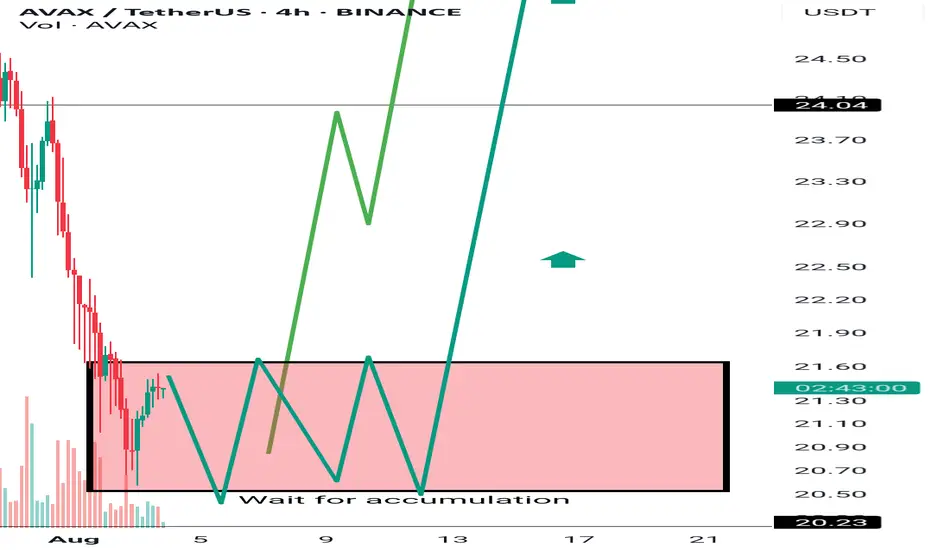
AVAX Setup – Two Bullish Scenarios
🔥 AVAX Setup – Two Bullish Scenarios! 💎
♦️ Overall Market Structure ♦️
Always keep an eye on Bitcoin and its dominance.
If dominance drops while BTC starts rising again, altcoins will usually have a smoother and stronger uptrend.
Check my daily analyses for a deeper structural outlook on the market. 🔍
♦️ AVAX Setup ♦️
As long as the market structure remains bullish, I’ll keep looking for valid long triggers.
Here are the 2 bullish scenarios I’m watching on AVAX:
🟡 Scenario 1:
If we get an accumulation box on the 1H or 4H timeframe, I’ll look to enter long after a clean breakout.
Stop-loss will be placed below the box.
🟡 Scenario 2:
If price suddenly moves up with sharp bullish candles, and forms a V-pattern around the $24.00 level,
I’ll enter on the breakout of that V-pattern.
🎯 Target:
In both scenarios, the first target is $26.15,
but my goal is to hold these positions for potential moves beyond $26.15.
🚀 Hit that 🚀 if you're watching AVAX too!
And don’t forget to follow for more 🔥 daily updates!
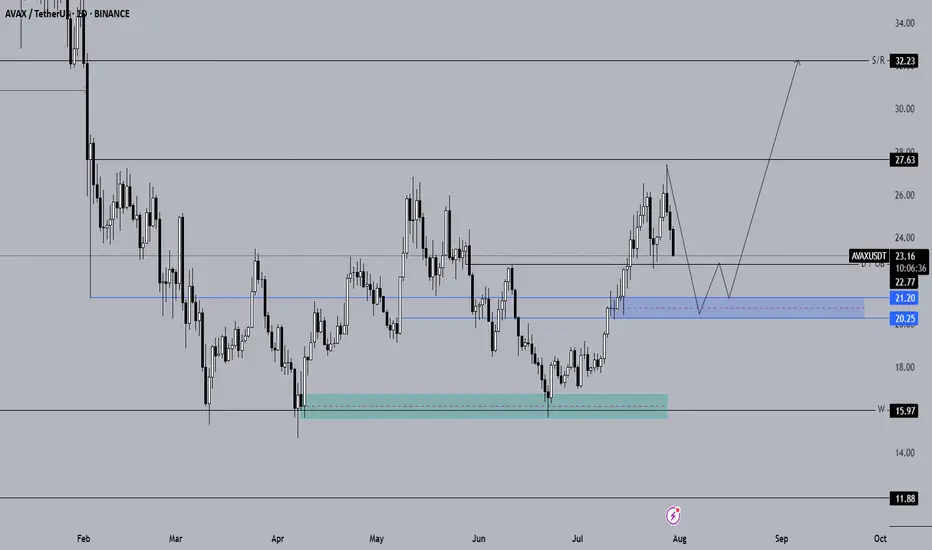
Long-Term Technical Analysis of AVAX CoinWhen evaluating AVAX for long-term investments, the blue support zone highlighted on the chart stands out as the key area to monitor for potential spot entries. If AVAX closes daily candles below the $22.77 level, it is expected to continue its downward trend.
The primary spot buy zone for AVAX is identified between the $21.20 – $20.25 support range. If the price retraces into the blue zone on the chart, we plan to initiate spot positions. Should AVAX show a reversal from this area, our next upside targets are $27.63 and $32, respectively.
If AVAX fails to generate a strong reaction from the blue zone and continues to decline, we will then monitor the $18 support level. As long as AVAX holds above $18, our bullish outlook from this analysis remains valid.
Not Financial Advice (NFA).
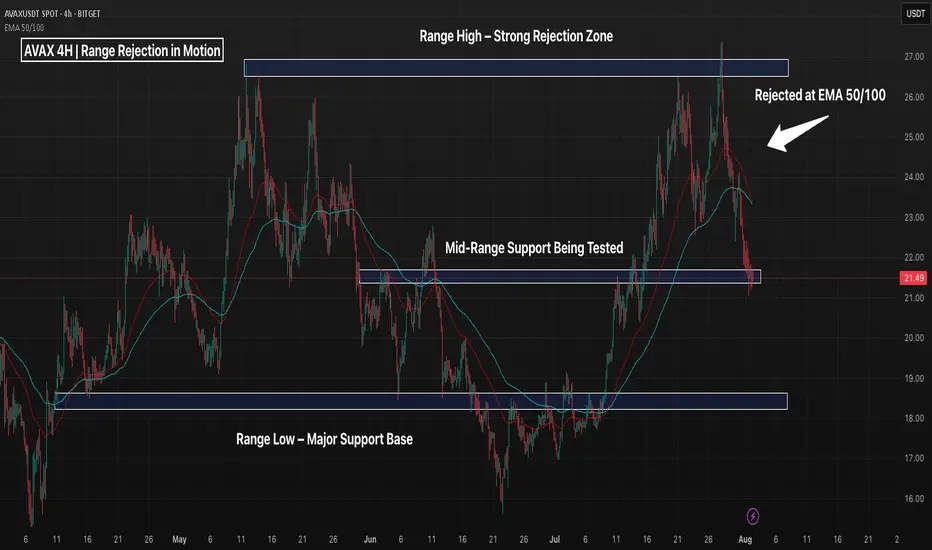
AVAX - Rejected at Range High, Now Testing Mid-Zone SupportAVAX just printed a textbook range rejection from the $26–27 resistance zone, which has capped price action since April. After rejecting the 50/100 EMA cluster, price is now testing mid-range support around $21.50 — a level that has historically offered short-term bounce opportunities or clean breakdown setups.
📌 Key Zones:
Top Resistance (~$26.50–27): Strong sell zone — multiple rejections
Mid-Range (~$21.50): Currently being tested for a possible bounce
Bottom Support (~$18.20–19): Range base with prior reversal history
📉 Reclaiming the EMAs could suggest another trip toward the highs, but failure to hold $21.50 opens the door to a deeper move toward $19 — or even a range breakdown if broader momentum weakens.
This chart highlights the importance of range trading structure — clean rejection up top, bounce attempt in the middle, and final line in the sand at the bottom.
Trade Idea Scenarios:
Bullish: Bounce + reclaim of $23.50 EMAs = long toward $25+
Bearish: Breakdown below $21.50 = short toward $19 or lower
How are you playing this range? 👇
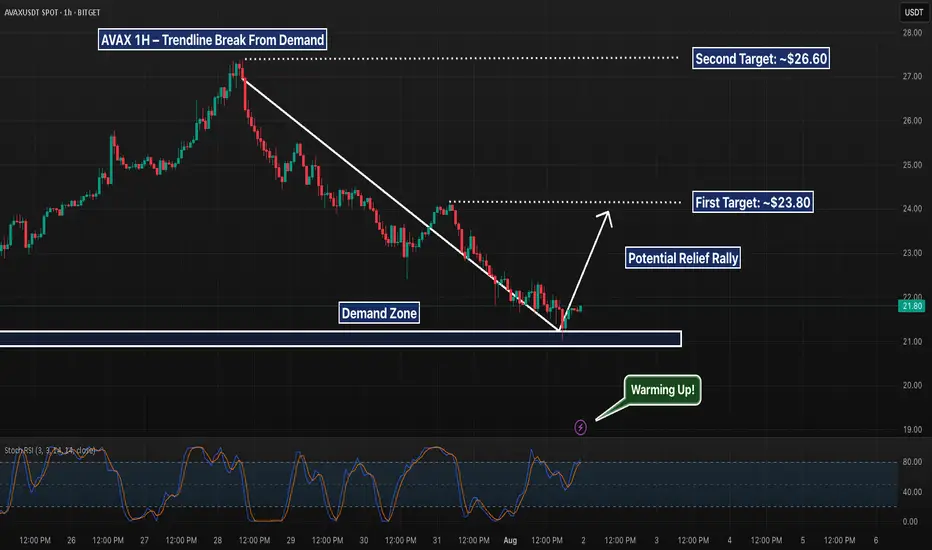
AVAX - Trendline Break From Demand, But Can Bulls Push to $24?AVAX is showing signs of life after rebounding cleanly off a local demand zone near $21 and breaking its recent downtrend line. This structure opens the door to a possible short-term rally — with first resistance sitting near $23.80 and a secondary target at $26.60. However, Stoch RSI is already pushing into overbought, so momentum must sustain or risk another fade.
A retrace to retest the broken trendline and hold would add confluence for longs. If that fails, bulls may get trapped.
📌 Demand bounce
📌 Trendline break
📌 Eyes on follow-through to reclaim higher levels
This is early-stage structure shift — not confirmation yet, but worth watching.
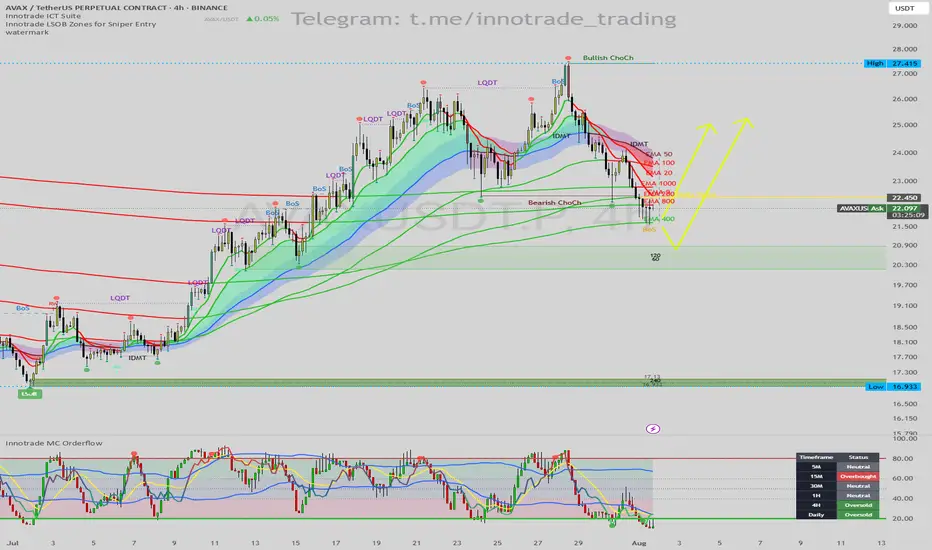
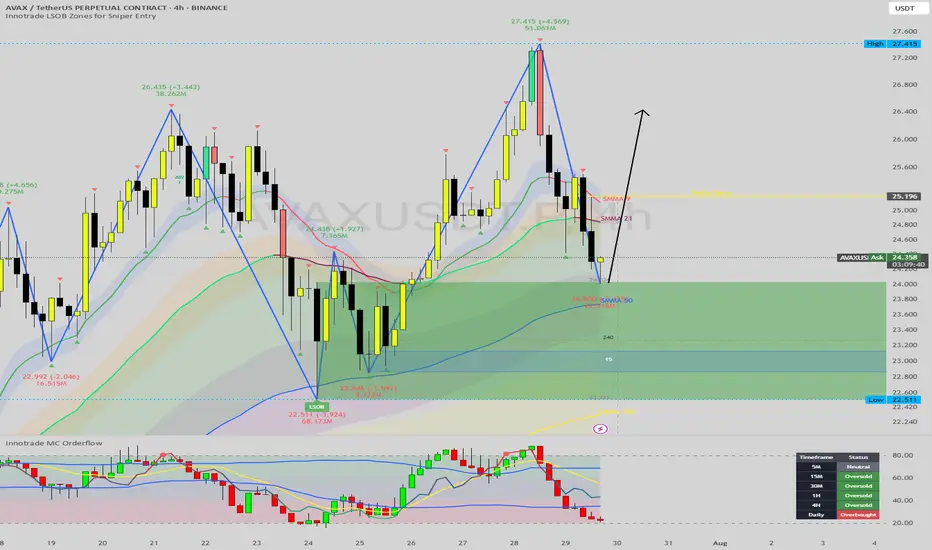
AVAX/USDT: Bullish Reversal at MA Support & Daily OversoldHello traders,
Today's analysis focuses on a high-probability long setup for AVAX/USDT on the 4H timeframe. The price has pulled back to a critical area where a confluence of powerful technical indicators suggests a significant bounce or reversal is imminent.
1. Trend & Context (The "Why")
Following a strong uptrend, AVAX entered a corrective phase, marked by a Bearish Change of Character (ChoCh). This correction has now brought the price to an A+ support zone.
Here are the key confluences for this bullish setup:
Major Support Cluster: The price is currently reacting to a critical support cluster formed by the EMA 200 and EMA 400. These long-term moving averages are major levels where institutions often step in to buy.
Momentum Exhaustion (MC Orderflow): The Innotrade MC Orderflow oscillator provides the critical confirmation that selling pressure is exhausted:
The oscillator is deep in the OVERSOLD territory on the 4H chart.
THE CRITICAL MTF CONFLUENCE: The Multi-Timeframe Cycle Table is the most important factor here. It shows that both the 4H and Daily timeframes are "Oversold". This alignment of higher timeframe momentum at a key technical support level is a very powerful signal for a reversal.
2. Entry, Stop Loss, and Targets (The "How")
The alignment of these factors gives us a clear and actionable trade plan with a great risk-to-reward profile.
Entry: An entry around the current price ($21.50 - $22.10) is ideal, as we are right at the MA support cluster.
Stop Loss (SL): $21.20. This places the stop loss safely below the EMA 400 and the recent swing low, providing a clear invalidation point for the setup.
Take Profit (TP) Targets:
TP1: $24.00 (Targeting the Bearish ChoCh level and the cluster of short-term EMAs).
TP2: $26.50 (The next major swing high, a logical area of resistance).
TP3: $27.40 (The major high of the entire range, a longer-term target if the uptrend resumes).
Conclusion
This trade setup is of very high quality due to the powerful confluence of a major MA support cluster with a confirmed multi-timeframe momentum exhaustion signal (4H and Daily). This synergy creates a high-probability environment for a significant bullish reversal.
Disclaimer: This is not financial advice. This analysis is for educational purposes only. Always conduct your own research and manage your risk appropriately.
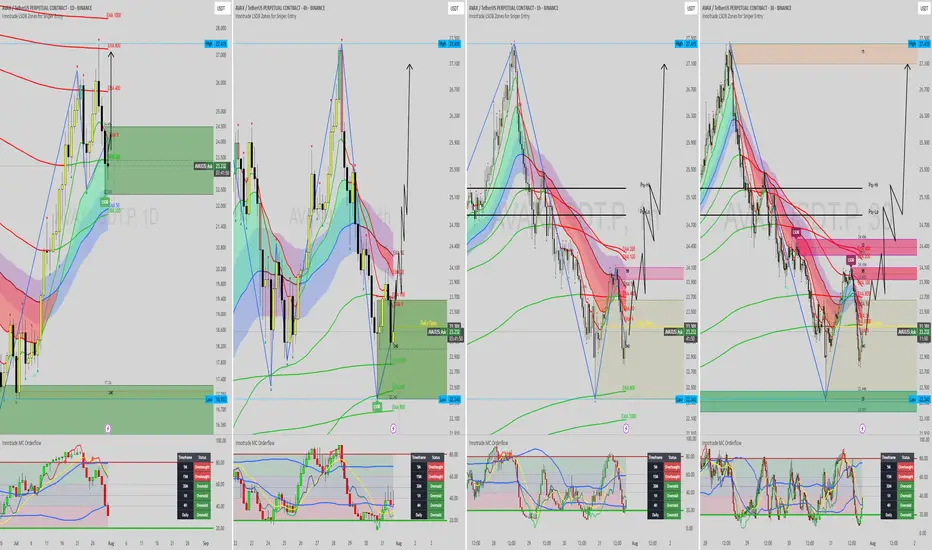
AVAX at the Golden Pocket: A High-Confluence Long Setup EmergesHello, traders. Today, we're analyzing Avalanche (AVAX), which has undergone a healthy and necessary correction after a powerful impulsive move upwards. Price has now pulled back to a critical decision point that is loaded with a confluence of technical support signals.
This analysis will break down, step-by-step, why the current price zone represents a high-probability area for a bullish reversal, potentially kicking off the next major leg up. This is an educational walkthrough demonstrating how to stack technical factors to build a strong trade thesis.
The Analysis: Stacking the Technical Confluences
A high-probability trade is rarely based on a single signal. It's built on multiple, independent factors all pointing in the same direction. Here is the confluence we are seeing on the AVAX 4H chart:
1. The Bullish Market Structure:
First, the context. The overarching trend for AVAX is clearly bullish. Our Zig-Zag indicator confirms a strong pattern of higher highs and higher lows. The current dip is, therefore, considered a corrective pullback within a larger uptrend, meaning we should be looking for buying opportunities, not fighting the trend.
2. The Golden Pocket (Fibonacci Retracement):
We've drawn a Fibonacci retracement from the beginning of the last impulsive leg up (
22.54)
Price has now pulled back precisely into the "golden pocket" between the 61.8% and 78.6% levels. This zone is a classic, high-probability area for trend continuation entries, as it often represents a point of equilibrium before the dominant trend resumes.
3. The Bullish LSOB (Liquidity Sweep Order Block):
The most significant signal in this area is the large green LSOB zone. This institutional footprint was formed after a sweep of a prior low and represents a major area of buying interest. The fact that the golden pocket lies directly within this LSOB provides a powerful layer of confirmation. Price has now entered this zone, effectively mitigating the imbalance and reaching a key area of demand.
4. Dynamic & Static Support Confluence:
Octo MA: The EMA 100 is flowing directly through the LSOB, providing a strong layer of dynamic support.
Daily Open: The Daily Open is situated just above, acting as an initial magnet and a potential first target for a bounce from this zone.
5. Momentum Exhaustion (Oscillator Analysis):
This is the final, critical piece of the puzzle. Our MC Orderflow oscillator in the sub-chart shows that selling momentum is deeply exhausted, with the lines pushing into the green oversold territory.
Critically, the Dashboard confirms this across multiple timeframes (5M, 15M, 30M, 1H, and 4H are all flashing "Oversold"). This is a powerful signal that sellers are losing control and the market is primed for a reversal, providing excellent timing for a potential entry.
The Potential Trade Plan
Based on this strong confluence, here is a potential trade plan:
Entry Zone: The current area between $23.50 and $24.80 (the LSOB / Golden Pocket) is the ideal entry zone.
Stop Loss: A logical stop loss can be placed just below the low of the LSOB and the 100% Fibonacci level, around $22.40. This invalidates the entire setup if hit.
Potential Targets:
Target 1: The Daily Open / 38.2% Fib level at ~$25.40.
Target 2: A retest of the recent swing high at $27.41.
Target 3 (Extension): If the trend resumes with strength, longer-term targets can be found at the 127.2% or 161.8% Fibonacci extension levels.
Conclusion
We have a powerful alignment of bullish market structure, a golden pocket retracement, a major institutional LSOB zone, dynamic MA support, and clear momentum exhaustion. This stack of confluences presents a compelling case for a long position on AVAX.
Disclaimer:
This content is for educational purposes only and does not constitute financial or investment advice. Trading carries a high level of risk. Please do your own research and consult with a professional financial advisor before making any investment decisions. You are solely responsible for any trades you take.
AVAX Update - Second Chance for a Long positionAVAX left Bullish-FVG behind. It's normal that price comes back to take it's FVG. Long setup is in tact.
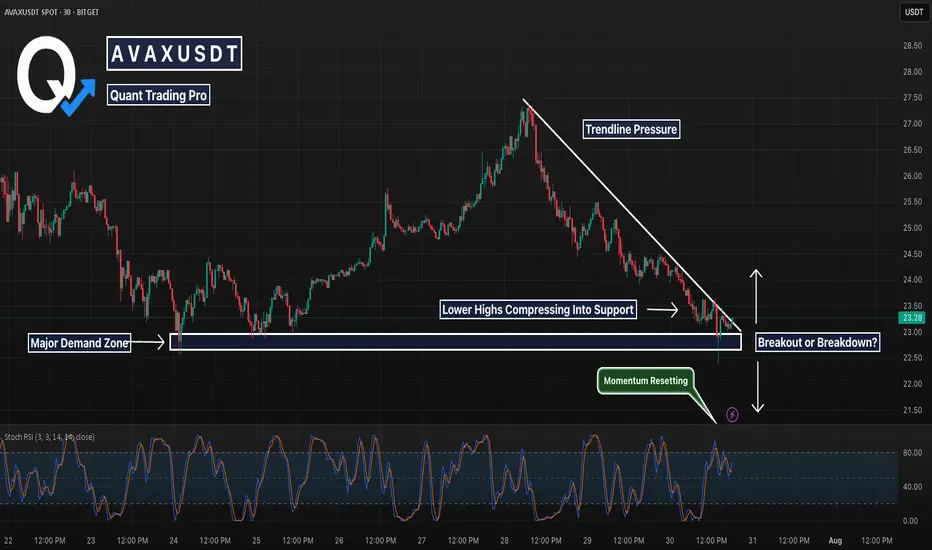
AVAX 30m – Compression Into Support, Breakout or Breakdown Next?AVAX has been grinding down inside a descending triangle, pressing into a major support zone that’s already seen multiple reactions.
📉 Price action is currently wedged between:
Strong horizontal demand (white box)
Well-defined trendline resistance (descending white line)
Today’s wick below support was aggressively bought up — but until we get a clean break from this squeeze, momentum remains neutral at best.
🔍 What We’re Watching:
Support holding = possible spring and breakout setup
Rejection from trendline = bearish continuation structure
Stoch RSI reset = momentum is primed for a move in either direction
This is a textbook example of compression → expansion. Break + retest setups will be key
AVAX – Hidden Chance for Latecomers🔥AVAX – High-Potential Setup Amid Market Catch-Up
While many crypto assets have surged in the recent bullish wave, AVAX appears to have been left behind — and that could present a high-reward opportunity ahead.
From both a fundamental and on-chain perspective, this project shows promising signs, especially with notable activity among whale wallets. I believe AVAX has the potential for a strong long-term rally — but there’s one critical condition to watch.
Price has recently reacted to a key custom demand zone. However, for confirmation of buy-side strength, we need to see a clean breakout and daily close above the ~$28 level. If that breakout is confirmed, I’ll be looking to accumulate for a long-term hold, with a target of $65 — and possibly up to $100 if momentum continues.
That said, risk management remains my top priority. I’ll allocate no more than 3–4% of my total portfolio to this position.
Keep an eye on the $28 breakout. If the trade is triggered, I’ll provide updates here.
🔁 This analysis will be updated whenever necessary.
Disclaimer: This is not financial advice. Just my personal opinion.