AVAX Will the journey continue?Avalanche (AVAX) has been gaining attention in the cryptocurrency market and analysts are eager to know its future price outlook. This year 2024 altcoins are almost facing a serious decline after the rise. We should not put all our faith in buying when it grows, sometimes selling or avoiding buying when it falls is also an advantage.
Looking at the whole time since Jan 2023 ( 19 months ), AVAX had a strong price increase and then fell again. What are the buying and selling points with the S1-TM strategy, we had 93 closed orders, with a net profit of ~336% (including commissions). This is quite good for autotrade.
NOTE: This is my personal opinion on this strategy. This is not investment advice!!!. The market always has risks and opportunities. Please consider carefully before making any decision!
Trade ideas

Avax : Bullish but huge unlocks in 20th AUGCandle stick bars show the bullish sign but we have to be careful, huge unlocking on the way .It could be affect the market .(appr:- 228M unlocking only in Avax

AVAXUSDT: Bearish Trend (Harmonic Pattern)AVAX is moving in bearish trend and could not break the HHs and currently break the previous HLs and forming Harmonic Pattern so we can take a short trade on CMP and wait for the TP-2, and also check if any bullish divergence formed on 1hr or 30mint time frame, if any bullish divergence is formed on mention time frame we must be closed over short trade and take a long/buy trade.

AVAX has a good set up for a long trade.AVAX has a good risk reward set up in the weekly chart. MACD is about to cross zero line. VWAP is already above the zero line. AVAX also have multi time frame squeezes forming.
I'm accumulating under 27.50. I will start a small position at these levels and accumulate and size up under 27 for a position trade. This is not a financial advise DYOR.

Sol Short ScalpSol short term scalp, priece still in More volume VRVP,
downtrend, POC around 25.7, and it depends how BTC moves soon.

AVAX Long SetupMarket Structure Shift on 1 Hour and Daily Time Frame. The price is likely to move towards the targets mentioned. The stop loss is put just beneath the recent higher low below a demand zone.

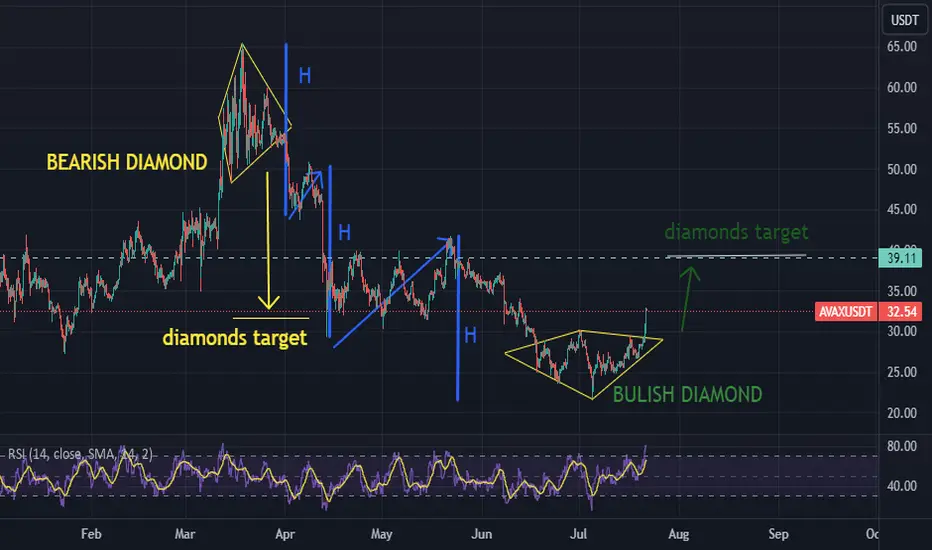
Avax updated for the bullish diamond pathThe plan of Avax.
Idea was created for education & entertainment and this is not a trading advice.

Alikze »» AVAX | Head and shoulders pattern🔍 Technical analysis: Head and shoulders pattern
- It is moving in a downward channel in weekly and daily time.
- In the previous post , it was mentioned that if the supply zone fails, it can touch the next zones, which after retesting the zone, failed to break the red box and formed a corrective structure.
- According to the current corrective structure, a head and shoulders pattern is formed.
- Also, due to the failure of the neck line, any return can be a pole back to the broken structure.
- So the break of the $25 area will also lead to the break of the channel and it can have a triple correction with Fibo targets of 100 - then $12.5 and Fibo of 1.618.
💎 Alternate scenario: If the $25 zone is maintained and the supply zone fails, it can retest the next zone.
»»»«««»»»«««»»»«««
Please support this idea with a LIKE and COMMENT if you find it useful and Click "Follow" on our profile if you'd like these trade ideas delivered straight to your email in the future.
Thanks for your continued support.
Best Regards,❤️
Alikze.
»»»«««»»»«««»»»«««
BINANCE:AVAXUSDT

top 150 usd on 2025 July top 150 usd on 2025 July on AVAX based on Elliot wave Fibonacchi Gan and resistance

AVAXUSDT is BulishPrice has given a good breakout and broken previous lower high successfully. If it manages to break freshly printed higher high then we can expect a bullish rally as per Dow theory. Targets are mentioned on the chart.

AVAX/USDT: 70% PROFIT POTENTIAL TRADE SETUP!!Hey everyone!
If you're enjoying this analysis, a thumbs up and follow would be greatly appreciated!
AVAX looks decent here. Breaking out from the falling wedge-like structure in the daily time frame and currently, retesting it. Also, holding 50MA support here very well. Buy some here and add more in the dip.
Entry range:- $27-$29
Targets:- $33/$38/$42/$48
SL:- $24.5
Lev:- 2x-4x
What are your thoughts on AVAX's current price action? Do you see a bullish pattern? Share your analysis in the comments below!

AVAX at 0.618AVAX at this point on 0.618, in place where is not much VRVP volume.
Need watch this price movement and
because soon will decide witch side go, up or down.
After last move up about 23%, we gow down move around 12%.
Volume going down with spikes.

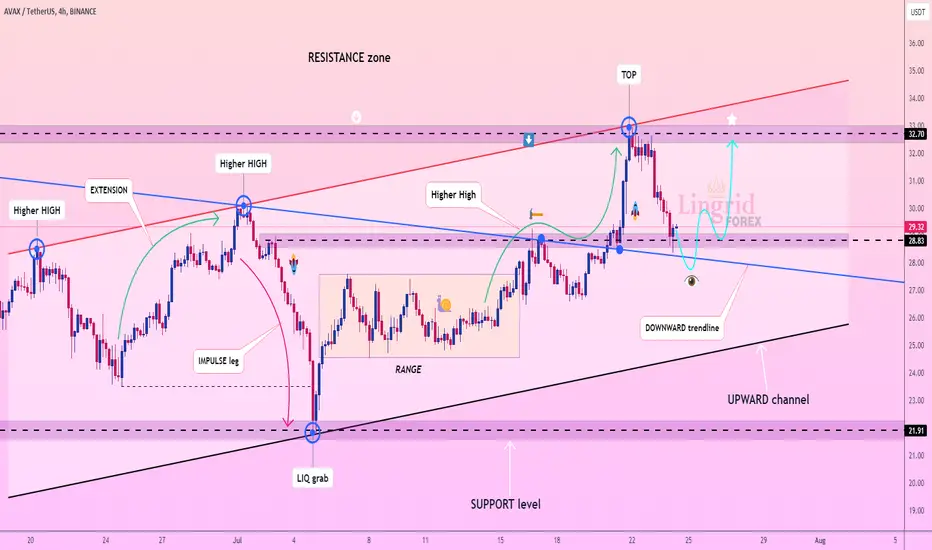
Lingrid | AVAXUSDT Break and RETESTThe price perfectly fulfilled my previous idea. It hit the target level. BINANCE:AVAXUSDT has been trending upward, recently breaking through the key level at $30.00. The market closed with a large bullish candle last week, and now it's testing the approximately 50% of that weekly range. After breaking out above a strong level and pulling back to retest it, we're seeing a classic break and retest setup. Given this setup, I'm expecting a classic pullback and continuation pattern to unfold, with the price potentially retracing before resuming its upward movement. My goal is the resistance zone around 32.70
Traders, if you liked this idea or if you have your own opinion about it, write in the comments. I will be glad 👩💻
AVAXUSDTAVAXUSDT exhibits strong bullish momentum, supported by robust buying pressure and positive technical indicators, suggesting potential upward movement ahead. Traders are encouraged to monitor for continuation patterns and favorable entry points in the current market environment.

detailed important chart tells u why to buy AVAXin weekly chart can notice a breaking out of falling wedge pattern finally after more than 6 months..
the price now moving in huge ascending channel going to making new ATH in next few weeks..
u can see elliot wave in the chart and It's clear that elliot wave correction done
one of the biggest coins in the market ... ranked 11th in terms of market cap (11.871B)
it's on good support and suitable place to buy ... long term target is 200$
best regards ceciliones🎯

AVAXUSDT Poised for a Major Move – Are You Ready?Yello Paradisers! Have you noticed the intriguing action in #AVAXUSDT? This is a moment you don't want to miss!
💎#AVAXUSDT has broken free from its longstanding descending channel, signaling a potential upward trajectory. After navigating within this channel for a considerable period, #AVALANCHE has successfully breached it.
💎The key resistance level at $29.14 has now turned into a crucial support. This support level is pivotal as it has been respected multiple times in the past. If #AVAXUSDT maintains its momentum above $29.14, there's a high probability of a sharp upward move.
💎However, if the price descends below the $29.14 support level, the scenario changes. In this case, the probability leans towards a bullish rebound from the lower, formidable support at $24.46.
💎While some inexperienced traders might be tempted to short at this point, it's essential to maintain a broader perspective and wait for proper price action. A break below the $29.14 support will likely trigger a significant downward move, causing the price to drop further.
Remember, disciplined and strategic trading is the key to long-term success. Stay focused, patient, and make informed decisions. Let's navigate this market wisely, Paradisers!
MyCryptoParadise
iFeel the success🌴

Avalanche AVAX price is on the verge of a strong movementThe trading volume of #AVAXUSDT has firmly established itself in the top 10.
So is Avalanche token being actively sold or bought now?
We will have all the answers soon, but for now, here are two scenarios for the CRYPTOCAP:AVAX price movement:
🔴 red - $35 - $45 - ($18.7-23.7)
🔵 blue - $32 - $55 - $43 - $110
So which pill 💊 will you choose 🔴🤷🔵 ?
_____________________
Did you like our analysis? Leave a comment, like, and follow to get more

AVAXUSDT.1DAs I analyze the daily chart of AVAX/USDT, several key patterns and levels stand out to me.
Resistance and Support Levels
Resistance Levels:
R1: The first significant resistance level is around $31.48. This level aligns with previous highs and acts as a potential target if the bullish momentum continues.
R2: The next major resistance is around $45.18, which marks the highest point observed on this chart. This level will likely serve as a strong barrier to further upward movement.
Support Levels:
S1: The initial support level is at $18.85, where the price has shown a tendency to bounce back after recent declines.
S2: A more robust support level is at $8.61. If the price falls below this, it might indicate a more prolonged bearish phase.
Technical Indicators
Relative Strength Index (RSI):
The RSI is currently at 48.43, which is relatively neutral. This indicates that the market is neither overbought nor oversold at the moment. A move above 70 would suggest overbought conditions, while a drop below 30 would indicate oversold conditions.
Moving Average Convergence Divergence (MACD):
The MACD line is slightly above the signal line, with values of 0.61 and -0.48, respectively. This suggests a potential bullish crossover, which could lead to upward price momentum if confirmed by further movement.
Trend and Pattern Analysis
I have observed a harmonic pattern forming, which suggests a potential reversal zone around the current price levels. The completion of this pattern indicates that the price might head towards the resistance levels mentioned above.
The price has recently broken above a downward trendline, which adds to the bullish sentiment. If this breakout holds, it could pave the way for a move towards R1 and possibly R2.
Market Sentiment and Predictions
Given the current setup, my expectation is for AVAX/USDT to test the resistance at $31.48 in the short term. A successful break above this level could see the price aiming for the $45.18 resistance.
Conversely, if the price fails to maintain its current levels, it might retest the support at $18.85. A break below this could drive the price down towards $8.61.
Conclusion
In conclusion, while the overall sentiment appears cautiously bullish, it is crucial to monitor the key support and resistance levels. The RSI and MACD indicators support a potential upward move, but confirmation from price action is essential. I will keep a close watch on these levels and adjust my strategy accordingly.

AVAX Weekly Headed to $140We are at bottom of macro channel.
Little drawdown shall occur given prior chart price action. ETH ETF will signify open doors for every other smart contract L1 running off EVM infrastructure.

EDUCATIONALLong idea with Bullish diamond
Idea was created for education & entertainment and this is not a trading advice.
AVAX on the moveWith our Fbuy trigger and a good pullback it's moving forward...
If everything is well with the King BTC then
Expected target 40 and above. DYOR

AVAXUSDT Bullish TraingleAVAXUSDT Technical Analysis Update
The AVAX price is breaking its triangle resistance on the 4-hour chart, indicating a potential bullish move from the current level.
Buy zone : Below $27.15
Stop loss : $26.10
Regards
Hexa

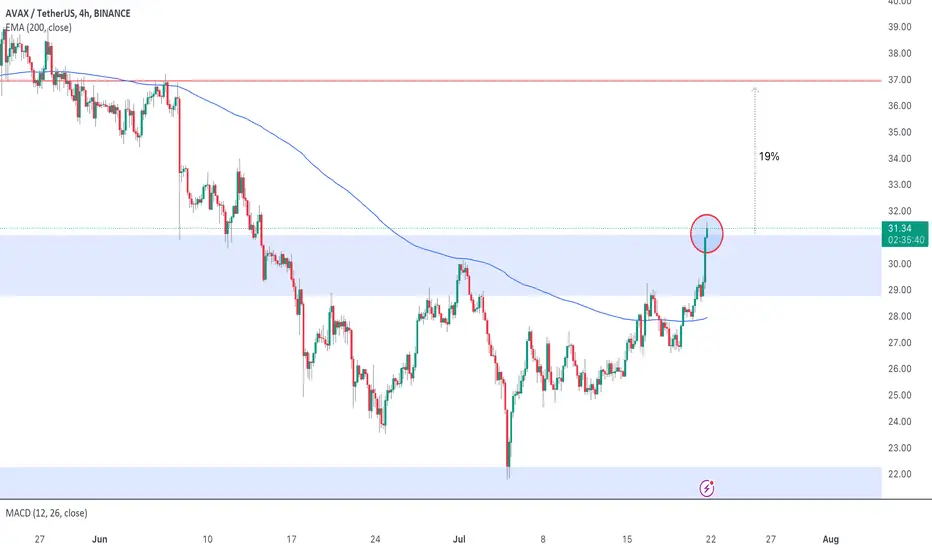
AVAX On Its Way To $37It looks like AVAX had no time to lose today. It pumped right through our support area between 29 and 31 and stuck the landing on the 4H chart.
Currently, it doesn't look as if AVAX loses steam. Accordingly, I expect a daily close above this crucial level, too.
If AVAX can close the daily/weekly candle above this level, it should be set for a run towards $37.
We might see a smaller consolidation or cool-off period, which is healthy. Nevertheless, with the upcoming ETH ETF, AVAX should have enough fuel for its flight to $37.
A quick cool-off phase would also help to bring momentum indicators back to a neutral zone since they are currently heavily overbought.
Trade signals in lower timeframes have already been flashing bullish signs, and I expect the same in higher timeframes.
Summarized and given the mentioned close on the higher timeframe, AVAX looks bullish for the next days and weeks.
BINANCE:AVAXUSDT