AVAX Analysis (1D)From the point where we placed the red arrow on the chart, it seems a correction has begun.
This correction appears to be a Diametric pattern, and wave E does not seem to be complete yet. It's expected that wave E will finish within the green zone.
The target could be the red box area.
A daily candle closing below the invalidation level would invalidate this analysis.
invalidation level: 10.90$
For risk management, please don't forget stop loss and capital management
When we reach the first target, save some profit and then change the stop to entry
Comment if you have any questions
Thank You
Trade ideas

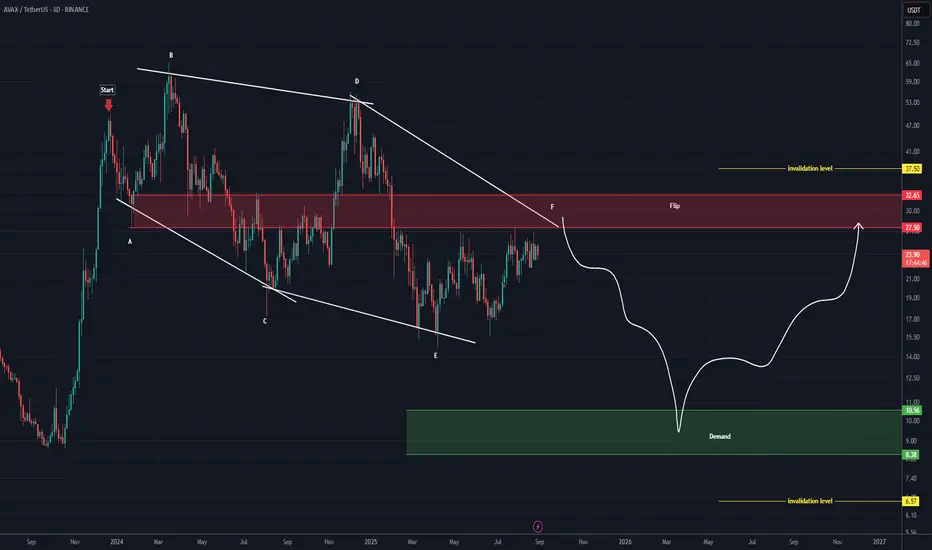
AVAX Analysis (3D)This analysis is an update of the analysis you see in the "Related publications" section
Before anything else, pay attention to the timeframe: it’s the 3-day timeframe.
The structure that AVAX is following is a large diametric, where wave F of this diametric is expected to end within the red-marked zone. After that, the price is anticipated to enter the bearish G wave.
Wave G could extend down to the main order block, which is the green-marked zone.
For both the bearish and bullish scenarios, the invalidation levels are marked on the chart. A daily candle closing above or below these levels will invalidate the respective outlook.
For risk management, please don't forget stop loss and capital management
Comment if you have any questions
Thank You
AVAX 1D Analysis – Key Triggers Ahead💀 Hey , how's it going ? Come over here — Satoshi got something for you !
⏰ We’re analyzing AVAX on the 1-Day timeframe timeframe.
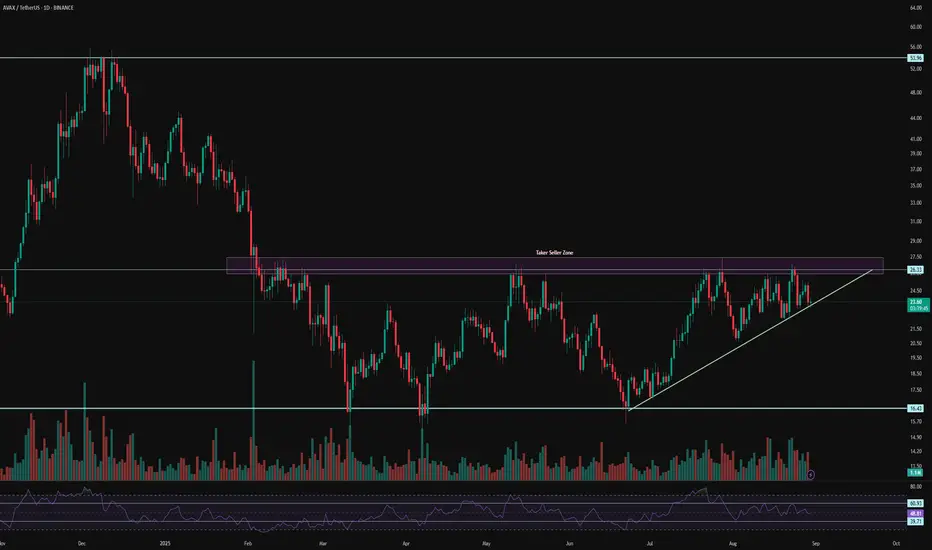
👀 In the daily timeframe of AVAX, after the drop it experienced, AVAX entered a box with a long-term range. The ceiling and floor of this box are in the area of $16 and $26. The time range of this box or its length is almost 170 days. At the ceiling of this box, there are strong seller tickers that get their sell orders activated every time the price reaches this area. To break this zone and for a good rise of AVAX, we need a very strong and high-volume momentum that causes a price jump and fills the sell orders.
💰 In the daily timeframe of AVAXBTC we can see a relatively good compression formed in this area, and with the breakout of the Bitcoin ceiling, more Bitcoin will be converted into AVAX and it can be a good confirmation for a long position and some spot buying. The area considered for the alarm zone is 0.0002286.
⚙️ Two key areas for RSI have been considered. Passing the swing limits of 61 and 40 can bring good volatility to AVAX and help it break out of this RSI compression that is seen as a box.
🕯 The area considered as the seller ticker is a strong one, and every time the price reached this area, we faced selling pressure. The size of the green candles is also larger compared to the red candles, and each time the compression area became smaller and the price is ready for a breakout and reaction (not today but next week).
🔔 The area we considered as the alarm zone for AVAX is $26, and with the breakout of this area, AVAX can move towards higher price levels. Price behavior at $26 can give us complete awareness for trading.
❤️ Disclaimer : This analysis is purely based on my personal opinion and I only trade if the stated triggers are activated .
Avax/usdtAvax
Ekhnii osolt orj irehed belen bolson bna. 52-55 chuhal une tgd 1,2,3,4,5 zuraglal garna

avax avalancheAvalanche is a layer one blockchain that functions as a platform for decentralized applications and custom blockchain networks. It is one of Ethereum’s rivals, aiming to unseat Ethereum as the most popular blockchain for smart contracts. It aims to do so by having a higher transaction output of up to 6,500 transactions per second while not compromising scalability.

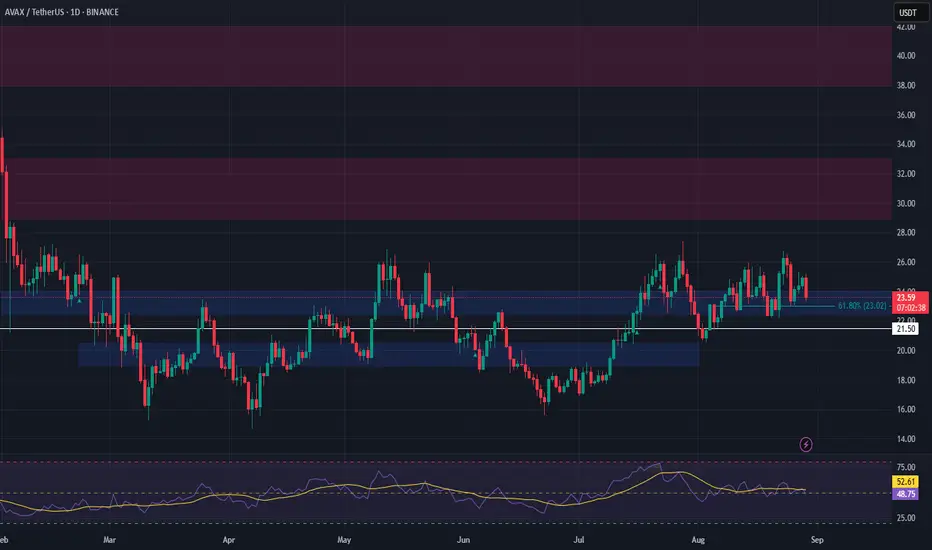
AVAX Setup – 61.8% Fib SupportAVAX is currently sitting on major support aligned with the 61.80% Fibonacci retracement, providing a high-confluence long spot opportunity.
Trade Setup:
• Entry Zone: $23.00 – $24.00
• Take Profit Targets:
🥇 $29.50 – $33.00
🥈 $38.00 – $42.00
• Stop Loss: $21.50
IT IS ALMOST $AVAX TIMEAVAX has been consolidating inside a symmetrical triangle for nearly 4 years. Dips get bought up, bullish news on every front, EW count says were ready for MACRO W3, fibs say were going to $350-$500. The breakout will stun those who arent in position, and if we do happen to get a dip I am loading more. CRYPTOCAP:AVAX is my single largest crypto position. LFG!

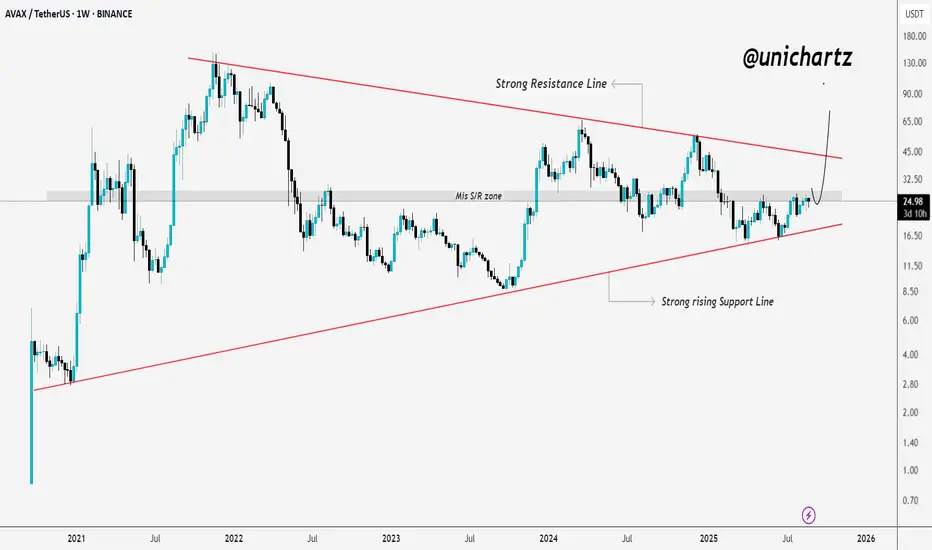
AVAX Prepping for Explosive Move – Watch the ZoneCRYPTOCAP:AVAX is showing strength on the weekly chart, approaching a key mid S/R zone that’s acted as a pivot in the past.
If bulls can break and close above this level, it could trigger strong upside momentum.
The price is currently squeezed between a rising support and a descending resistance, a typical breakout setup.
I’m waiting for a confirmed weekly close above the zone before looking for longs. If that happens, a move toward $42+ is likely.
DYOR, NFA
AVAXUSDT DailyThe chart of AVAX/USDT shows a rising channel that has been forming since March 2025. Price is moving up and down inside this channel, making lower highs and higher lows in a zig-zag pattern.
The projection suggests that after testing the upper side of the channel near $28, the price may fall back to the lower boundary around $18, and eventually break down towards $13–14.
This pattern indicates that while the market is still respecting the channel for now, the overall expectation is a bearish breakout in the medium term.
What do you think ?


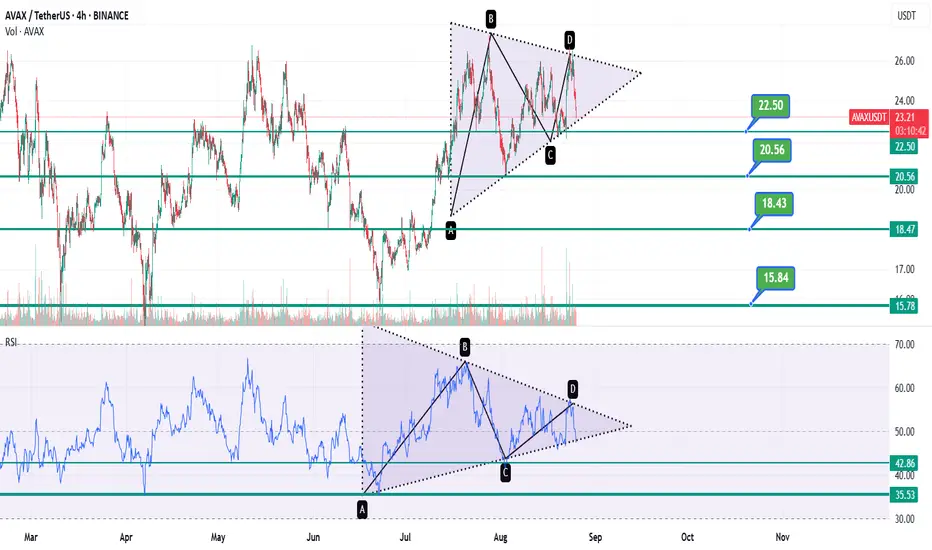
AVAX 4H – Rebound Toward TrendlineAVAX has rebounded off Fib retracement support and is now climbing back toward the descending trendline and resistance zone near $26.00.
Bullish path: A breakout above the trendline + resistance zone could shift momentum higher, opening a move toward $27.35.
Bearish path: Failure here risks another rejection, with downside targets aligning to the $23–22 Fib zone and liquidity at $20.64.
This setup sits at a decision point: either reclaim resistance and break structure, or roll back toward deeper liquidity grabs.

AVAX: GOOD PRICE!!!Hello friends
Given the arrival of buyers and the good price growth, now that we are in a price correction, there is a good opportunity to buy in steps in the specified areas with risk and capital management and move towards the specified goals.
*Trade safely with us*

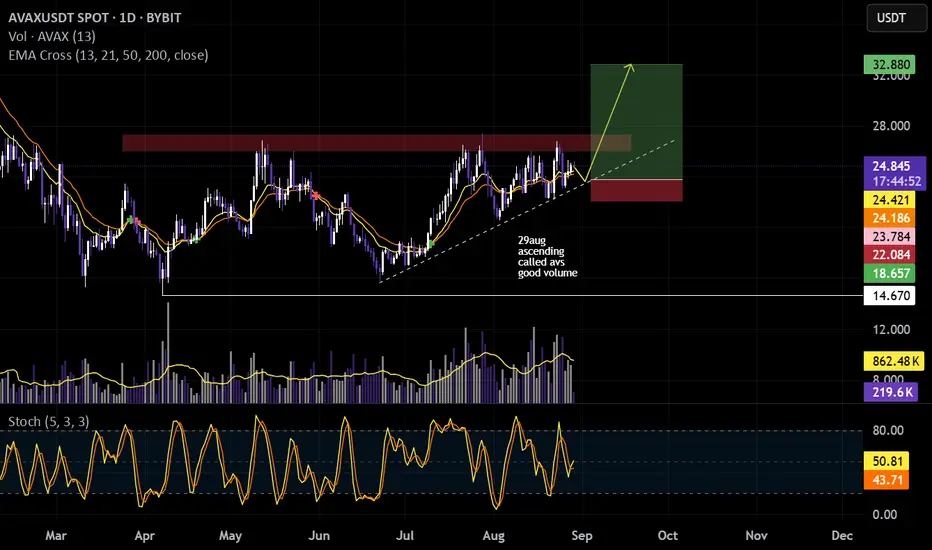
Avalanche & The Missing Bull Run PhaseWhat I noticed first about AVAX (Avalanche) was how strong prices remained after the 22-June low advance. Low prices are now gone forever... That's just the way it is.
AVAXUSDT peaked 28-July at $27 but the retrace that followed was minimum. Prices remain really strong and this is good for the bulls.
The action right now is happening close to resistance. Long-term, Avalanche has been sideways and this sideways is now happening at the upper-boundary of the range. This is also extra-bullish.
Notice how an ascending triangle developed on the chart. This same pattern is now present on hundreds of altcoins. This same pattern will lead to a positive outcome, a strong jump.
Imagine AVAXUSDT moving from $25 to $65 in one strong burst. Up and up non-stop. Think Aave or Bitcoin Cash.
That is what the chart looks like. That is what the chart is saying.
People can say the bull market is over, "Bitcoin already hit the top." Here I say that we still have to see the bull run, the most extraordinary phase of the entire cycle. Can't miss it, you have to participate.
Namaste.

Avalanche seeks to retest $23.6 ┆ HolderStatBINANCE:AVAXUSDT on the 6h chart has rebounded from the $23.5 support zone, showing strength after a series of ascending triangle formations. The price action is coiling within a larger channel, with repeated rebounds confirming this level as a key base. If momentum continues, $25–27 becomes the next upside objective while $23.5 remains critical as invalidation.

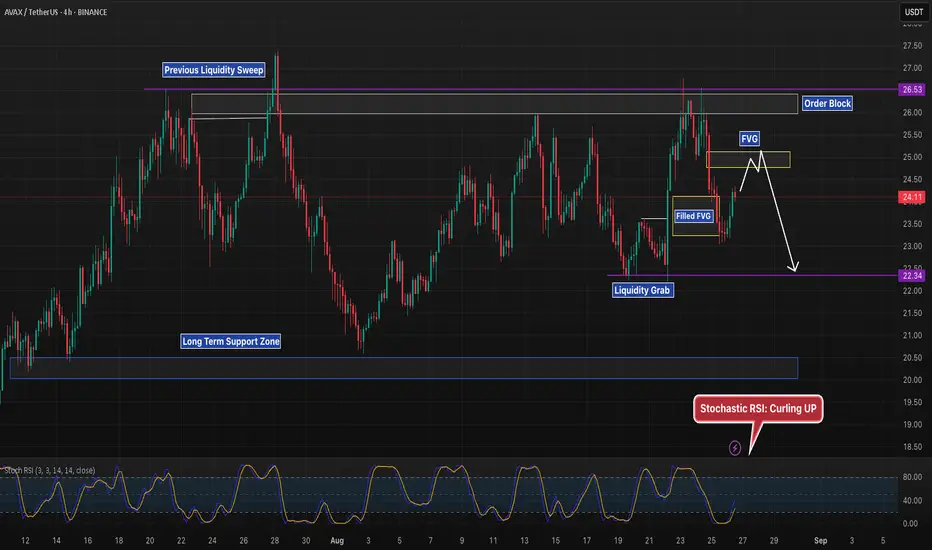
AVAX 4H – Liquidity Grab Into Support, Momentum Turning?Avalanche has completed a liquidity grab near 22.34 before bouncing, with Stoch RSI now curling up for momentum support.
Key levels on watch:
Upside: If price reclaims through the filled FVG, continuation into the next FVG and order block around 26.5 is possible.
Downside: Failure to hold could drag price back into the liquidity grab level and long-term support zone below.
The reaction from this filled FVG, paired with momentum curling, will determine whether AVAX trends higher or retests deeper support.
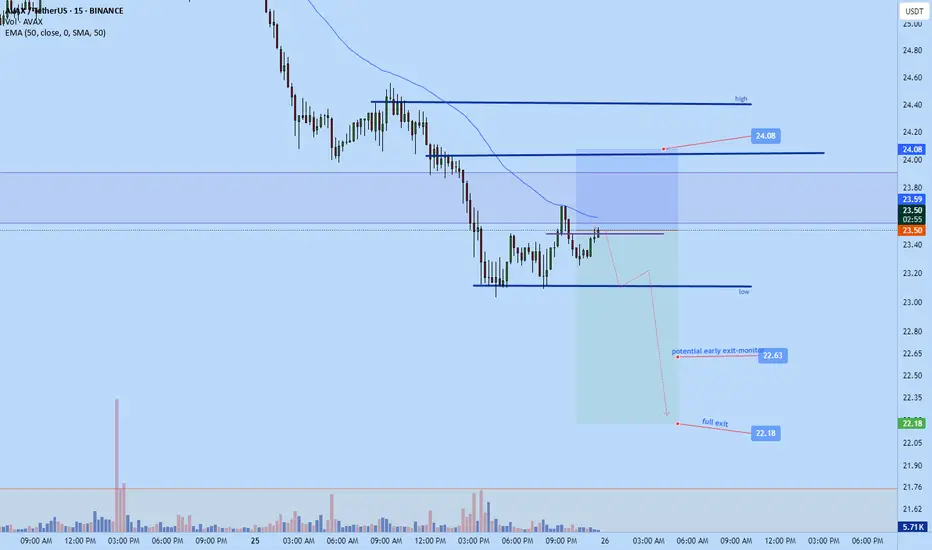
avax short to $22.18 today Just recently opened up a short on avax.
Sl: 24.08
tp: 22.18
Potential early closure around $22.63
LEt's see how it goes
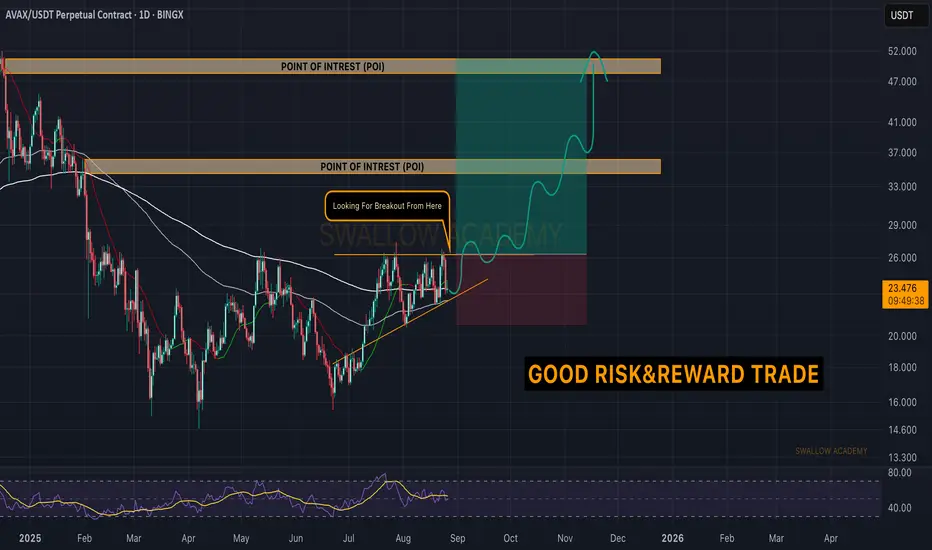
Avalanche (AVAX): Good Risk & Reward Trading SetupWe are getting ready for a potential favorable R:R buy trade where AVAX is forming some kind of triangle pattern, which is indicating an upcoming zone of pressure, which could lead to a breakout of smaller resistance (on smaller timeframes) and then a favorable upside movement.
AVAX is still pretty low for it's value so we are looking for 90% growth here.
Swallow Academy
AVAX/USDT Price Prediction -1D**** Yousef Sharafi ****
In the 1D time frame, a Symmetrical Triangle pattern is forming on the chart.
The probability of a downside breakout appears to be higher.
Follow me here for more analysis
AVAX/USDTAVAX remains in consolidation both locally and on the higher timeframe. A weekly FVG has been marked as a potential reaction zone, which would also align with a deviation below the range.
Entries only after confirmation on lower timeframes.

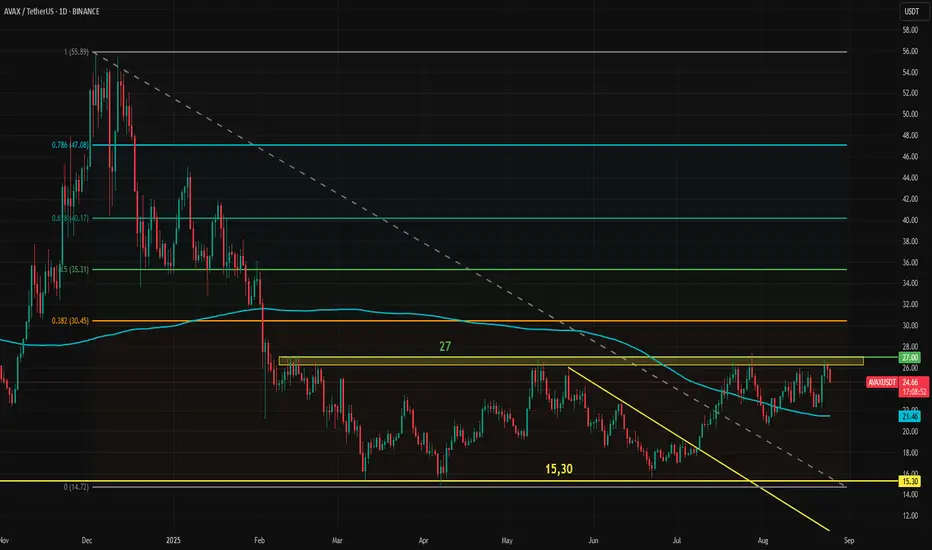
The Terror of 27 Hit Avax Once Again!Avax surged with Powell’s Jackson Hole speech, tested 27 once again, but was rejected at resistance once more. The “terror of 27” continues, but hard horizontal resistances like this can offer major buying opportunities once broken. Gold’s move from 3000 to 5000 and Ethereum’s unfinished breakout above 4000 toward an open target are prime examples. The key will be timing and protection against false breakouts.
As for Powell, the new “curious balance” in the jobs market opened the door to a September cut, but markets have not yet focused on the hawkish framework changes. The shift away from FAIT ( )could prove even more hawkish in the long term. If there is no sharp deterioration in the jobs market, traders should not expect fast rate cuts after September.
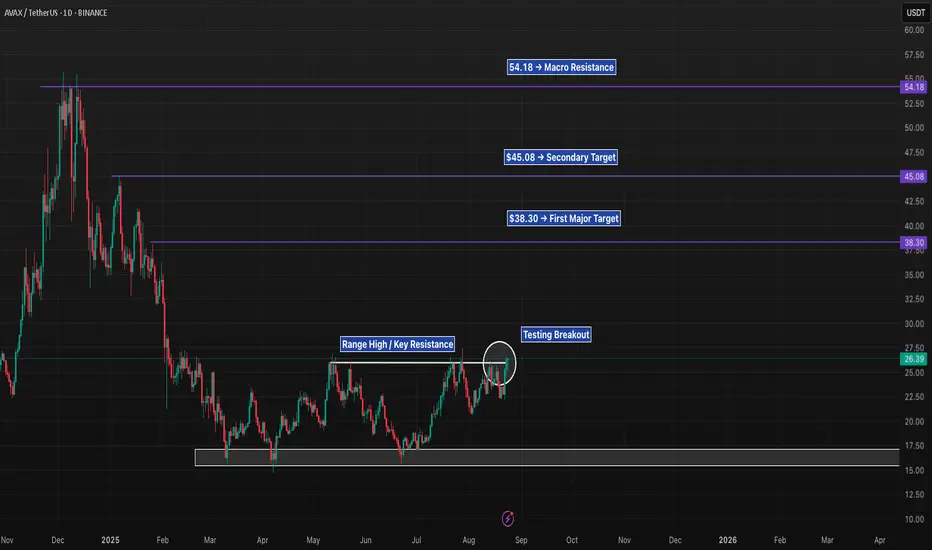
AVAX 1D – Testing Range Highs, Breakout Toward $38 Next?Avalanche is pressing against the $26 range high, a level that has capped price action multiple times throughout 2024–2025. Current price action shows a possible breakout attempt, with momentum building on the daily timeframe.
Bullish case: If AVAX confirms above $26, upside targets open toward $38.30, then $45.08, with a macro resistance zone sitting around $54.18.
Bearish case: A rejection here would likely send price back toward the $15–18 accumulation zone, which has acted as strong support historically.
The Stoch RSI is elevated, suggesting buyers are in control — but extended readings may also bring short-term volatility before continuation.
Avax long to $27.5 soonavax long
Aggressive entry
Tp area: $27.35- $27.5 🎯
Sl: 25.39
Caution. I entered without confirmation so drawdown is to be expected but I think overall setup is high probability and stop likely good enough. 1hr internal HL holding. If broken I probably just early exit and wait for confirmation.
