AVAX/USDT — Symmetrical Triangle Approaching Breakout?Overview:
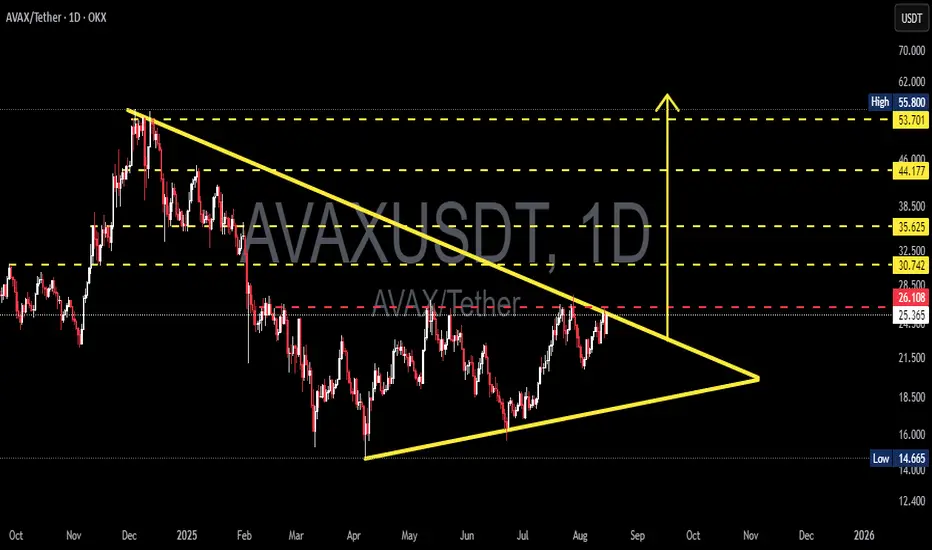
The daily chart shows AVAX forming a symmetrical triangle (converging trendlines) since the Dec–Jan peak. Price is now testing the upper resistance trendline (~26.1 USDT) — we’re at a critical point heading toward the apex (late September). Volume behavior and a confirmed daily candle close will be key to determining the breakout direction.
---
1) Pattern Description
Pattern: Symmetrical Triangle — characterized by lower highs (descending resistance line from the peak) and higher lows (ascending support line from the April bottom). Price range is narrowing → volatility dropping → usually leads to a strong move when the pattern resolves.
Context: The broader trend before the triangle was bearish (drop from ~55.8). Symmetrical triangles can be neutral but often resolve in the direction of the prior trend — technical confirmation is essential.
---
2) Key Levels (from chart)
Upper resistance trendline / critical level: ~26.10 USDT (red dashed line), current price ≈ 25.3 USDT.
Major resistance targets: 30.74, 35.62, 44.18, 53.70 – 55.80.
Ascending support trendline: around 18–22 USDT depending on timing.
Structural low: 14.665 USDT (chart low).
(Values estimated visually from chart — verify with live data before trading.)
---
3) Bullish Scenario (if breakout upward)
Bullish Trigger
Daily close above descending trendline (~26.1) with strong volume → breakout confirmation.
Preferably supported by bullish technical indicators (RSI, MACD bullish crossover, rising OBV).
Targets
Step targets: 30.7 → 35.6 → 44.2 → 53.7 (partial profit-taking recommended).
Measured move theoretical target:
− Height ≈ 55.800 − 14.665 = 41.135.
− Added to breakout point (~26.108) → theoretical target ≈ 67.24 USDT (for reference, not guaranteed).
Risk Management
Stop-loss: daily close back below breakout trendline or under nearest swing low (e.g., conservative SL < 21–22 USDT).
Strategy: scale in — partial entry before breakout, add after confirmation. Monitor risk/reward closely.
---
4) Bearish Scenario (if rejected / breakdown)
Bearish Trigger
Rejection at upper trendline + bearish daily candle (and/or rising sell volume) → drop to ascending support.
Breakdown confirmation: daily close below ascending trendline with strong volume.
Targets
Initial drop to ascending support ~18–22 USDT.
If breakdown continues → possible retest of 14.66 USDT low.
Risk Management for Shorts / Cut-loss
SL for shorts: daily close above resistance (~>28 USDT) or above fake breakout highs.
Beware of bull traps — volume confirmation reduces risk.
---
5) Practical Trade Plans (example)
Conservative Long: Wait for daily close > 26.1 + strong volume → enter 50% position; add after retest. Targets: 30.7 / 35.6. SL under retest zone (~21–22).
Conservative Short: If clear rejection at upper trendline → short toward lower trendline. SL above recent high (~28).
Range Trading: Buy near lower trendline, sell near upper trendline until breakout confirmed.
---
6) Risk & Confluence Checks
Broader market/Bitcoin sentiment: AVAX is often correlated, which can amplify moves.
Supporting indicators: check volume, RSI, MACD, EMA(50/200) for confirmation.
Watch for false breakouts — confirm with volume + retests.
---
7) Summary
> AVAX is forming a Symmetrical Triangle. Critical resistance at ~26.1 USDT — daily close + volume will decide the next move. Valid breakout → step targets at 30.7 / 35.6 / 44.2 (measured move theoretical ~67.2). Rejection / breakdown → support at 18–22 and possible drop to 14.66. Manage risk with confirmation, stop-loss, and partial profit-taking.
#AVAX #AVAXUSDT #Crypto #TechnicalAnalysis #Triangle #Breakout #SupportResistance #Altcoin #SwingTrading
Trade ideas
AVAX/USDT – WeeklyTracking 2 scenarios:
1️⃣ ABCDE Triangle – Currently in wave E. Break above $42.88 could trigger breakout. and triangle will be invalidated
2️⃣ Impulsive (Blue 1–5) – Possible wave (2) completed, upside targets $71.76, $106.93, $159.10, $251.87.
well all in all I'm looking for upside but we have to be cautious
Key Levels: Support $24.07–$25.00, Resistance $29.13, $36.84.
Breakout = bullish continuation, rejection = triangle completion.

AVAX alt season Huge potential for Avax with a multi year symmetrical triangle large high timeframe monthly rsi stoch crosses and the 3w RSI moving above the WVMA targets are up around the $200

AVAX/USD Trading IdeaI have been watching its structure for 3 months, aiming for the $42-$48 range. First, we need a breakout through the mid range at $26-$27, a massive resistance holding us back. Could this setup fail? Absolutely. DYOR

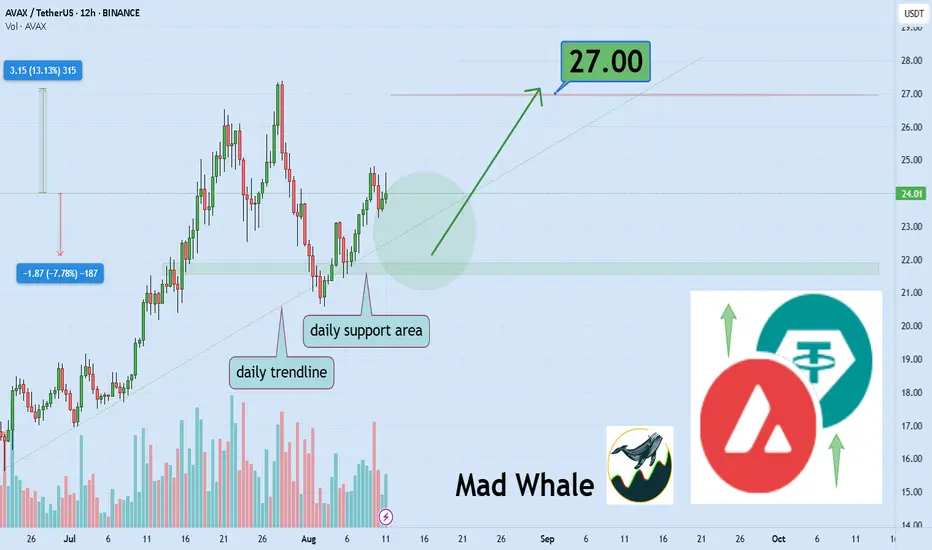
AVAX Technical Setup Signals 13% Upside Target $27Hello✌️
Let’s analyze Avalanche’s price action both technically and fundamentally 📈.
🔍Fundamental analysis:
Avalanche’s July Octane upgrade cut C-Chain fees by 98% and boosted daily transactions 170% to 10.1M. New subnets, like FIFA NFTs and VanEck’s $100M RWA fund, could lift AVAX demand. 🚀
📊Technical analysis:
BINANCE:AVAXUSDT is holding a strong daily support and a key monthly trendline 📊. If these levels hold, a 13% upside toward $27 looks likely 🚀.
✨We put love into every post!
Your support inspires us 💛 Drop a comment we’d love to hear from you! Thanks, Mad Whale
Avalanche (AVAX): Expecting a Good Buy-side Movement | CME GAPAvax looks strong;after the break of 200 EMAs, we switched the trend and with the recent retest of that same EMA, we are seeing good buyside dominance.
What actually caught our attention here is that huge CME gap that we formed in the beginning of February, which we intend to fill very soon!
Swallow Academy

AVAXUSDT ( You think it’s out of mind , But you have to believe Hello dear traders.
Good days.
First of all thanks for your support and comments.
————————————————————————
Sometimes numbers are enormous and fist think which come in your mind is , oh my god it’s crazy . You could not believe crypto market will grow up this much ever .
But it’s real and you have to believe it .
AVAXUSDT on weekly Gann square could hold price above 0.5 Gann price zone which is a great signal for future .
End of Daily bearish Gann Square box exactly matched with weekly Gann reversal time zone and as you can see on longe term price form and wedge and collect spring for breaking up and experience new ATH .
Hope to analysis be helpful for you .
Good luck and safe trades.

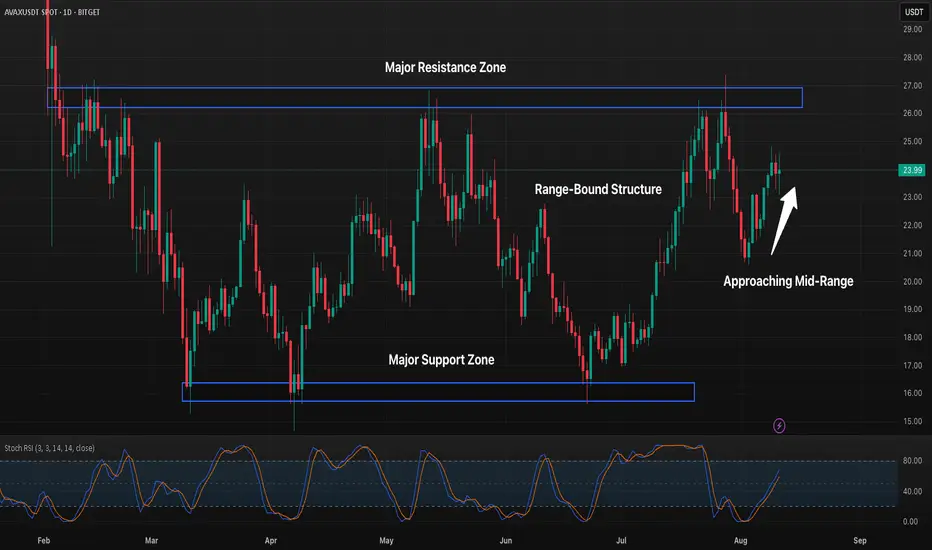
AVAX 1D Trading Mid-Range, Will Bulls Push Toward Resistance?Avalanche continues to respect its long-term range, with price currently rebounding from the $16 support zone toward the mid-range near $21. The upper boundary around $26–27 has repeatedly acted as a strong rejection point, while the lower $15–16 zone has provided reliable support. A daily close above mid-range would strengthen the case for a move toward the highs, while failure to hold could see a return toward range support.
Avalanche (avax)Avax usdt Daily analysis
Time frame daily
As you see on the chart , if decrease of avax stops on 17.5 $ the pattern (double bottom)will create.
So we will see the end of decreasing and avax will reach to 25$
On the other hand , if price breaks down and reach 15 EURONEXT:OR less , this pattern will failed

AVAXUSDT AVAX Ready to Fly!!AVAXUSDT AVAX Ready to Fly!!
BINANCE:AVAXUSDT has broken out from resistance and found support at previous lows. This setup is looking strong and could mirror ETH’s bullish moves.
The major hurdle now is around $27. A breakout above this level could trigger a strong rally with significant upside potential.
Always manage your risk and keep a stop loss in place, the sky is the limit once $27 is cleared.
BINANCE:AVAXUSDT Currently trading at $23.5
Buy level : Above $23
Stop loss : Below $21
Target 1: $24.5
Target 2: $27
Target 3: $31
Max leverage 5x
Always keep stop loss
Follow Our Tradingview Account for More Technical Analysis Updates, | Like, Share and Comment Your thoughts

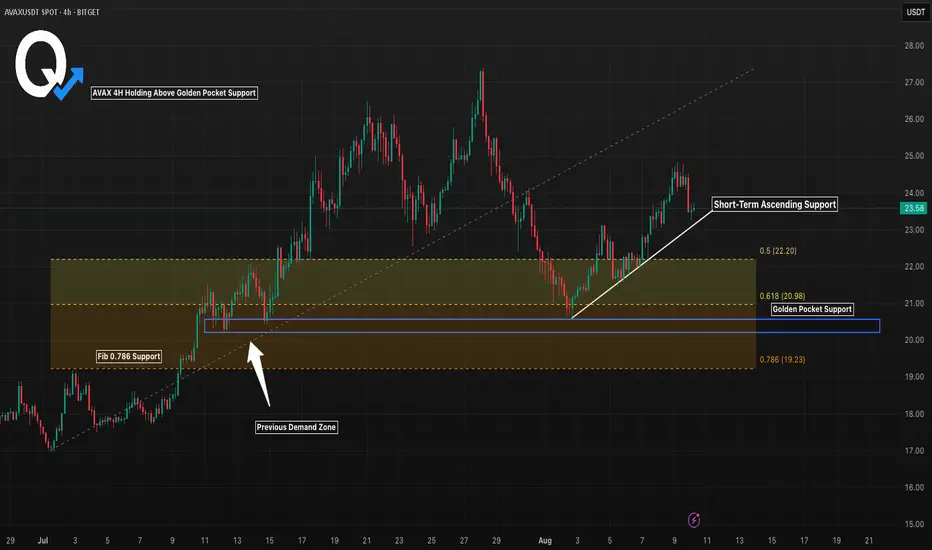
AVAX 4H Holding Above Golden Pocket SupportAVAX is holding above short-term ascending support after rebounding from the 0.5–0.618 Fibonacci retracement zone. The highlighted golden pocket aligns with a prior demand zone, adding confluence for bulls. A break below $22 could open the door to deeper retracement toward the 0.786 level at $19.23, while holding here could set up another push toward $25+.
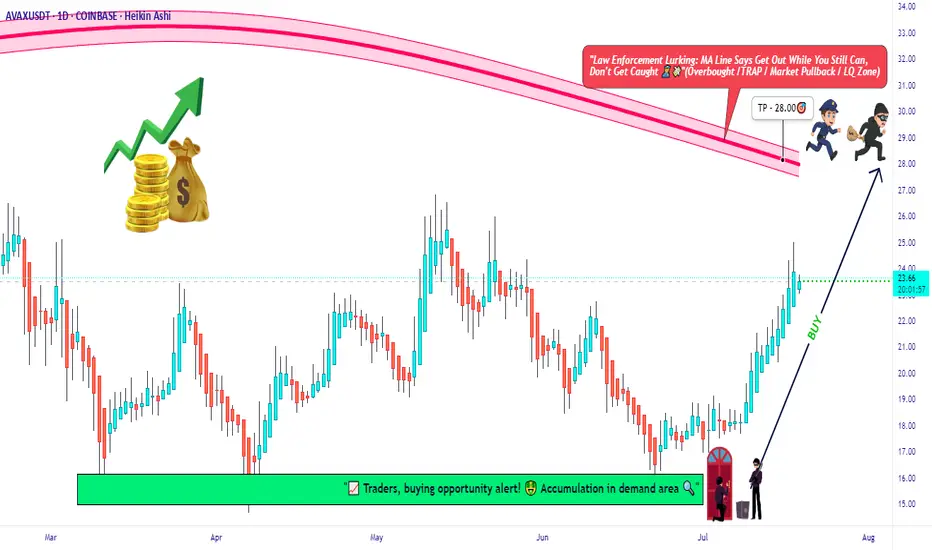
AVAX Long Only | Moving Average Trap Heist in Action🧨“Avalanche Crypto Vault Break-In 💣 | Thief Trader’s Long Playbook”⚔️💸🚀
(AVAX/USDT Crypto Heist Plan – Swing/Day Trade Blueprint)
🌍 Hi! Hola! Ola! Bonjour! Hallo! Marhaba! 🌟
Welcome, Money Makers, Market Pirates, and Chart Snipers! 🤑💰💼✈️
This ain’t just another setup — this is a strategic crypto ambush on AVAX/USDT, cooked up with the 🔥 Thief Trading Playbook 🔥. We're planning a clean, no-fingerprint heist into the Red Moving Average Zone. That’s the liquidity vault, and yes — the police (market makers) are watching 👮♂️🚨... but so are we. Stay sharp. 💼🔦
💥 Mission Objectives:
🎯 Entry Point (The Infiltration Point)
"The vault's wide open! Swipe the Bullish loot at any decent price" 📈
Smart thieves wait for pullbacks on the 15m or 30m chart to plant their limit orders near swing lows/highs. Use layered orders (DCA style) to scale in like a pro. 💣🔁
🛑 Stop Loss (Your Getaway Exit)
Secure your trade. SL at the nearest wick low/high on the 1D timeframe (around 21:00 candle).
Your SL = your personal risk code. Choose it based on lot size & how deep you're inside the vault. 🎭🚫
🏴☠️ Take Profit Target (The Treasure Room)
🎯 Target: 28.00 USDT
...or escape early if the heat (volatility) gets too intense. Protect the bag. 💼💰
⚡ Special Note for Scalpers:
🧲Only operate on the Long Side.
If you’ve got deep pockets, smash in directly. Otherwise, ride with swing bandits. Use trailing SL to secure stolen profits. 🧨📉📈
🔍 Market Heat Map & Rationale:
The AVAX/USDT setup is flashing bullish strength, backed by:
🧠 On-Chain Metrics 📊
💡 Market Sentiment
📰 Macro Catalysts
🌐 Intermarket Synchronicity
📡 Go grab the full breakdown on:
⚠️ Red Alert: News Zones Ahead! 📰🚫
Avoid fresh trades during high-volatility news releases.
Lock in gains with trailing SL. Risk management is not optional — it’s the escape vehicle. 🚗💨
📝 Legal Talk (Don’t Skip):
This isn’t investment advice. Just a well-planned blueprint from a market thief.
You're responsible for your own loot and losses. 🎭📉📈
❤️ Boost the Brotherhood 💥
Smash the 🔥BOOST BUTTON🔥 if you found value.
Every boost powers our Thief Trading Gang’s next big score. 🚀💸
Stay tuned for the next heist plan. I’ll be back with more charts, more loot, and less mercy. 🐱👤📊💥
avaxusdtThe Avaxusdt is in the two areas, one of the supports is 618, the corrective wave before, and one is dynamic support. If supported, it can rise to 0618.

AVAX/USDT Long Opportunity – Bullish Setup Developing!AVAX is currently forming a potential bullish reversal on the 4H timeframe. Price recently bounced off the strong demand zone between $20.70 – $21.35, where previous support held and buyers stepped in aggressively.
🔍 Technical Breakdown:
Support Zone: $20.70 – $21.35 (Strong demand zone highlighted in orange)
Current Price: $22.10 (slightly above support, indicating bullish interest)
First Target (TP1): $24.01 (minor resistance and previous structure level)
Second Target (TP2): $26.25 – $27.00 (major supply zone; high probability reaction area)
✅ Confluences:
Clean bullish structure forming off demand zone
Volume profile (LuxAlgo VRVP) supports the bounce
Higher low confirmed on the 4H
Strong imbalance above, price likely to fill it
📌 Trade Idea:
If momentum continues and price stays above $21.35:
Entry Zone: $21.90 – $22.20 (current range)
SL: Below $20.70 (beneath demand zone)
TP1: $24.01
TP2: $26.25+
🧠 Notes:
Watch how price reacts at $24.01; breaking this confirms bullish strength.
The $26.25 area is a historical supply zone, so consider partial profits here.
Maintain good risk management; crypto remains volatile!
🟢 Bias: Bullish

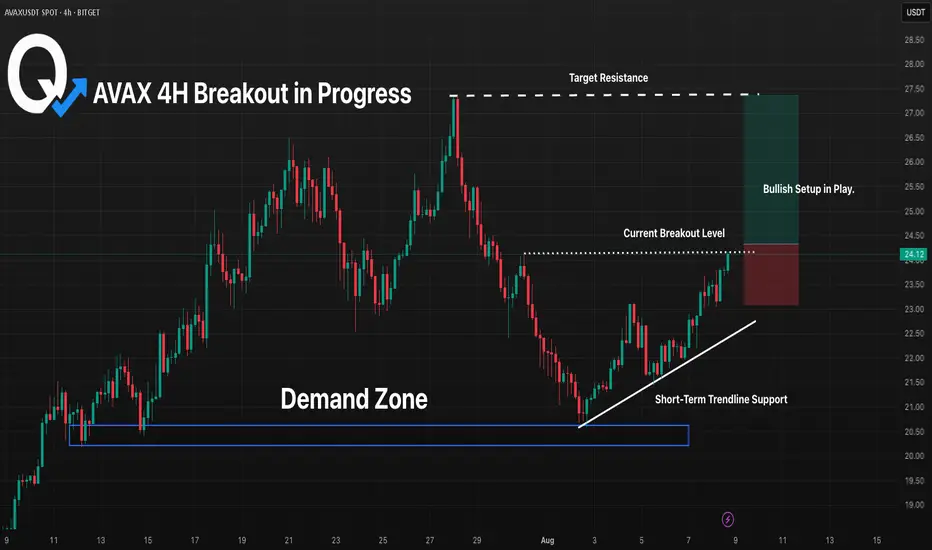
AVAX 4H Breakout in Progress, Will Bulls Push Toward July Highs?AVAX has broken above short-term resistance around $24, with buyers showing strength off the trendline support. The setup points toward the July highs near $27 as the next major target if momentum holds. A sustained close above $24 could confirm bullish continuation, while a failure to hold would shift focus back toward the $21 demand zone. The risk-to-reward remains attractive for trend-following setups.
Buy Trade Strategy for AVAX: Tapping into High-Speed DeFiDescription:
This trading idea highlights AVAX, the native token of the Avalanche blockchain, known for its high-speed transactions, low fees, and scalable infrastructure. AVAX powers a robust ecosystem that supports decentralized finance (DeFi), NFTs, and Web3 applications, making it a strong contender in the competitive smart contract platform space. With its unique consensus mechanism and growing list of partnerships, Avalanche has attracted developers and users seeking efficient and eco-friendly blockchain solutions. The increasing adoption of AVAX in DeFi protocols, cross-chain interoperability, and institutional interest reinforces its long-term growth potential.
Still, the cryptocurrency market remains highly volatile, with AVAX’s price influenced by market sentiment, regulatory shifts, and broader economic conditions. Proper risk management and awareness of potential downsides are essential when considering positions in AVAX.
Disclaimer:
This trading idea is for educational purposes only and should not be taken as financial advice. Trading cryptocurrencies like AVAX carries substantial risks, including the possibility of losing your entire investment. Always conduct independent research, evaluate your risk tolerance, and consult with a licensed financial advisor before investing. Past performance does not guarantee future results.
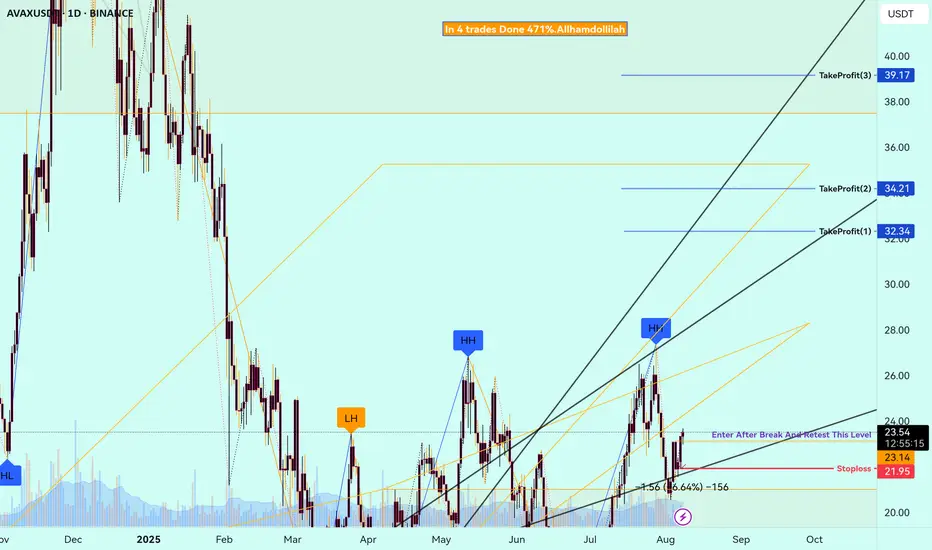
AVAXUSDT – potential swing tradewith a risk factor of 2.59 Avax is ready to take an upward ride with a potential 50% fib retracement target at least.
Disclaimer: Not financial advice – just sharing my market outlook. Always manage risk and do your own research before taking trades.
💡 Educational Note: For sharper precision, drop to 4H or 2H charts and identify the latest ChoCH (Change of Character) and BoS (Break of Structure) before entering. This helps align with the momentum shift and avoid premature entries.

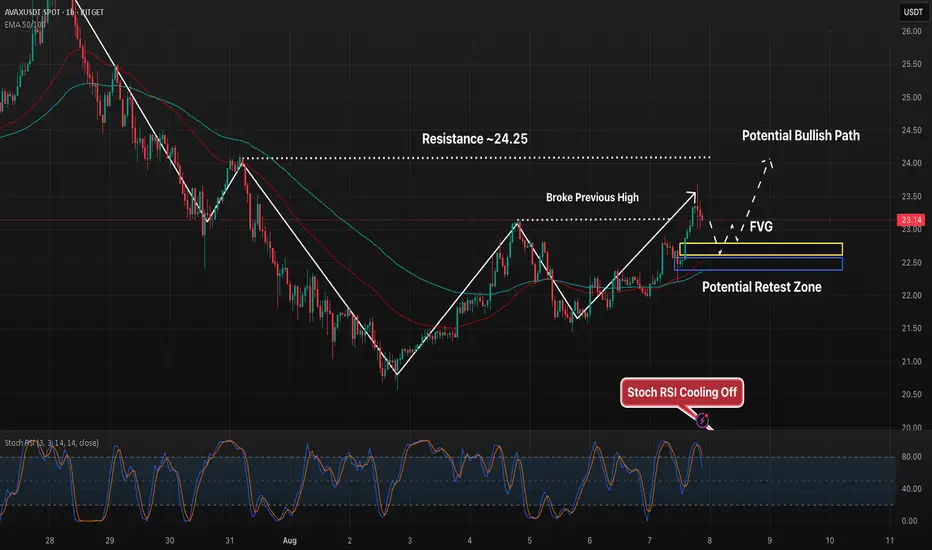
AVAX 1H – FVG Retest Lining Up, But Will 24.25 Cap the Move?Avalanche broke above a prior swing high and filled upside space before pulling back toward an unfilled Fair Value Gap (FVG) in the 22.8–23.0 range. This zone aligns closely with EMA support and prior structure, making it a key short-term decision point.
If buyers step in here, the next upside target remains the 24.25 resistance — a level that has capped price action in the past. A failure to hold the FVG zone could open the door for a deeper retrace into the 22.2–22.3 support area.
Key watchpoints:
– FVG retest at 22.8–23.0 for potential bounce
– Overhead resistance at 24.25
– Stoch RSI cooling off from overbought, allowing room for a fresh leg higher
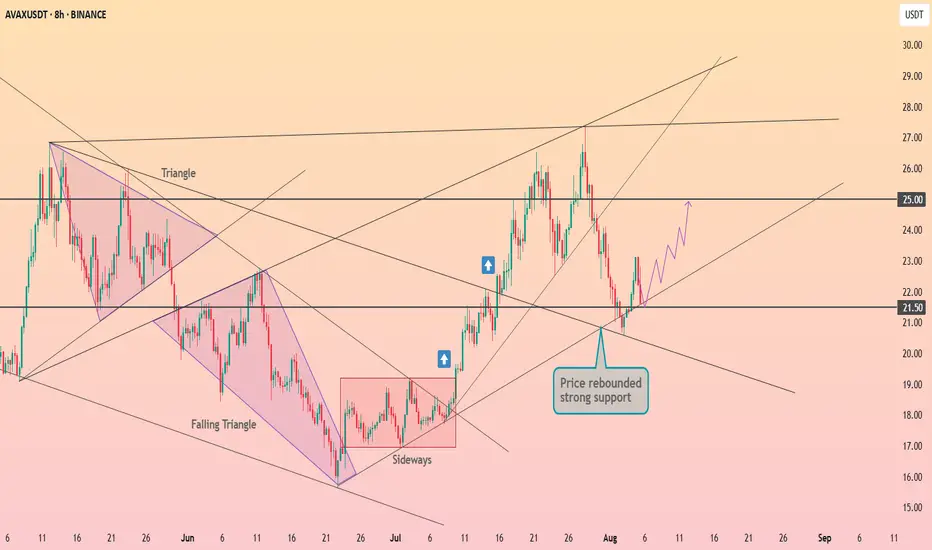
Avalanche will retest the $21.5 level ┆ HolderStatBINANCE:AVAXUSDT bounced sharply from the $21.50 support, confirming the level as a pivot zone. Previous breakout patterns remain intact, and the current price action indicates potential for a move toward $25.00 resistance if buyers maintain control.
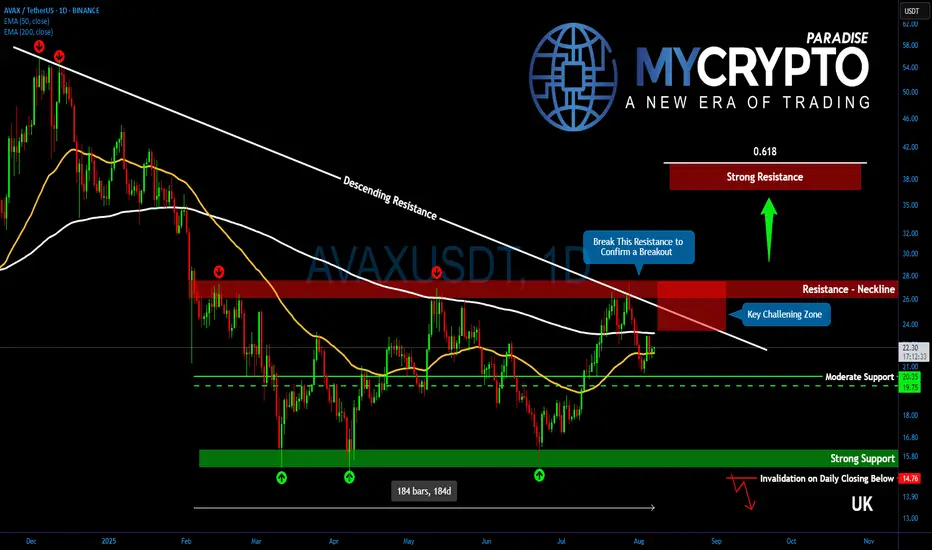
AVAX Has Been Quiet for Too Long! Don’t Miss What Comes NextYello, Paradisers! Have you been ignoring #AVAX because of its sideways chop? That might be a costly mistake, because what’s forming now could be the foundation of a major trend reversal that catches most traders completely off guard.
💎After an extensive downtrend, AVAX has been trading sideways for nearly 184 days, signaling the market is in accumulation mode. This long consolidation is beginning to take shape as a possible reversal base, and when it breaks, it could break hard.
💎Right now, #AVAXUSDT is battling a complex resistance zone between $23.50 and $27. This region is packed with overlapping technical barriers, many of which date back to December 2024, adding to its significance. It's a make-or-break zone.
💎Once $27 is broken with strong volume confirmation, the stage will be set for a powerful breakout, with upside potential targeting the next major resistance between $36 and $39.20. This zone aligns perfectly with the 61.8% Fibonacci retracement, which is historically where larger moves tend to conclude or stall.
💎On the downside, support remains solid between $20.30 and $19.75. This band has been a reliable support/resistance flip during the range and continues to act as the primary defense zone.
💎Adding fuel to the bullish outlook is the potential golden cross formation between the EMA 50 and EMA 200. If this confirms, it would add serious momentum to any breakout and attract trend-followers back into the market.
Paradisers, strive for consistency, not quick profits. Treat the market as a businessman, not as a gambler.
MyCryptoParadise
iFeel the success🌴
AVAX 4H – Trendline Capped Every Rally, But Can Bulls Break?AVAX continues to be suppressed by a long-standing macro downtrend line that has rejected every major rally since December. The current structure shows three critical interactions with the same horizontal zone: the original breakout, a failed reclaim, and the most recent rejection near $28.
Unless AVAX can flip the trendline with volume, the trend remains technically bearish. That said, price is still holding higher lows and has avoided a full breakdown toward major support at $14–16.
This is a textbook compression between higher timeframe resistance and major support — expect volatility ahead.
Key areas:
– $28–30 = major horizontal + trendline confluence
– ~$14 = last clean demand zone
– Flip = breakout potential to ~$33+
– Fail = sweep of support possible
Wait for the reaction — this is where bias is defined.

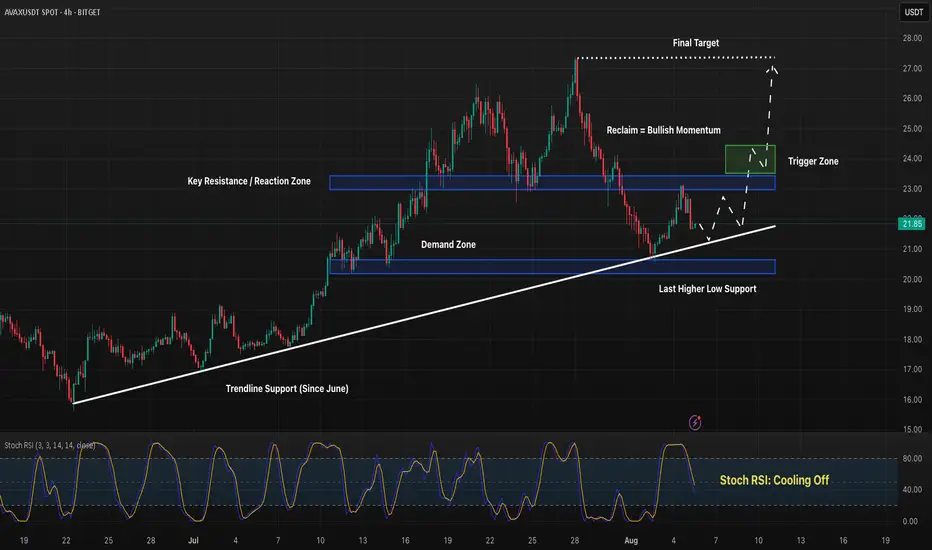
AVAX 4H – Support Retest Underway, But Will the Trendline Hold?Avalanche is approaching a high-stakes support cluster — with ascending trendline support and a previous demand zone lining up perfectly. After a sharp move down from the $26 highs, bulls are watching closely to see if this higher low structure can hold.
🔹 Key Structure & Zones
Price is consolidating between the $20–$23 range.
The mid-level supply zone around $22.80 has repeatedly rejected price — a reclaim would flip structure bullish again.
The white trendline has been respected since late June and is lining up with key support — this is a textbook decision point for trend continuation.
🔹 Momentum Check
Stoch RSI is near oversold, priming for a bounce setup.
Bullish case: higher low → reclaim $23 → push toward $26.30 and possibly $27+.
Bearish case: trendline break → revisit the lower $20 demand box.
🔹 Scenario to Watch
Entry setups may emerge on wick into the trendline with momentum curling up.
$23 is the key short-term reclaim level — above that, momentum could accelerate fast.
Will this structure hold and launch the next leg up — or is AVAX setting up for a deeper flush?
Let’s talk setups 👇
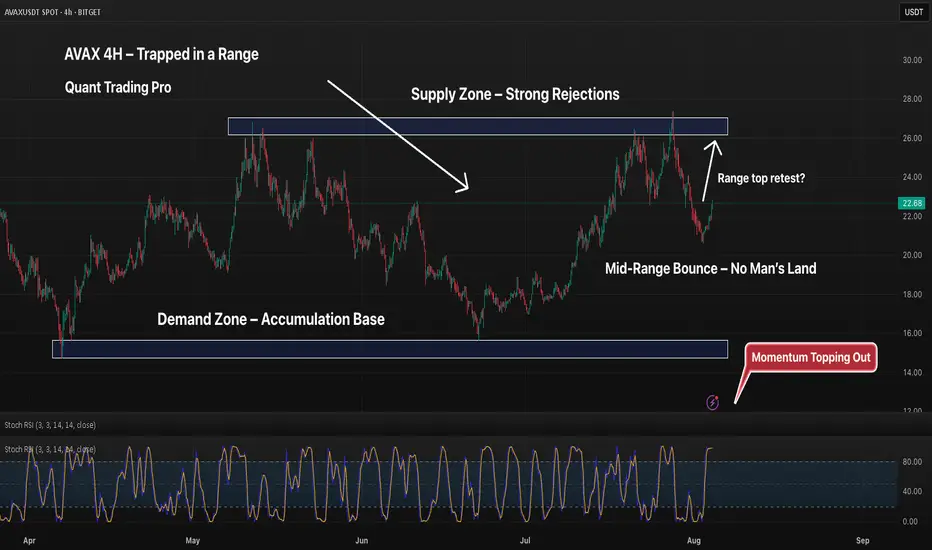
AVAX 4H – Range-Bound Between Supply and Demand, Can It Escape?AVAX has been locked in a well-respected range for months, bouncing cleanly between a strong supply zone around $26–$28 and a well-established demand zone near $15–$17. Each visit to either extreme has resulted in sharp reversals, signaling a balanced market stuck in accumulation/distribution.
Currently, price has bounced from mid-range and is approaching the upper half — but with Stoch RSI entering overbought, bulls may face short-term exhaustion.
📉 Key Levels:
– $26–$28: Heavy supply / previous double rejection zone
– $15–$17: Accumulation base that triggered two rallies
– $22.5–$23.5: Mid-range turbulence with no clear bias
⚠️ Until price breaks either extreme with conviction, range trading logic applies: fade extremes, avoid the middle chop, and wait for expansion.
Breakout traders: Stay patient.
Range traders: Eat well.
👇 Let me know if you're playing the bounce or waiting for the break.