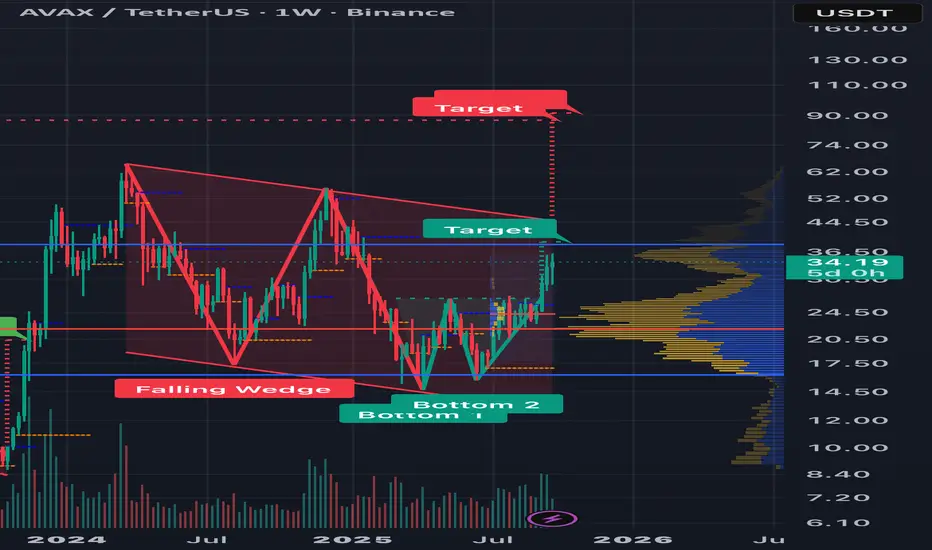
Avalanche AVAX price analysis🔴 Do you think that the price of CRYPTOCAP:AVAX has bottomed out and is completing a "double bottom" pattern?
📉 Will there be another downward movement in the price of OKX:AVAXUSDT , for example to $14, followed by the long-awaited upward trend?
Either way, in both cases, there is every chance that the price of the #Avalanche token could reach $45 by the end of 2025.
P.S:
The price of #AvaxUSD is moving nicely along the established channels — take advantage of this and make a profit!
_____________________
Did you like our analysis? Leave a comment, like, and follow to get more
Trade ideas

Will Avalanche buyers step in now for an 18% move? toward 33.5Hello✌️
Let’s analyze Avalanche’s price action both technically and fundamentally 📈.
🔍Fundamental analysis:
Big funds just asked for an AVAX spot ETF. If approved, it could bring new money in, like what happened with Bitcoin’s ETF.
But if regulators delay, AVAX price might just stay flat for longer.
📊Technical analysis:
BINANCE:AVAXUSDT is currently trading near a significant daily support level in confluence with a well-established trendline; if this zone holds, the setup suggests a possible upside move of around 18% toward the 33.5 level. 📊🚀
📈Using My Analysis to Open Your Position:
You can use my fundamental and technical insights along with the chart. The red and green arrows on the left help you set entry, take-profit, and stop-loss levels, serving as clear signals for your trades.⚡️ Also, please review the TradingView disclaimer carefully.🛡
✨We put love into every post!
Your support inspires us 💛 Drop a comment we’d love to hear from you! Thanks, Mad Whale

AVAX Bear Flag on 4 hourThe bounce to ~$30 did not take out the last 4H lower-high (~$30.6–$31). Until that breaks and holds, structure is still down.
This preiction is valid unless price closes above the flag’s upper trendline / last LH (~$30.6–$31). A breakdown from the flag puts the usual magnets back in play:
$28.40 (0.382) → lose it on a 4H close and the path opens to
$27.9 / $27.3
$26.0–$26.6 (0.5 + prior pivot)
If that fails: $23.6 (0.618).
Extreme measured-move risk from the full pole points toward $20–$21 (low-probability unless BTC/ETH crack).

AVAXUSDTThe price has reached a strong support zone, aligning with the 0.38 and 0.5 Fibonacci levels 👌
Targets:
Target 1: $40
Target 2: $52
Follow the chart; there is a good potential for profit.

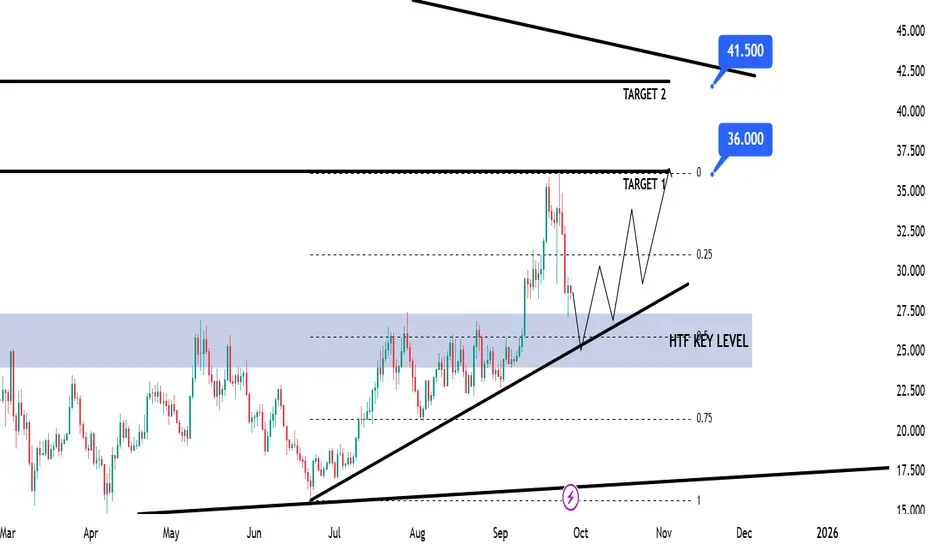
AVAX Swing Long Idea – TTKZD ModelAVAX Swing Long Idea – TTKZD Model
📊 Market Sentiment
FED has resumed its rate-cutting cycle, starting with a 0.25% cut in September, with two more expected. Institutional liquidity inflows have accelerated as the U.S. officially adopts crypto as part of its reserves. Despite elevated inflation, a weakening labor market is forcing the FED to ease, pushing more capital into risk-on assets.
📈 Technical Analysis
Price remains in a HTF bullish trend, signaling continuation potential.
Price broke the HTF Key Zone and closed aggressively above → strong buyer defense.
Supported by the HTF Bullish Trendline → potential retest & rejection.
Approaching the Fibonacci 0.5 equilibrium (discount) → ideal for long positioning.
📘 Model to be used – TTKZD (Trendline + Key Zone + Discount)
In this model, we look for 3 confluences:
1-Clear HTF bullish trendline supporting structure
2-HTF Key Zone defense after aggressive break
3-Fibonacci 0.5 discount zone as entry alignment
📌 Game Plan
Price to test bullish trendline
Retest of HTF Key Zone
Confluence at 0.5 discount → long entry
🎯 Setup Trigger
12H Break of Structure → confirmation for entry.
📋 Trade Management
Stoploss: Below 12H swing low that creates BOS
Targets:
TP1 → $36
TP2 → $41.5
Move stop to breakeven after TP1.
💬 Like, follow, and comment if this breakdown supports your trading! More setups and insights coming soon — stay connected!
⚠️ Disclaimer: This content is for educational purposes only and does not constitute financial advice. Always DYOR before trading.
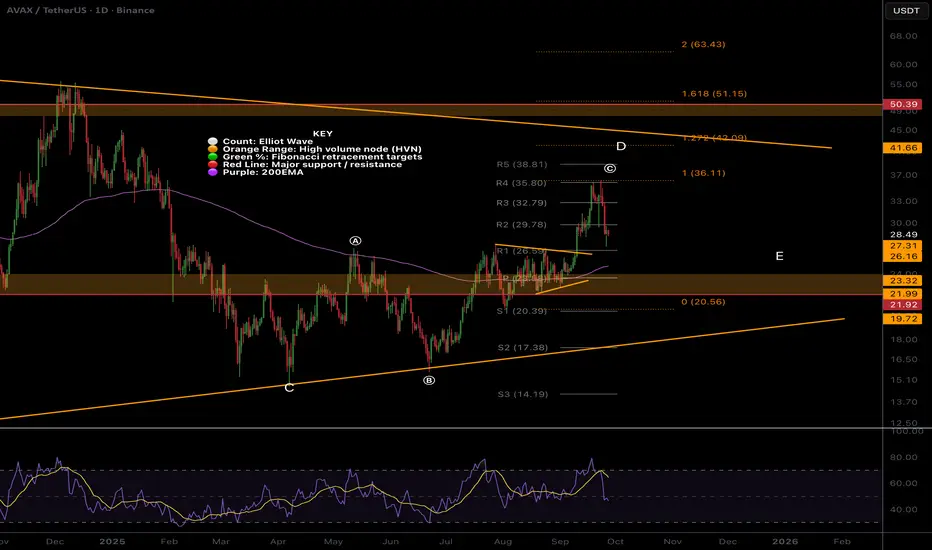
AVAX Local interior triangle completeMouthful ahead:
AVAX appears to have completed a triangle as interior wave (b) of (c) of the macro triangle wave D... sorry
(c) ended perfectly at the 1:1 ration of the (a) - (b) which is expected.
Wave E is underway with the triple support target of the daily 200EMA, pivot and High Volume Node.
Safe trading
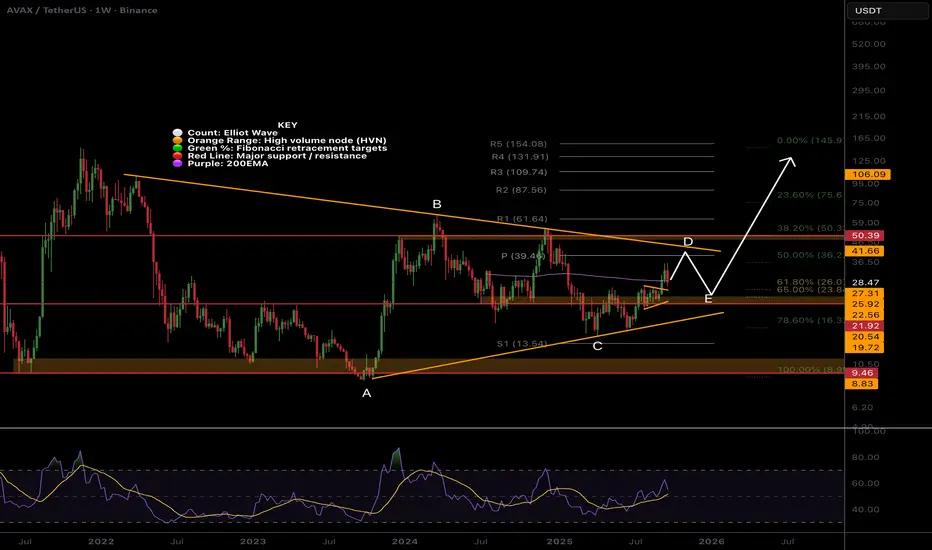
AVAX Macro Triangle?CRYPTOCAP:AVAX is printing a macro triangle similar to CRYPTOCAP:XRP did before it moved x10 in late 2024. The series of ABCs and Fibonacci depths gives this away.
Wave D could be complete but has not reached the resistance line and weekly pivot so I may have one more push up to go.
Wave E is expected to end at the weekly 200EMA to the High Volume Node as it doesn't test the support diagonal line by its characteristics.
This would also have triangle correction complete at the golden pocket adding confluence to the area.
Triangle pattern target is high and we could see a move to the R5 weekly pivot at $150 to test the all time high one more time.
Weekly RSI has bullish divergence from wave C.
Safe trading
AVAXUSDTAVAXUSDT have a uptrend and is now this trend because we have higher high and higher low.
Next Target is 45$ and best levels for buy: 31$ - 27$
⚠️Please control risk management.

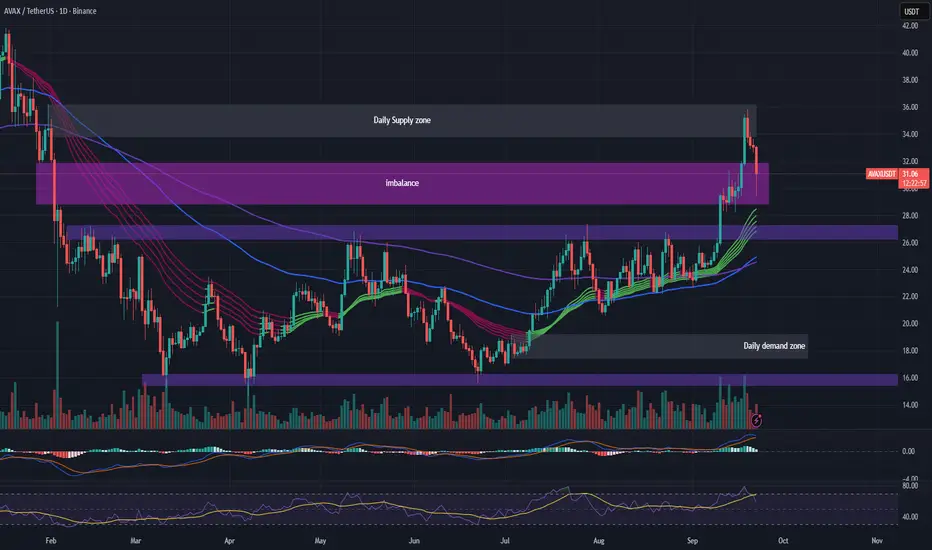
Short trade
Trade Overview
Pair: AVAXUSDT Perpetual
Type: Sell-side trade
Date: Tue, 23rd Sept 25
Session: London to NY session overlap
Entry: 33.712
Profit Level (TP): 29.69 (-12.15%)
Stop Level (SL): 34.999 (-3.85%)
Risk-to-Reward (RR): 3.0
Range: 2.796 USDT
Chart Structure
Supply Zone (Sell Zone): Marked in red & blue boxes around 34.5–36.0, showing multiple liquidity sweeps and failed attempts to push higher.
Demand Zones / Supports:
FVG (Fair Value Gaps): Multiple imbalances left during the bearish leg (highlighted in green rectangles).
Key Demand Zone: 29.6–30.2, acting as a magnet for price (also previous resistance turned support).
Narrative (Wyckoff / Smart Money Concepts)
Price swept liquidity at the 36.1 High, rejecting strongly.
Distribution occurred within the supply zone, leaving bearish FVGs overhead.
The sell entry at 33.71 coincides with rejection of a premium level (after a push into supply).
Market structure is now bearish, with BOS (Break of Structure) confirming downside momentum.
Targeting inefficiencies and demand at 29.6–30.2, in line with a higher-timeframe draw on liquidity.
Key Levels
Resistance / Supply: 34.7–36.1
Entry Zone: 33.7
Intermediate FVGs: 32.7 / 32.3 / 31.8
Support / Demand Zone: 29.6–30.2 (Range low).

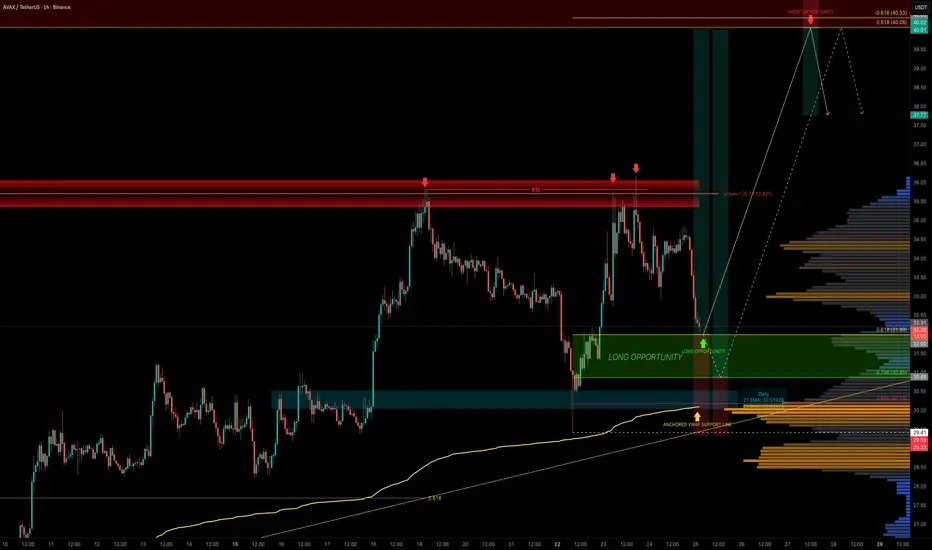
AVAX — Next Stop $40?AVAX has been one of the stronger high-cap performers recently, but the yearly open at $36 has proven to be a tough ceiling. Price has rejected this level three times already, each time offering short opportunities. This level also aligns with the 15B market cap, making it a key resistance zone.
Now, AVAX is retracing into a prime area for long setups, retracing part of the recent 5-wave impulse.
🟢 Long Entry Zone
0.618 Fib retracement: $32 → first bounce zone
0.786 Fib retracement: $30.85 → deeper entry opportunity
0.886 Fib retracement: $30 → highest confluence long entry
Invalidation: Below $29.41 (origin of the impulse)
Confluence at $30
The $30 level is the strongest support cluster, backed by multiple technical factors:
POC of this trading range
0.886 Fib retracement of the impulse
21 EMA/SMA (daily timeframe)
Anchored VWAP support
$30 psychological round number
0.618 Fib speed fan support
This makes laddering entries from $32 down to $30 the most optimal approach.
Targets
First Target: $36 yearly open → retest of major resistance (fourth attempt)
Main Target: $40 resistance cluster → 0.618 Fib retracement, negative -0.618 Fib extension
R:R: 1:3 up to 1:6 depending on entry
Educational Insight
When analysing trades, confluence is king. A single indicator may provide a signal, but when multiple tools align at the same level the probability of that zone holding increases significantly.
The $30 zone for AVAX is a great example of confluence stacking. This doesn’t guarantee success, but it gives traders a defined edge with a clear invalidation point. The same logic applies to resistance: at $40, multiple technical layers align, making it a high-probability take-profit zone.
Quick Take
AVAX is pulling back into a stacked support zone. With solid confluence at $30–$32, this zone sets up the fourth attempt at breaking the $36 yearly open resistance.
And as the saying goes in trading: the 4th touch often breaks. If it does, AVAX could quickly rally toward the $40 resistance cluster, where multiple confluences align.
Indicators used
DriftLine — Pivot Open Zones → For identifying key yearly/monthly/weekly/daily opens that act as major S/R reference points
Multi Timeframe 8x MA Support Resistance Zones → to identify support and resistance zones such as the Daily 21 EMA/SMA.
LuxAlgo — Liquidity Sentiment Profile (Auto-Anchored)
➡️ Available for free. You can find it on my profile under “Scripts” and apply it directly to your charts for extra confluence when planning your trades.
_________________________________
💬 If you found this helpful, drop a like and comment!
AVAX/USDT: Rebound from Trendline Support Signals Bullish ContinAVAX/USDT has rebounded from the upward trendline, reclaiming bullish momentum after rejecting support near 33.20. The price structure reflects an initial impulse leg, followed by a corrective pullback and a false break, before bulls regained control.
As long as price holds above the 33.00 support level, the market is likely to continue its push toward the 37.00 resistance zone and potentially beyond. The upward trendline continues to act as dynamic support, keeping the bullish outlook intact with momentum favoring further gains.

AVAX soon to Jump Accross the CreekAVAX shown here on a 15 minute time frame has been chopping a bit sideways, or what appears to be even a bull flag forming, but a closer look shows signs of a Wyckoff "Re-Accumulation" type of action that might be considered a "Jump The Creek" or "Jump Accross the Creek" formation (JAC)
JAC Confirmation Checklist
✔️ Spring in place? → Yes, the $33 sweep looks like it.
✔️ Volume expansion? → Uptick on the rally, yes.
✔️ Test of resistance? → Happening right now at $34.50–35.00.
❓ Convincing breakout + retest? → Needs a clean close above $35 with a retest that holds (not just a wick).
If we break below $34, this theory is invalidated.

AVAX - LONG after range!!AVAX - LONG after range!!
Trned is still up
OI rising
but we need clear range to use it a support zone

Lingrid | AVAXUSDT Trend Resumption Pattern Building ?The price perfectly fulfilled my previous idea . BINANCE:AVAXUSDT rebounded from the upward trendline after rejecting support near 33.20, reclaiming bullish structure. Price action shows an earlier impulse leg followed by a corrective move and a fake break before price regained momentum. As long as price sustains above 33.00, buyers may push toward the 37.00 resistance zone and higher. Overall, momentum favors continuation higher with the upward trendline acting as dynamic support.
⚠️ Risks:
Failure to hold above 33.00 could trigger a deeper retracement toward 30.50 support.
Broader market weakness or risk-off sentiment could weigh on bullish follow-through.
A strong rejection near 37.00 may signal exhaustion and invite profit-taking.
If this idea resonates with you or you have your own opinion, traders, hit the comments. I’m excited to read your thoughts!

Avax back on track.I’ve had a $90 target for Avax for a year now. It’s looking ready for at least $44 before a correction. Final targets are ATH. You gotta be in it to win it.
AVAX - DOUBLE TOP DAILY - REVERSAL INCOMINGCRYPTOCAP:AVAX - Daily Double Top in Play? 🐸📉
🔔 Called it live this morning
🧭 Structure: potential double top on the daily; bearish pressure building ⚠️
🔼 Resistance (R): $35.80–$36.00
🔽 Supports (S): $33.00 → $32.00 → $31.30 → $30.50 → $29.50 → $28.20
⏳ Likely path: consolidation chop for a few more weeks unless we see a decisive break

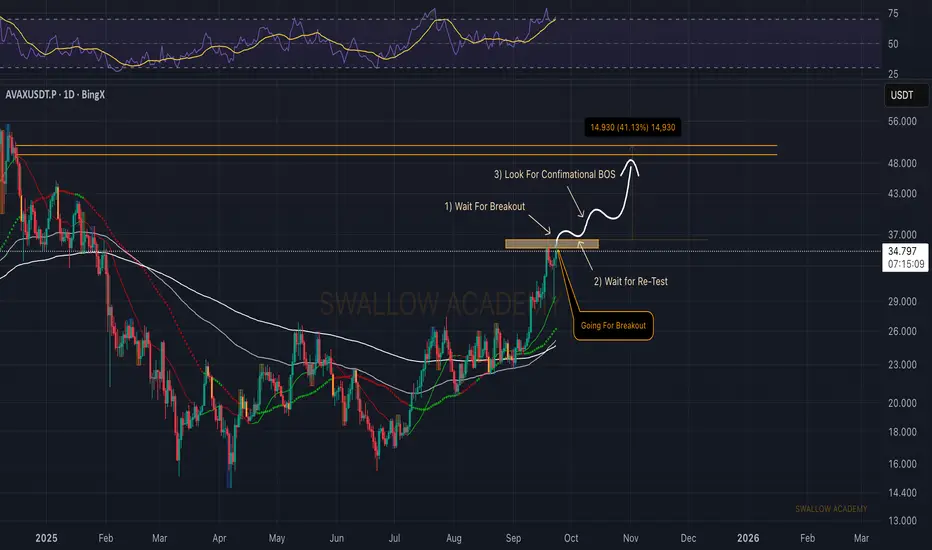
Avalanche (AVAX): Expecting Breakout | Good Bullish SetupAVAX is pressing on the breakout zone after a strong rally. What we need here is confirmation — first a clean breakout, then ideally a retest to secure this level. If buyers manage to hold, we’ll look for a BOS which should open the way towards the next target around $48.
Swallow Academy
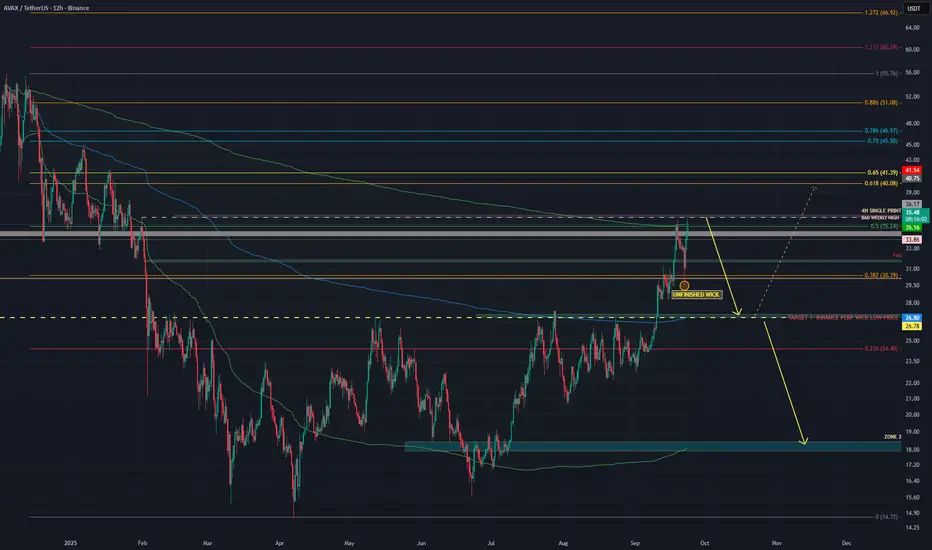
$AVAX – ARBITRAGE DUMP DETECTED – READY TO BALANCE?Traders,
Last time we nailed CRYPTOCAP:AVAX from 22.80 → 30 → 35 almost pixel perfect.
Now the setup may be flipping. Let’s break it down with the THETA method:
🔹 Imbalances
Perps vs Spot: Binance Perps wicked down to $26.83, Spot hasn’t filled it yet → liquidity gap below.
Market Profile: Price swept the 31 Jan weekly high, a “bad high” (too much excess, unstable).
Oscillators: RSI shows bearish divergences on multiple timeframes → momentum fading.
Context: Market is repairing imbalance above to build liquidity, which can later be used to fix the unfinished business below.
🔹 Order Flow & AVWAP
Aggressive buyers stepping in at $34–36 (since CME open).
Price is now trading at the upper band of the HTF AVWAP, a zone that often signals overextension vs volume-weighted positioning.
The unfilled wick imbalance at $26.83 is also the price of the HTF AVWAP itself (blue line) → strong confluence for a revisit.
If downside continues, those aggressive buyers will be trapped, fueling the move lower.
Next key check: At $26.90, we need to watch data + price action to define if AVAX stabilizes there or breaks further.
✅ Conclusion
Price is showing signs of distribution at the HTF AVWAP upper band. Liquidity is being absorbed above, and the confluence of the wick imbalance + HTF AVWAP at $26.83 strengthens the case for a downside move.
👉 Key takeaway: Longs chasing into AVWAP extremes = potentially trapped buyers, with the market likely rotating back to $26.90–26.83 before the next decision point.
AVAXUSDT ; Did the buyers arrive?Hello friends
You see that the price has created a channel and broken it and has had a good growth and has created a channel again that buyers support. Still, and considering the sharp movement that we are seeing, it seems that the price can break this channel.
If it fails to break the channel in the first encounter, it can move to the specified support areas and then grow.
If the channel is broken, the price can move to the specified targets.
*Trade safely with us*

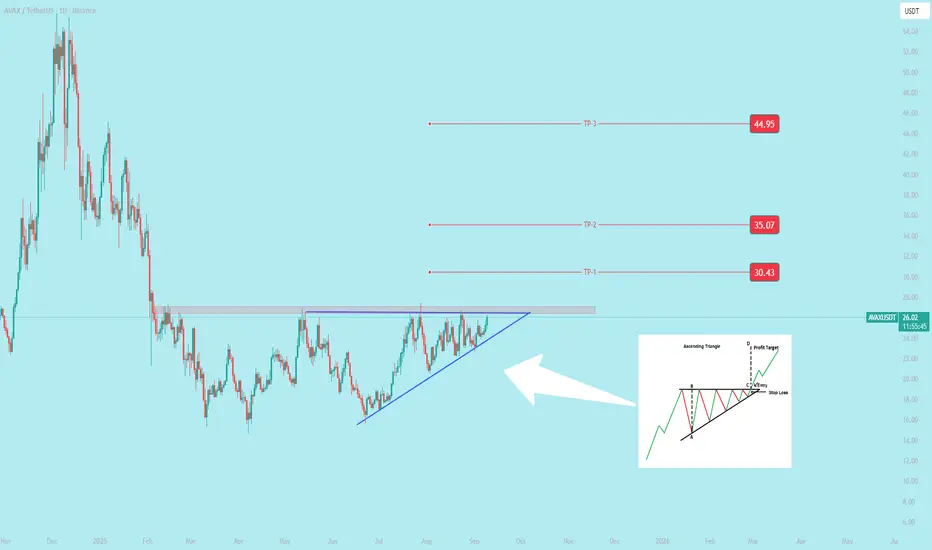
$AVAX Performing Bullish Ascending Triangle CRYPTOCAP:AVAX Performing Bullish Ascending Triangle
a continuation chart pattern in technical analysis that signals a likely breakout to the upside. It suggests that buying pressure is increasing, and buyers are becoming more aggressive, while sellers are losing momentum.
AVAX — 220-Day Range Broken, Next Stop $35?After 220 days of consolidation, AVAX has finally broken out of its trading range. The key resistance at $27 was cleared, and price quickly pushed into the $30 psychological level, where it faced rejection. Currently, AVAX is consolidating just below, around $29.
So, what’s next? Now all eyes are on the retest to confirm $27 as the new launchpad.
Support Confluence (Long Entry Zone)
3M/Quarterly level: $27.71 → major support
0.382 Fib retracement: $27.65 (low $23.87 → $30)
0.5 Fib retracement: $26.93 → perfectly aligned with $27 zone
Swing High: $27.38 → could be retested
4H 21 EMA: $27.71
4H 21 SMA: $27.41
Weekly VWAP: $27.41
Fair Value Gap (FVG): imbalances in this zone
📌 With all these layers of confluence, the $27.7–$27.4 zone is the ideal long entry area.
Resistance Confluence (Take Profit Zone)
0.5 Fib retracement of the entire downtrend: $35.22
15B Market Cap resistance: $35.5
Yearly Open: $35.7 → major target
3M/Quarterly level: $35.71
TPO resistance cluster: $35.22–$37.28
📌 Together, these levels form a stacked resistance zone at $35–$37, making it both the ideal take-profit area and a potential short setup.
Zoomed-Out View:
TPO Chart Reference:
🟢 Long Trade Setup
Entry Zone: $28.0 → $27.4 (DCA best approach)
Stop-Loss: Below $26 (to be adjusted after reversal confirmation)
Take Profit: $35
Potential Gain: +25%
R:R: 1:4+
Technical Insight
After 220 days of sideways compression, the breakout above $27 marks a shift in market structure.
A retest of this level would validate it as new support and provide a high-probability swing long setup.
The $35–$37 zone, reinforced by the yearly open at $35.7, stands out as the major resistance cluster, making it both the ideal profit target and a potential reversal area.
Key Levels to Watch
Support Zone: $28–$27
Resistance Zone: $35–$37
🔍 Indicators used
DriftLine — Pivot Open Zones → For identifying key yearly/monthly/weekly/daily opens that act as major S/R reference points
Multi Timeframe 8x MA Support Resistance Zones → to identify support and resistance zones such as the 4H 21 EMA/SMA.
➡️ Available for free. You can find it on my profile under “Scripts” and apply it directly to your charts for extra confluence when planning your trades.
_________________________________
💬 If you found this helpful, drop a like and comment!

$AVAX to $42 and to $13This is the scenario I see for #AVAX, we aren't there yet in my opinion. I can see taking profit for this amazing leg to $42, but then I''l put a buy order at $13. Thoughts?

#AVAXUSDT Daily ChartPrice previously filled the imbalance at $30 and tested the daily supply zone at $35 before getting rejected, as we perfectly predicted. MACD is showing bullish weakness, RSI is bought and EMAs are turning bullish. Price should retest the S/R Flip at around $27 before moving up again.