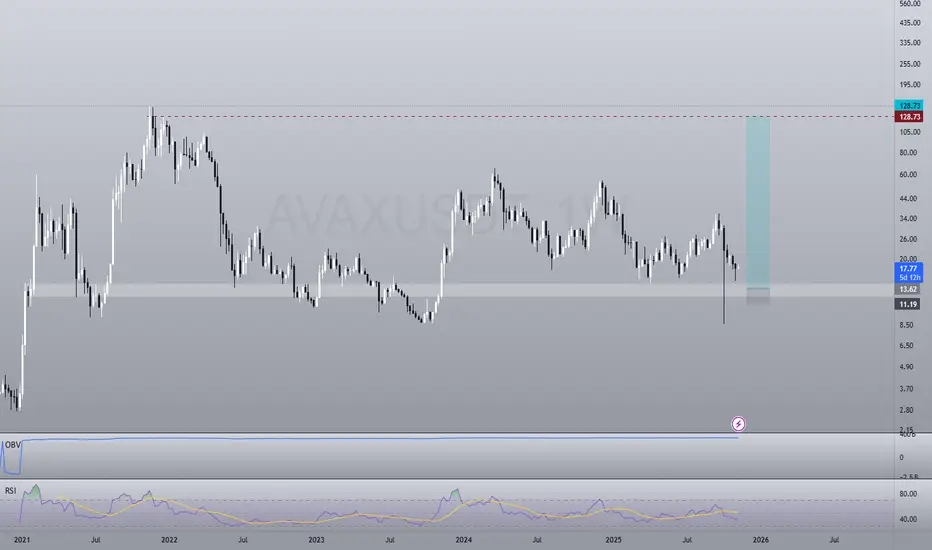
$AVAX/USDT is Waking Up!🚀 $AVAX/USDT is Waking Up!
CRYPTOCAP:AVAX is breaking out of a huge descending wedge pattern.
Keep this one on your radar, a big move could be brewing soon with a technical target pointing potentially to the $27.50 range.
DYOR, NFA
#AVAX
Trade ideas

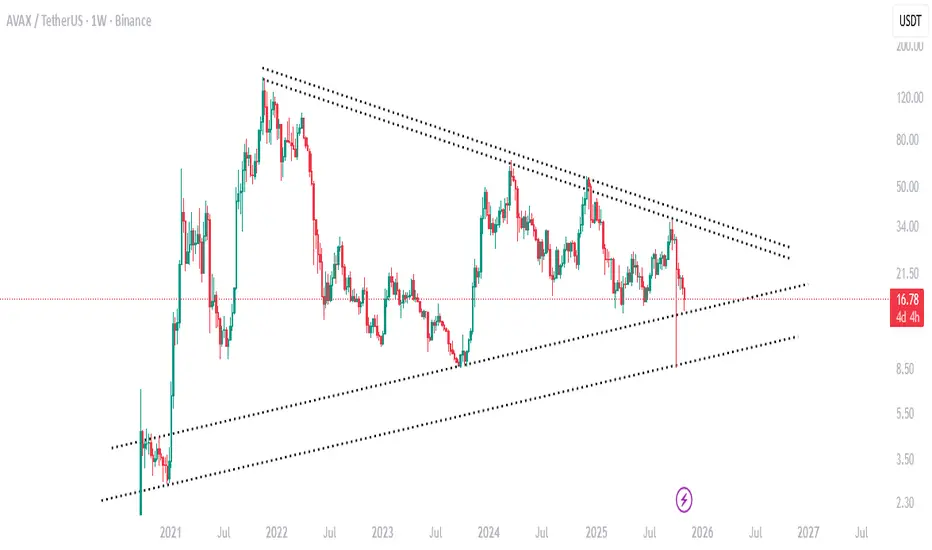
support and resistance levels in avaxYou can see the chart of this currency on the weekly time frame. The support and resistance levels are clear
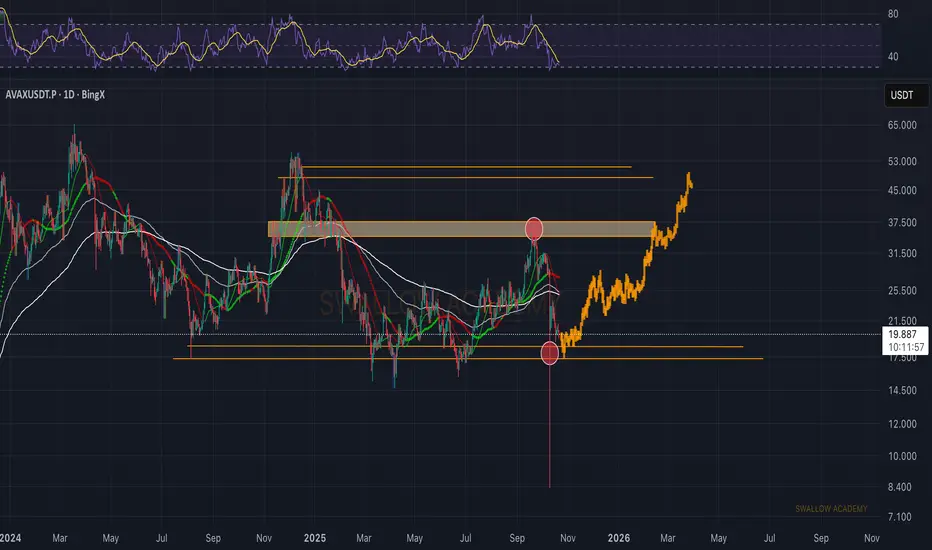
Avalanche (AVAX): Might Be a Good Buy Entry Soon!AVAX is sitting at the same zone where we saw a strong reversal earlier. Right now, we’re watching for a BOS — that’s the key signal needed before looking for any continuation setup. If buyers manage to break structure cleanly, momentum should shift back up fast.
Swallow Academy
BULLISH DIAMOND PATTERN (AVAXUSDT)Despite the recent downtrend, a strong bullish pattern (diamond bottom) in AVAXUSDT chart is formed. If the diamond bottom pattern works correctly, the final target is 150$.

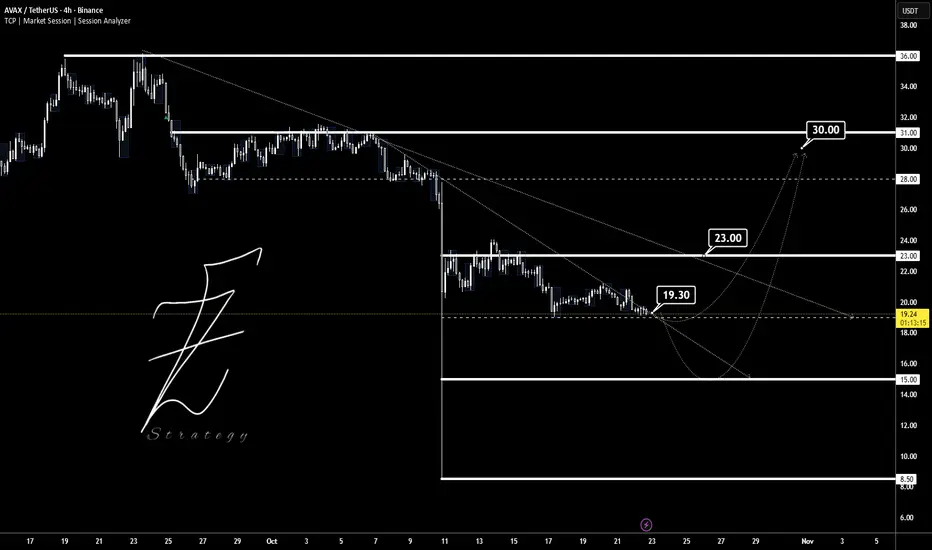
AVAXUSDTThis chart is The try that breakout trendline to way in 30$ target.
Supports: 19 - 15 -8.5
Resistance: 23 - 30 - 36
⚠️ Please control money management.
BINANCE:AVAXUSDT
Hello $Avax, glad your in buying zone againYeah, it's coming. The weekly zone to add or buy. Big wicks below, stopping all prev longs. But retest of the area sounds solid.
Swing long, no leverage (too wide stop). DCA between 16 & 13 , depending on your preferences.
AVAX anti butterfly harmonicI've been tracking this AVAX anti butterfly harmonic for several weeks, now getting close to the PRZ, time limited, do your due diligence as I have another higher, this is an area to pay attention to.........

Avalanche (AVAX)Avalanche (AVAX/USDT) is currently testing a key support zone that has acted as a strong demand area multiple times in the past. The price is still trading inside a large symmetrical triangle, approaching the apex, where a decisive breakout could define the next macro move.
If Bitcoin and Ethereum manage to continue their upward trend — breaking above $124K and $5K respectively — AVAX could show a strong recovery from this level, targeting higher resistances around $35, $49, and $72.
Given how much AVAX has lagged behind major assets, this area could present an interesting accumulation opportunity for mid- to long-term holders.


AVAXCRYPTOCAP:AVAX is nearing a key support level, showing strong confluence for a reversal setup. I expect the first breakout to deliver up to 500% gains within the next 180 days. The structure looks clean, and this zone offers a solid entry opportunity for early positioning.

Avax next big move 25% gain toward 26$Hi the support and resistances on the chart are based on the previous data and weekly candlesticks if BINANCE:AVAXUSDT holds this last support the potential of 25% gain is logical toward 26$

Possible upward movement for AVAXIn recent days, there has been a pattern of accumulation, and in the 4-hour timeframe, a reverse head-and-shoulders pattern can be seen.
If we add the gap filled in BTC and ETH + accumulation in the TOP 10, it could result in an upward movement for altcoins.

AVAX USDT SHORT SIGNAL---
📢 Signal Alert
🔹 Pair: AVAX / USDT
📉Trade Type: Short
💰Entry Zone: 17.845
🎯 Take-Profit Targets (Partial Management):
▫️TP1 = 17.635
▫️TP2 = 17.370
▫️TP3 = 17.117
▫️TP4 = 16.850
🛑 Stop-Loss: 18.190
📊Timeframe: 15m
⚖️Risk/Reward Ratio: 2.25
📌Suggested Leverage: 5x - 10x
⚠️ Capital management is mandatory.
💬Please review the chart before entering the trade.
---
🧠 Technical Overview:
AVAX is showing potential weakness at current levels.The short entry at 17.845 suggests this is a key resistance zone. A rejection from this area could trigger a downward move toward the identified targets. The price structure indicates potential for a bearish move, with support levels marked at each take-profit target.
The R/R ratio of 2.25 provides a favorable risk-reward setup for this short position.
---
⚙️ Trade Management Tips:
· Take partial profits at TP1 and move stop-loss to breakeven
· Trail stop-loss for remaining positions as price moves downward
· Close position if price decisively breaks above 18.190
· Monitor price action closely around entry level for confirmation
· Consider scaling out profits at each target level
---
⚠️ Disclaimer:
This signal is for educational purposes only and not financial advice.
Always perform your own analysis and apply strict risk management.
---
Note: I've added TP4 at 16.850 to maintain consistency with the format. Please verify this level matches your analysis.

AVAX/USDT – Trendline Breakout and Pullback SetupPrice is currently testing the ascending trendline after getting rejected from the $17.80–$18.00 resistance zone. If the trendline breaks and a retest confirms resistance, we could see a bearish move toward the $17.00–$16.90 support area.
Key Levels:
Resistance: $17.80–$18.00
Support: $17.00–$16.90
Bias: Bearish if price breaks below the trendline
Target: Support zone around $17.00
Trade Idea:
Watch for a clear break and retest of the ascending trendline. A rejection below resistance confirms short opportunities toward the support area.

AVAX USDT LONG SIGNAL 📢 Signal Alert
🔹 Pair: AVAX / USDT
📈 Trade Type: Long
💰 Entry Zone: 18.355 – 18.565
🎯 Targets (Take Profits):
TP1 = 18.830
TP2 = 19.225
TP3 = 19.500
🛑 Stop-Loss: 18.265
📊 Timeframe: 1H
⚖️ Risk/Reward Ratio: 2.17
📌 Suggested Leverage: 5x – 10x
---
🧠 Technical Analysis
AVAX is showing signs of a bullish reversal after testing the 18.265 support zone.
Higher low formation indicates buyers are stepping back in.
RSI is turning upward from near-oversold levels and bullish volume is increasing.
Entry Zone (18.355 – 18.565) is just above local support, providing a low-risk, high-reward setup.
Stop-Loss at 18.265 is placed below the last swing low.
⚠️ Confirm entry with a bullish candle close or breakout of minor resistance. Partial profit-taking is recommended at TP1 and TP2.

AVAX/USDT – Watching for a Major Support Retest Before ReversalAVAX has been pulling back from recent highs, and we’re now eyeing the $15.00 – $16.50 zone as a critical support area. This level has acted as a strong demand zone historically, and a clean retest here could signal a potential reversal on higher time frames. We are waiting for confirmation before considering any long positions.
📍 Trade Setup (Spot)
Entry Zone: $15.00 – $16.50 (only after support confirmation)
Take Profit Targets:
TP1: $27.00 – $31.50
TP2: $36.00 – $41.00
Stop Loss: Below $13.80

AVAXCRYPTOCAP:AVAX is approaching a key breakout window within the next 120 days. Technical indicators suggest a potential upside range of 400% to 800% if momentum confirms and broader market conditions remain favorable.

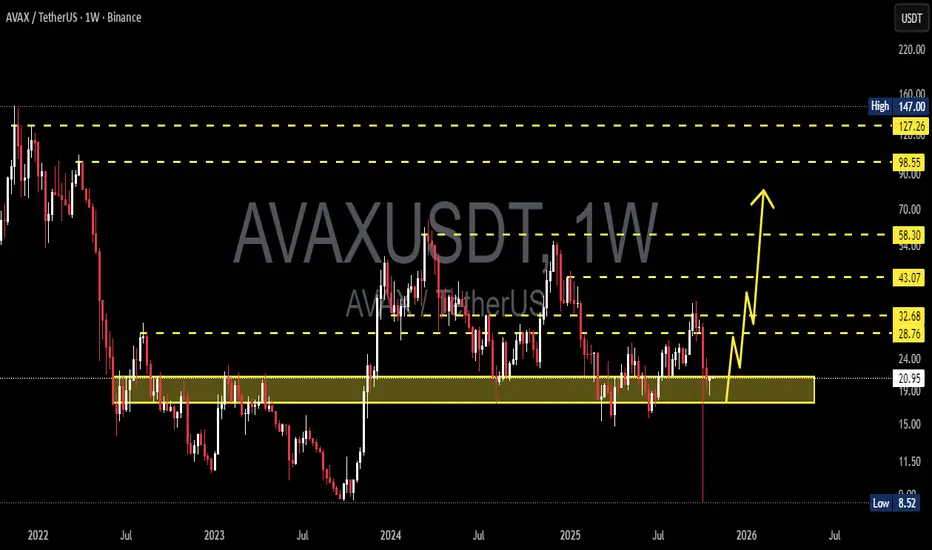
AVAXUSDT – Critical Support Zone: Will Decide the Next Trend?Yellow Block (Support Zone): 21 – 17.5 (Weekly)
This zone is the bulls’ last stronghold, an area that has historically marked AVAX’s major turning points. Price has now returned to this critical region — and what happens next could define the next macro trend.
---
Market Structure & Big Picture
After a long downtrend since 2022, AVAX has entered a macro consolidation phase, ranging between $17.5 and $43.
The current movement sits right at the bottom of this range, making the upcoming weekly close extremely important.
Major Range: 17.5 – 43
Key Support: 21 – 17.5
Main Resistance: 28.7 – 32.7 → 43.1 → 58.3
Historical High: 127 – 147
Historical Low: 8.5
This yellow zone isn’t just a technical area — it’s a battleground between long-term accumulation and potential distribution.
Every time AVAX touched this region in the past, price rebounded significantly, suggesting a possible mid-term reversal opportunity if bulls defend it again.
---
Pattern & Technical Characteristics
The chart currently shows a sideways accumulation pattern over more than a year.
Each retest of the 21–17.5 zone has produced deep wicks and strong rejections — signals of institutional absorption or smart money re-entry.
However, if this support fails, it could trigger a structural breakdown and re-open the path toward the lower double-digit region.
Potential pattern formations:
Double Bottom (Reversal) if price bounces and breaks above 28–33
Descending Channel Breakdown if price loses 17.5 with a confirmed close
---
Bullish Scenario – “Bounce From The Abyss”
If the weekly candle closes above 21, the support remains intact — and this could mark the start of a strong reversal swing.
Bullish confirmation signals:
Strong rejection with long lower wick
Rising volume during recovery
Weekly close > 24
Upside targets:
1. 28.7 → First resistance zone
2. 32.7 → Structural breakout confirmation
3. 43.1 → Major swing target
4. 58.3 → Mid-term continuation goal
Potential gain: 35% up to 170% from current levels if the bullish setup plays out.
---
Bearish Scenario – “Breaking the Last Line of Defense”
If the weekly close falls below 17.5, it confirms a macro breakdown.
AVAX could enter a new redistribution phase, targeting 12.0 – 9.0, and possibly 8.5 if a market-wide capitulation occurs.
Bearish confirmation signals:
Weekly close < 17.5
High-volume selling pressure
Failed retest (17.5 flips into resistance)
This would shift the macro bias fully bearish, and patient traders might wait for a new accumulation phase at much lower levels.
---
Conclusion & Macro Sentiment
AVAX currently sits in a golden decision zone — the line between collapse and recovery.
As long as the price holds above 21–17.5, the potential for a macro rebound remains strong.
But a confirmed breakdown below that area would signal that the accumulation phase isn’t over yet, and the market might need one final washout before a full recovery.
---
#AVAX #AVAXUSDT #CryptoAnalysis #TechnicalAnalysis #WeeklyChart #CryptoMarket #AltcoinAnalysis #TradingView #SwingTrading #SupportAndResistance #Avalanche #CryptoReversal #MarketStructure #CryptoUpdate
$avaxabove 22 we fly
will need a fat finger to blast through all that resistance above
once we do close above step on the gas since we should go to $60 imho
fast and furious
time to make it back ..

AVAX : Under the priceHello friends
well, technically, this currency has hit its resistance and formed a double top pattern, and here we have found good and strong support, which can be purchased in stages with capital and risk management, and moved with it to the specified target.
From this perspective, you should note that this currency is currently trading below its intrinsic value, and given that it is a good project, there is a good opportunity to buy it with this decline.
*Trade safely with us*

Automated vs Manual Trading — Which One Really Wins?Most traders start out manually, staring at charts for hours, hunting for that perfect setup, trying to outsmart the market.
It feels alive. You’re in control.
But after a while, you realize something brutal:
the real opponent isn’t the market, it’s you.
Fear, greed, hesitation, fatigue. The emotions that ruin good trades. That’s when automation steps in.
Manual Trading
Manual trading builds skill, but it also exposes every weakness you’ve got.
If this sounds familiar, you’re not alone:
Entering late because you hesitated.
Moving your stop loss “just one more time.”
Doubling down after a loss.
Missing setups because you needed sleep.
Manual trading gives flexibility, sure.
But it also gives you the freedom to sabotage your own plan.
Automated Trading
Benefits
Consistency: trades follow predefined rules, eliminating impulsive deviations from the plan.
Scale: automation handles higher frequency and 24/7 market coverage beyond human capacity.
Speed and precision: orders execute with lower latency and exact risk parameters.
Backtest + deploy: strategies validated historically can be deployed reliably across multiple markets.
Operational leverage: frees human time for strategy development, risk oversight, and portfolio decisions.
Disadvantages and risks
Model risk: historical backtests do not guarantee future performance; edge can decay.
Overfitting and brittle rules: overly specific parameters may break under regime changes.
Misaligned incentives: automated systems execute mechanically; they cannot judge rare macro events or qualitative news.
Monitoring burden: automation reduces manual trading work but increases need for robust monitoring, alerts, and contingency plans beforehand.
⚔️ Two Traders, One Market
Here’s the truth: two traders can run the same strategy and get completely different results.
Trader A trades manually, emotional, inconsistent.
Trader B runs automation, same logic, perfect execution.
Same system. Different outcome.
Guess which one ends up consistent?
Lingrid | AVAXUSDT Pullback Sell Downside ExtensionBINANCE:AVAXUSDT is showing rejection from the confluence of the downward trendline and the $20 psychological zone, confirming sellers' control in the short term. The structure remains within a bearish channel with a lower-high formation maintaining downside pressure. Price may retest $20 before extending losses toward $17.5 if momentum weakens further. This retracement aligns with the broader descending structure visible since mid-October, keeping bias bearish for now.
⚠️ Risks:
Break above $20.5 could invalidate the current bearish setup.
Strong BTC recovery may support short-term upside correction.
Lower volatility could delay breakdown confirmation below $18.
If this idea resonates with you or you have your own opinion, traders, hit the comments. I’m excited to read your thoughts!

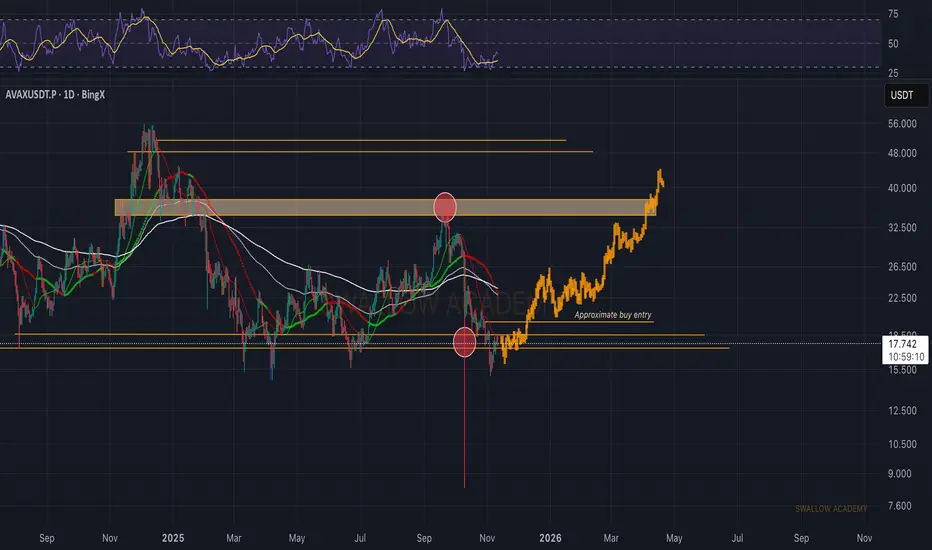
Avalanche (AVAX): Looking For Proper Market Structure Break AVAX is hovering right above the local support zone, and as long as price holds here, we stay bullish. What we want to see next is a proper market structure break on this timeframe — that’ll be our confirmation for a long setup.
Once MSB forms, we’ll look to take a long position from this area with a solid R:R setup, aiming for continuation toward upper resistance levels.
Swallow Academy