Send it to $52#AVAX Easy x2 in the market😳
W-Bottom + Bullish pennant under the neckline resistance💁♂️
Trade ideas
AVAXUSDT Last week, the AVAXUSDT chart managed to break through its previous resistance levels, showing strong bullish momentum and printing a new high around 34.80 dollars. At the moment, the price is consolidating between 30.60 dollars as a key support and 34.80 dollars as the main resistance. The overall trend remains bullish since higher highs and higher lows have consistently formed, indicating that upward momentum is still intact. However, holding above the 31.00 dollars support and attempting another push toward 34.80 dollars will be crucial for confirming further bullish continuation. If the 30.60 dollars support breaks, the next important area lies near 29.00 dollars, which could act as a mid-term support. On the bullish side, a decisive breakout above 34.80 dollars could open the way for higher price targets, while weakening momentum may also bring the market into a corrective phase.

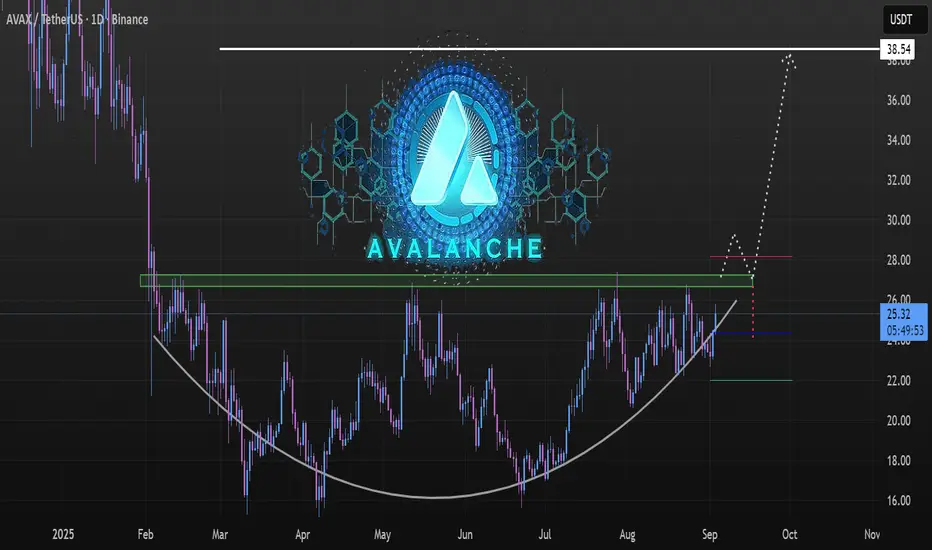
AVAX (Avalanche) 1D TF, Rounded Accumulation Phase BINANCE:AVAXUSDT Avalanche activity driven by DEXs, trading bots, whale memecoin speculation 📰
AVAX is Back in the Game, with the Alt season heating up 🌡️
At the time of charting Avax was trading above trendline support at $25.34, spotting a Positive Momentum Shift –Volume Likely to Expand, Psychological Recovery, reclaiming $25+ puts AVAX back in bullish radar after prolonged weakness.
Major Target: Sustained breakout projects to the measured move of the rounded base, aligning with 🎯$38.54, which is the chart’s major resistance and target➶ zone.
Chart Structure & Trend
Rounded Base Formation: From Aug 2025 to Sept 2025, AVAX formed a rounded bottom / cup ⊔ like structure, which often signals accumulation and a potential reversal from a bearish to a bullish phase.
Higher Lows 📈 Trendline a consistent series of higher lows, confirming strength in the uptrend.
Key Resistance Zone (Green 🟩 Band: ~$25.5–27.5): Price is consolidating at this supply zone where multiple rejections occurred earlier. This makes it the make-or-break level at the 5th time.
📈 Breakout Scenario
Trigger: A daily close above the green resistance band would confirm breakout strength.
Immediate Target: First move could extend towards the $28.50–29.00 minor resistance (red⭕ line area).
🪟Projection
Break above $27.5 → fast move to $29.
Sustained momentum → target $38.54 (≈ 52% upside from breakout).
⚠️Pullback / Risk Scenario
If rejection occurs at the green band, A deeper correction might revisit the price could retest $24.30 area (blue🔷 pivot line). but the rounded base structure remains intact unless that level fails.
“Markets don’t just price assets; they price belief, adoption, and time. For AVAX, the real question isn’t whether it can break resistance — it’s whether the ecosystem can keep compounding utility fast enough to justify the breakout. Are you watching the chart, or the chain?”
Always DYOR
Trade Safe,
See you on the other side
AvaxusdtHi snipers. The avax / usdt currency pair on the one-day timeframe has managed to break the upper line of the ascending channel. In the overall picture, we see an older ascending channel that has been invalidated, which is parallel to the current channel, which the price has re-entered. The price has now hit a resistance (35) and has reversed. It will probably hit the bottom of the new channel and resume the upward trend again, but if this line is broken, there is also a possibility of returning to the previous channel. I am learning. The analysis is not a buy or sell recommendation. 🙏

AXS: Coiling Up for a Shakeout?AXS is stuck between floors and ceilings, grinding inside a tight rising wedge. While the macro picture looks juicy with the Fed turning on the liquidity taps, the on-chain data for AXS is telling a different story. We're seeing a classic setup where the chart looks bullish from afar, but the internals are weak.
Our game plan is to watch for a breakdown. The bulls' line of defense is the wedge support around $33.50. A clean break below that level opens the door to our primary target zone, a liquidity magnet around $31.90-$30.50. This area is a major support cluster and a logical place for a healthy reset before the next leg. Heavy resistance sits at the recent high of $35.76.
Patience is key here; we're waiting for the market to show its hand while the crowd gets chopped up. Don't be the exit liquidity for underwater holders looking to break even on this bounce. Smart money waits for confirmation.
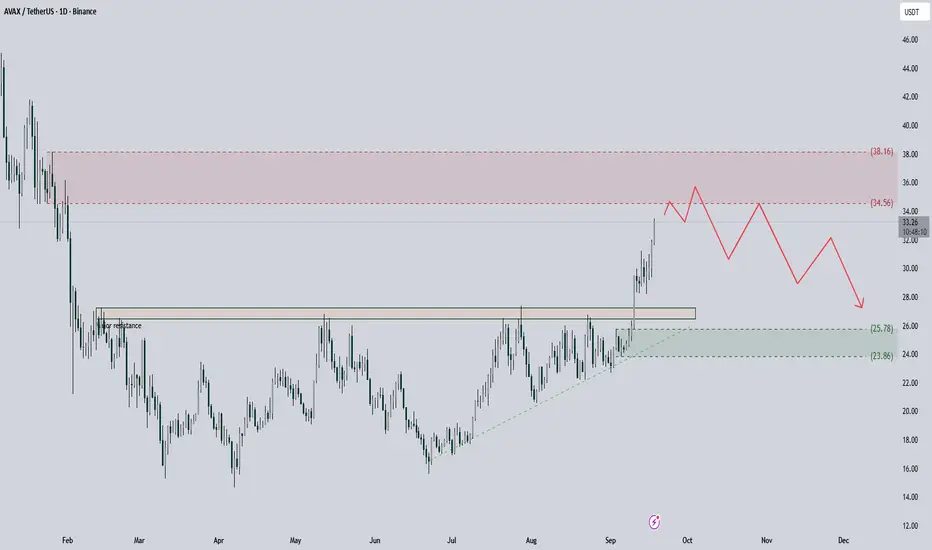
AVAX Nearing Key Resistance ZoneAVAX USDT Daily: Price Nearing Key Resistance Zone
BINANCE:AVAXUSDT has demonstrated a strong upward trend, breaking through a significant, long-term resistance level that has been in place since early in the year. This breakout is a bullish signal, and it's exciting to see the momentum it's carried.
However, the price is now approaching a new, crucial resistance zone between $34.56 and $38.16. This area previously acted as strong support before a significant downtrend. Based on my analysis, I anticipate a potential rejection from this zone, which could lead to a correction toward the previous resistance-turned-support area around $23.06 to $25.78.
The short-term outlook suggests a possible pullback from the current levels, but the overall market structure looks promising as long as the price holds above the recently broken resistance. I'll be watching for a clear reaction in this resistance zone to confirm the potential move.
What do you think? Drop your thoughts and analysis in the comments below!
AVAX - follow the trend!AVAX - follow the trend!
in previus analysis i told you to take long
price broke that range - that's why wait for a 2nd part of that plan - range and new long

AVAXUSDT: Strong Buying MomentumThe AVAX chart is showing a clear bullish bias, holding firmly within an ascending triangle pattern with key resistance at the $25.6–$25.8 zone. Alongside positive macro signals, such as the Fed’s high likelihood of cutting interest rates in mid-September and renewed strength in risk-on assets, I expect AVAX to break through resistance.
The first target is projected around the $31–$32 zone, with the next target near $35.
Disclosure: I am currently holding an AVAX position with an average entry price of $22. This may influence my personal outlook on the market.

AVAXUSDT UPDATE#AVAX
Update
AVAX Technical Setup
Pattern: Falling Wedge Pattern
Current Price: $25.21
Target Price: $55.78
Target % Gain: 120%
Technical Analysis: AVAX has broken out of a falling wedge on the 1D chart, signaling strong bullish momentum. The breakout above resistance with solid structure confirms upside potential, pointing toward the $55.78 target area.
Time Frame: 1D
Risk Management Tip: Always use proper risk management.

$AVAX blasting until the resistance at 42$My opinion is that #AVAX is still into the triangle and is not ready to break the resistance yet (please I hope I'm wrong). But this can be a good trade for both side, taking profit at 42$ and opening a possible short from there.

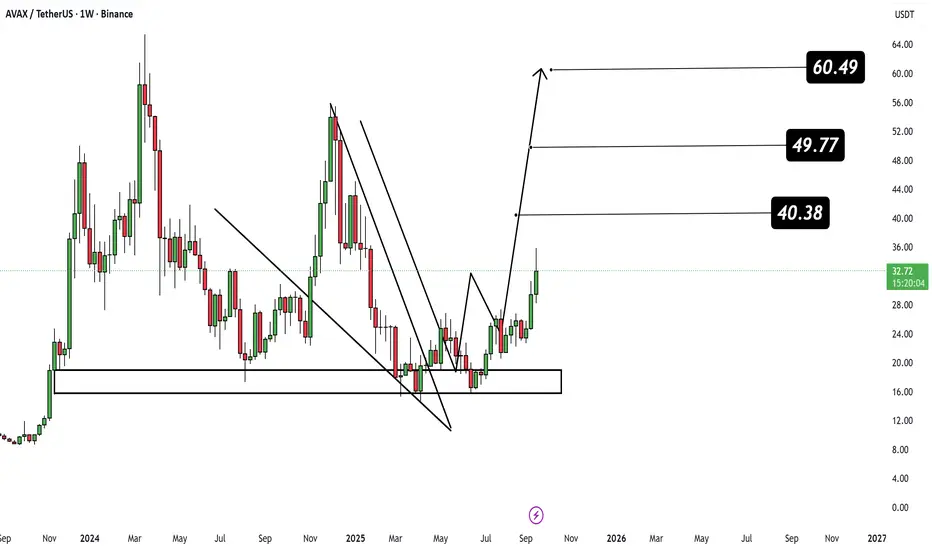
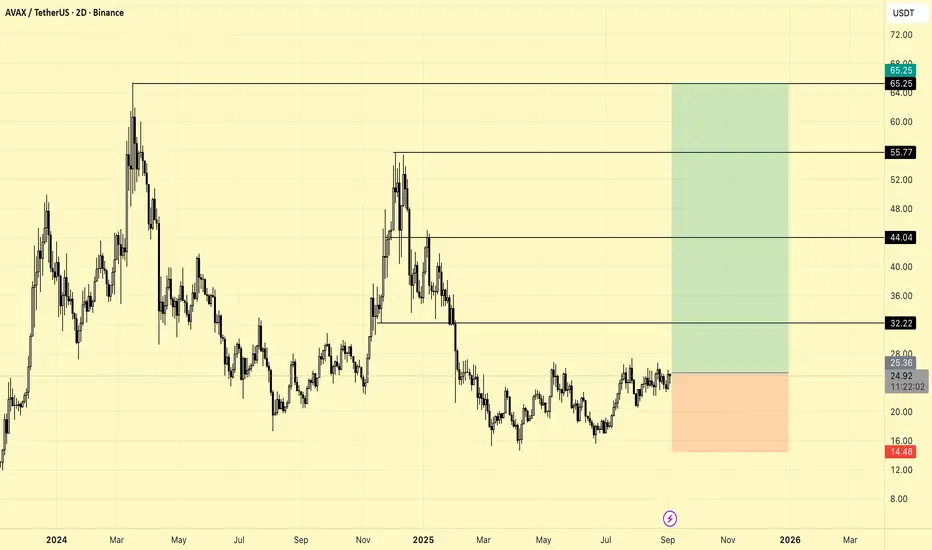
AVAX MID TERM TRADE IDEAKey Features and Explanation
Main support zone is marked at 14.48 USDT, indicating the stop-loss level for the setup.
Major resistance zones are drawn at 32.22, 44.04, 55.77, and 65.25 USDT as potential upside targets.
The green zone shows the reward/risk area for a bullish scenario, while the red zone visualizes the risk if price drops below support.
Current price is around 24.95 USDT, in a sideways consolidation near local resistance.
Trade Setup Summary
The chart captures a medium-term opportunity favoring a move up from the current range, aiming for the outlined resistance targets with managed stop-loss.
Level markings help define clear entries, exits, and targets for risk management.
Overall, this chart offers a structured technical outlook for AVAXUSDT, combining price levels with visual risk/reward parameters for effective trading assessment.
AVAX breakout and double bottom?BINANCE:AVAXUSDT on the 1D timeframe already broke out of descending parallel channel, tested trendline support and also formed a double bottom. Over +100% in potential profits when momentum continues midterm.

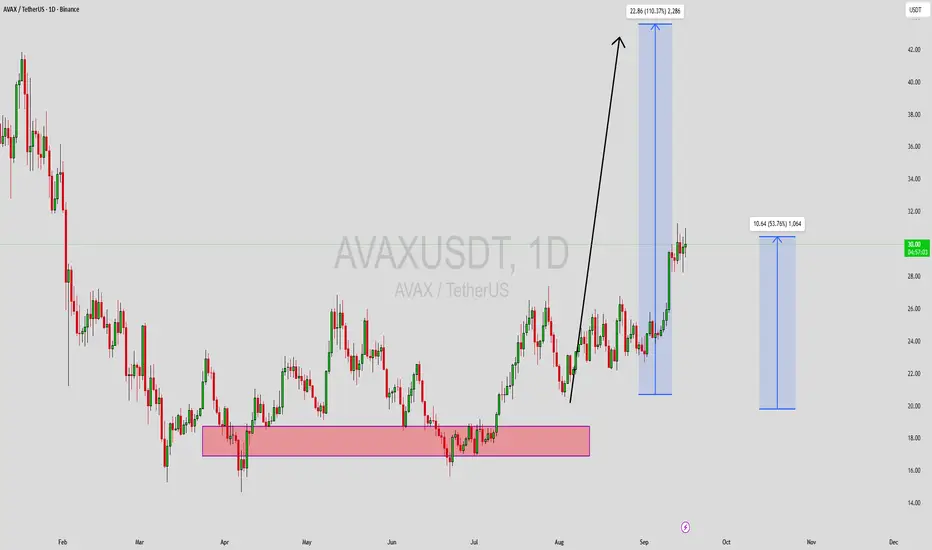
AVAX - NEW Entry for my communityAVAX - NEW Entry for my community
In a previus analysis we recomended to take long around $28 - price did 10% rise from that area twice
New long also better to take at $28 or after range consolidation

#AVAX/USDT : The Calm Before the Squeeze Storm#AVAX
The price is moving within a descending channel on the 1-hour frame, adhering well to it, and is heading for a strong breakout and retest.
We have a bearish trend on the RSI indicator that is about to be broken and retested, which supports the upward move.
There is a major support area in green at 28.30, representing a strong support point.
For inquiries, please leave a comment.
We are in a consolidation trend above the 100 Moving Average.
Entry price: 29.10
First target: 29.41
Second target: 29.90
Third target: 30.50
Don't forget a simple matter: capital management.
When you reach the first target, save some money and then change your stop-loss order to an entry order.
For inquiries, please leave a comment.
Thank you.

AVAX Moving toward new targetAs I said before, AVAX/USDT has started moving toward a new target.
You can clearly see a Head and Shoulders pattern forming, which could signal a strong upcoming move.
Make sure to wait for confirmation before entering the trade, and always manage your risk properly.
NOTE: Don’t forget to put a stop loss on every trade to protect your capital, and consider adjusting it as the price moves in your favor.

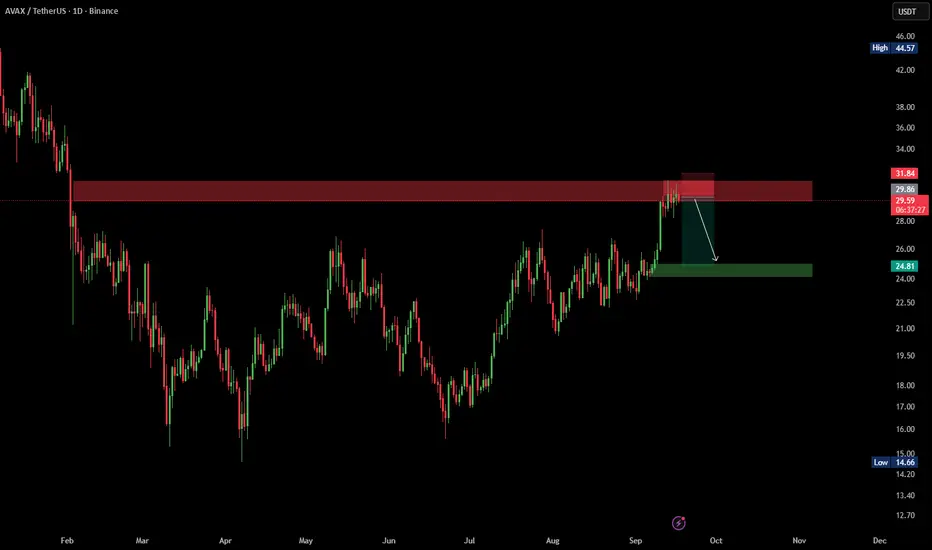
AVAX/USDT – Strong Resistance Rejection,AVAX is testing a major resistance zone at $31–32, where sellers have stepped in before. Price action shows signs of rejection, increasing the probability of a pullback toward $25–24 support.
However, the short-term trend is strongly dependent on Bitcoin’s movement and today’s market news. If Bitcoin faces rejection at its own resistance and negative headlines emerge, AVAX could see an accelerated drop. On the other hand, strong Bitcoin momentum could delay or even invalidate this correction.
🔻 Key Levels
Resistance: $31–32 (supply zone, breakout needed for bullish continuation)
Current Price: ~$29.5
Support 1: $25–24 (first demand zone)
Support 2: $22–21 (extended support in case of deeper correction)
📉 Scenario
Failure to break above $32 keeps downside pressure intact.
A correction toward $25–24 is likely if Bitcoin weakens.
With bearish Bitcoin + negative news, AVAX could extend losses to $22–21.
⚠️ Trading Note
Watch BTC/USD resistance reaction closely.
News-driven volatility could make this a high-risk, high-reward setup.
Use tight stop-losses above $32.5 for short positions.
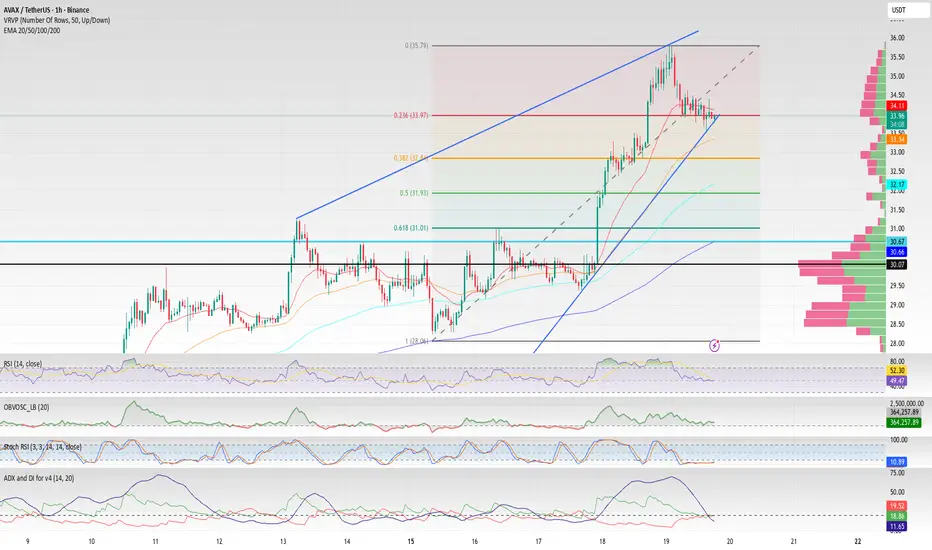
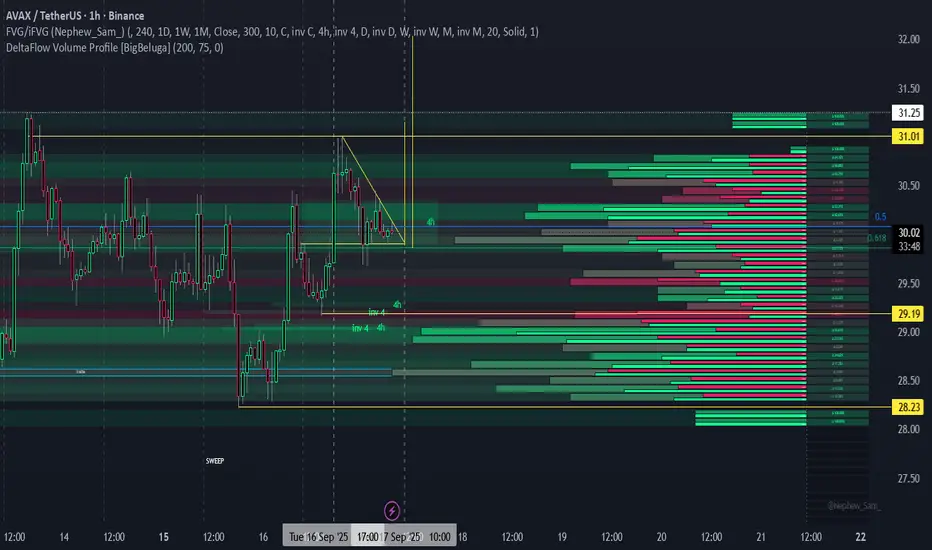
AVAX/USDT CUP and Handle chart 2 1hr time-frameAVAX is printing a classic cup & handle structure on the 1H. The “cup” is formed by the rounded bottom near $27–28, while the “handle” is tightening just below the $30 HVN shelf.
🔹 Volume Profile Read:
The HVN zone sits right at $30, which explains the current stall. This is a key decision area — acceptance here fuels continuation, rejection sends us back into lower volume.
LVN gap above $30.4 → $31.2 offers a clean path for price discovery. If bulls push through, the lack of volume in this zone should let price glide quickly.
Below, the support HVN around $29–29.2 is acting as the handle base and accumulation shelf.
🔹 Delta Flow Insight:
Buyer delta is slowly absorbing sell pressure on the handle retrace, suggesting smart money is building position under resistance.
Sellers are failing to expand below the HVN shelf — classic “handle shakeout” behavior.
What the 4H FVG is saying
The FVG is sitting right inside the handle consolidation zone, basically overlapping with that $29.5–30 HVN shelf.
That means price dipped, left inefficiency, and now we’re seeing consolidation/absorption right on top of it.
🔹 Confluence with Volume Profile
HVN at $29.5–29.8 = strong acceptance zone.
4H FVG below = unfilled imbalance that smart money often defends.
Together, this says: “If the handle holds, this FVG becomes the launchpad.”
🔹 Trading Implication
If price respects the top of the 4H FVG and stays bid → bullish continuation signal.
If it trades deep through the bottom of the FVG and closes below → invalidates the setup, shifts bias bearish.
📈 Trading Bias:
Break and hold above $30.4 = bullish continuation into $31.2 / $32 LVN.
Failure to hold $29.8 HVN = reversion back into $29 support shelf.
⚠️ Invalidation: A strong acceptance below $29 would void the cup & handle structure and shift bias back to bearish.
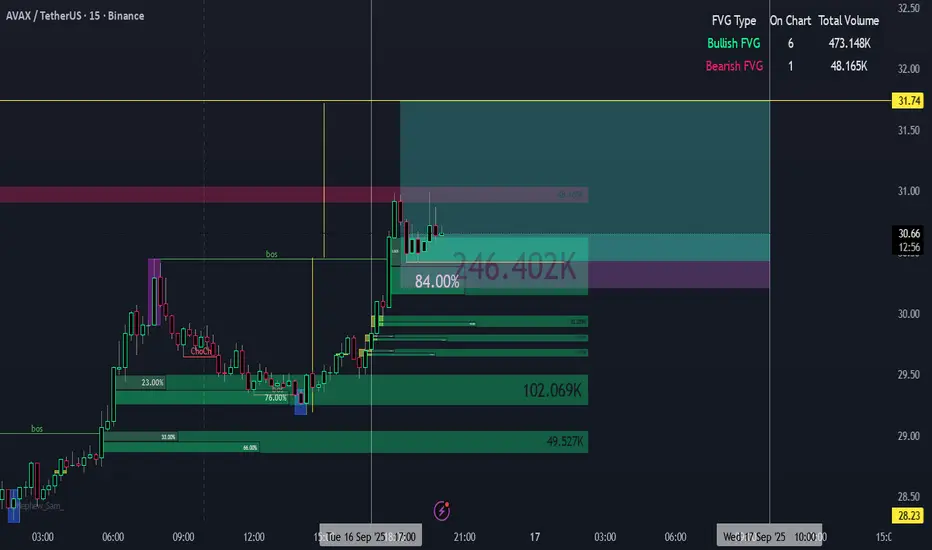
AVAX/USDT Cup and Handle on the 15 minuteCup and Handle on the 15 minute continuation pattern. BOS with a FVG is also a good signal of continuation strength.
Target is the cup depth..
AVAX Market Update📊 CRYPTOCAP:AVAX Market Update
CRYPTOCAP:AVAX has formed a bullish Inverted Head & Shoulders pattern 🟢
👉 But it still needs to break out of the red resistance zone 🔴
👉 If the breakout happens, the first target will be the green line level 🎯
⚡ Wait for confirmation before entering.

AVAXUSDT Forming Bullish MomentumAVAXUSDT is showing strong signs of bullish momentum as it continues to gather strength around key technical levels. The bullish momentum pattern suggests that buyers are gradually building control, setting the stage for a potential breakout. With solid trading volume backing the current market action, AVAX is well-positioned to push toward higher levels, and momentum traders are watching this closely for confirmation of trend continuation.
The projected expectation of a 90% to 100%+ gain reflects the strong upside potential that this setup presents. Once AVAXUSDT clears its near-term resistance levels, it could unlock rapid price acceleration, driven by increased demand and renewed investor confidence. Patterns of this nature often lead to explosive rallies as bullish sentiment fuels buying pressure.
Investor interest in this project continues to grow, signaling healthy market participation. The combination of strong volume, favorable technical indicators, and increasing community support makes AVAX one of the promising candidates for a major bullish run. If the current momentum sustains, AVAXUSDT could become a standout performer in the upcoming sessions.
✅ Show your support by hitting the like button and
✅ Leaving a comment below! (What is You opinion about this Coin)
Your feedback and engagement keep me inspired to share more insightful market analysis with you!
AVAX – Riding the TrendLet’s ride this trend and see where it takes us! AVAX is showing signs of strength, and there’s a possible move to the upside coming today or tomorrow.
Momentum looks supportive, so if buyers step in, we could catch a nice leg higher. Keeping an eye on key levels — patience and timing will do the rest. 👀🔥

Will the Terror of 27 End for Avax?Avax is once again testing the 27 resistance. This level has been holding since March, rejecting Avax more than ten times. ( ).
Now, with tokenization becoming a hotter topic and upward pressure building across the broader crypto market, the weight on this resistance could start to grow. The consistently higher lows are another sign of rising bullish pressure. All Avax needs is a final push. Whether upcoming PPI and CPI data will help trigger the breakout remains to be seen.

AVAX -follow the riseAVAX -follow the rise
take new long after consolidation
1st target before POC at 36
main target swing high 54
