AVAXUSDT - The hunt for liquidity before the fall BINANCE:AVAXUSDT , within the context of a global downtrend and low liquidity associated with market conditions, is forming a short squeeze ahead of a possible decline.
The global trend is protracted and downward, which generally indicates the dominance of bears in the medium and long term.
B

AVAXUSDT Forming Falling WedgeAVAXUSDT is forming a clear falling wedge pattern, a classic bullish reversal signal that often indicates an upcoming breakout. The price has been consolidating within a narrowing range, suggesting that selling pressure is weakening while buyers are beginning to regain control. With consistent volum

Avalanche (AVAX): We Can Long Now for +4% or Later For +13% ROIAfter the mood swings we’ve seen earlier, AVAX has been in a steady decline, but price is now starting to show signs of a possible reversal. The shift is happening near the EMAs, which is where we usually expect the first reaction.
For now, there’s a short-term long opportunity forming with roughly

Is $AVAX Finally Near the Bottom ??
📌 CRYPTOCAP:AVAX price has dropped heavily from around $60 to $10 since March 2024, so the higher time frame trend is still bearish ✅
📌Currently, price is sitting in a strong weekly support zone, where AVAX previously gave a massive pump after touching this area ✅
📌But I do not expect a bullish

Reverse head and shoulders on AVAX/USDT monthly graph23.43 is approximate resistance, 81.99 approximate target .
Reverse head and shoulders on Avax/USDT monthly graph.

avx trade plan completed wave 1 and wave 2 is unfolding as abc correction looking for wave c
wave 3 targets 42$

#AVAX/USDT : The Calm Before the Squeeze Storm#AVAX
The price is moving in a descending channel on the 1-hour timeframe. It has reached the lower boundary and is heading towards breaking above it, with a retest of the upper boundary expected.
We have a downtrend on the RSI indicator, which has reached near the lower boundary, and an upward re

AVAXUSDT UPDATEAVAX
UPDATE
AVAX Technical Setup
Pattern: Falling Wedge Pattern
Current Price: $12.45
Target Price: $36.00
Target % Gain: 189.16%
Technical Analysis: AVAX is showing signs of breaking out of a falling wedge pattern on the 1D chart, indicating bullish potential if price can sustain above the

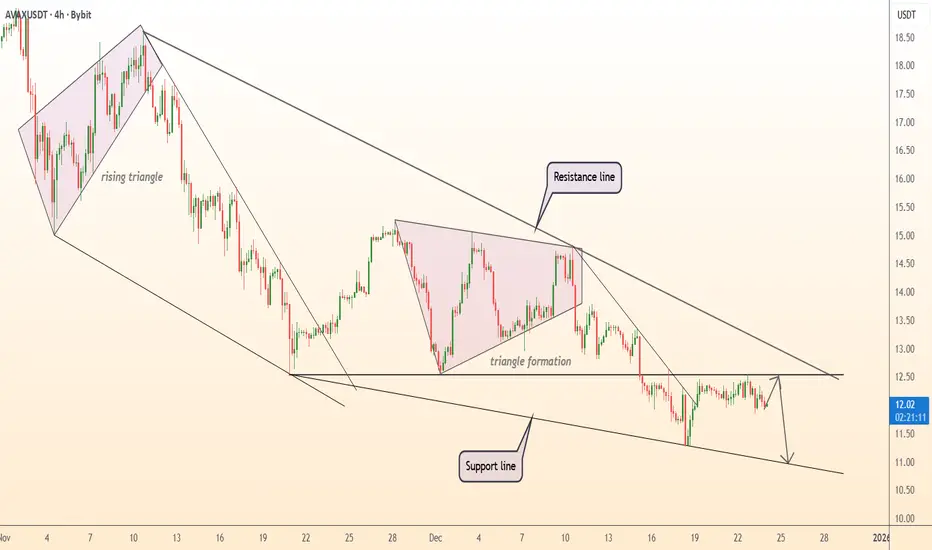
DeGRAM | AVAXUSD is holding a downtrend structure📊 Technical Analysis
● AVAX/USD remains in a well-defined descending channel after a failed rising triangle and multiple bearish triangle formations, confirming sustained selling pressure. Each rebound is capped by the descending resistance line, forming a clear sequence of lower highs.
● Price is
AVAXUSDTCRYPTOCAP:AVAX
Holding the 0.5 level near $11.18. A breakdown opens the door to ~$8.61. Crypto sentiment has evaporated. Risky, but this is the kind of spot I’d consider buying—if you can sit through the pain.

See all ideas
Summarizing what the indicators are suggesting.
Oscillators
Neutral
SellBuy
Strong sellStrong buy
Strong sellSellNeutralBuyStrong buy
Oscillators
Neutral
SellBuy
Strong sellStrong buy
Strong sellSellNeutralBuyStrong buy
Summary
Neutral
SellBuy
Strong sellStrong buy
Strong sellSellNeutralBuyStrong buy
Summary
Neutral
SellBuy
Strong sellStrong buy
Strong sellSellNeutralBuyStrong buy
Summary
Neutral
SellBuy
Strong sellStrong buy
Strong sellSellNeutralBuyStrong buy
Moving Averages
Neutral
SellBuy
Strong sellStrong buy
Strong sellSellNeutralBuyStrong buy
Moving Averages
Neutral
SellBuy
Strong sellStrong buy
Strong sellSellNeutralBuyStrong buy
Displays a symbol's price movements over previous years to identify recurring trends.