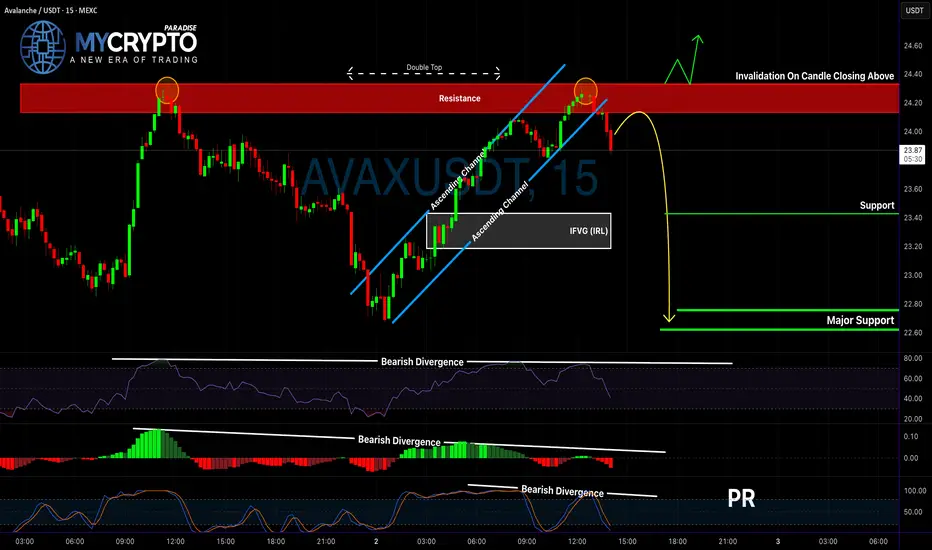
AVAX on Thin Ice: Is a Major Breakdown About to Start?Yello Paradisers, are you seeing what’s happening on AVAX right now? The chart is flashing multiple warning signals that could trigger a heavy downside move if bulls don’t step in quickly.
💎 Currently, AVAXUSDT has formed a clear double top pattern, backed by bearish divergences across RSI, MACD, and Stoch RSI. When all three indicators align in this way, the probability of a bearish continuation increases significantly, and ignoring these signals could prove costly.
💎 For aggressive traders, even entering from the current levels could still offer a decent 1:1 risk-to-reward ratio. However, for those taking a safer and more disciplined approach, it is far better to wait for a pullback into resistance and then watch for a bearish candlestick confirmation before committing. This method not only increases the probability of success but also improves the overall risk-to-reward setup.
💎 That being said, there is one clear invalidation point. If price breaks out and closes above the resistance zone, the bearish outlook will be completely canceled. In that case, the smarter move is to remain patient and wait for new price action to form rather than forcing a trade.
🎖Remember, Paradisers, patience and discipline always pay off in the long run. Chasing every setup is what gamblers do—waiting only for the highest probability confirmations is what separates true professionals from the crowd.
MyCryptoParadise
iFeel the success🌴
AVAXUST.P trade ideas
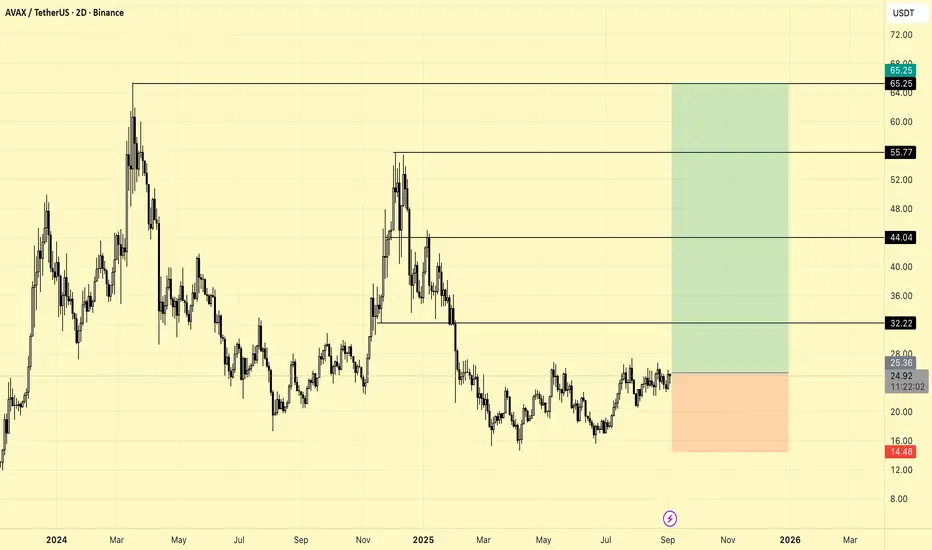
AVAX MID TERM TRADE IDEAKey Features and Explanation
Main support zone is marked at 14.48 USDT, indicating the stop-loss level for the setup.
Major resistance zones are drawn at 32.22, 44.04, 55.77, and 65.25 USDT as potential upside targets.
The green zone shows the reward/risk area for a bullish scenario, while the red zone visualizes the risk if price drops below support.
Current price is around 24.95 USDT, in a sideways consolidation near local resistance.
Trade Setup Summary
The chart captures a medium-term opportunity favoring a move up from the current range, aiming for the outlined resistance targets with managed stop-loss.
Level markings help define clear entries, exits, and targets for risk management.
Overall, this chart offers a structured technical outlook for AVAXUSDT, combining price levels with visual risk/reward parameters for effective trading assessment.
$avax - Bullish pennant & accumulation under Monthly resistanceCRYPTOCAP:AVAX - Bullish pennant & accumulation under 215 days range zone resistance! 📈
Once it will flip & consolidate above the 26.50$ level, I expect to see a 20%+ move upward! 🚀
🎯27.30
🎯28.25
🎯31.10
🎯33.00
🎯35.00
Remember my view, I again called for few green days, even weeks on #alts because stabilize above 110k!
Key support to be maintained: 22.0 & 21.00$.
Bulls are in full control above.
#AVAX #trading

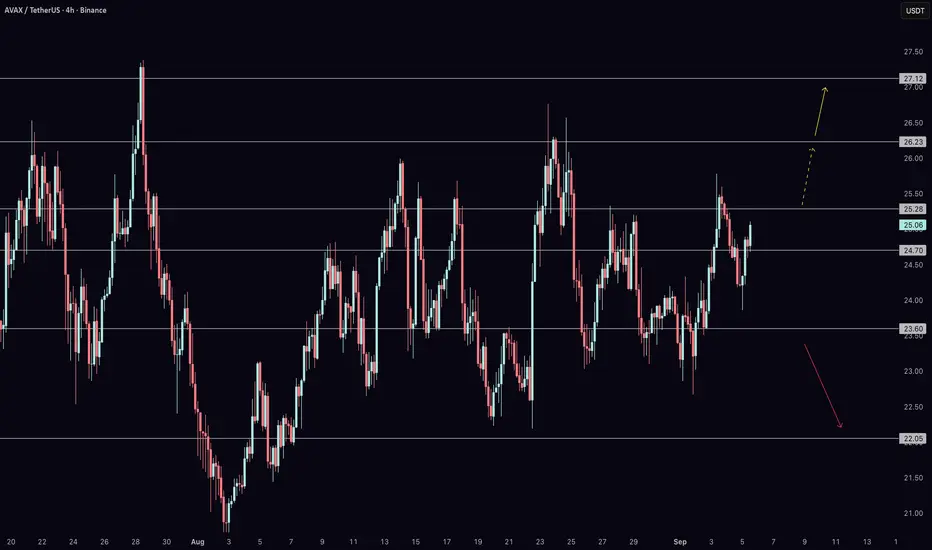
AVAX Ready for Breakout After NFP Shock?Avalanche (AVAX) is holding key support and showing signs of strength after today’s NFP report came in much weaker than expected. That release sparked volatility across risk assets, and with Bitcoin leaning bullish, AVAX could be setting up for its next leg higher. In this video, I break down both the daily and 4-hour charts to map out the critical levels you need to watch.
From $22 support to resistance levels at $26.2, $27.1, and $30.6, the structure remains constructive as long as AVAX holds above its floor. A decisive breakout opens the path toward $39 and potentially $48 in the medium term. Join me as I explain the bullish roadmap, the downside risks, and how this all connects back to Bitcoin’s momentum after NFP.
AVAXUSDT UPDATE#AVAX
Update
AVAX Technical Setup
Pattern: Falling Wedge Pattern
Current Price: $25.21
Target Price: $55.78
Target % Gain: 120%
Technical Analysis: AVAX has broken out of a falling wedge on the 1D chart, signaling strong bullish momentum. The breakout above resistance with solid structure confirms upside potential, pointing toward the $55.78 target area.
Time Frame: 1D
Risk Management Tip: Always use proper risk management.

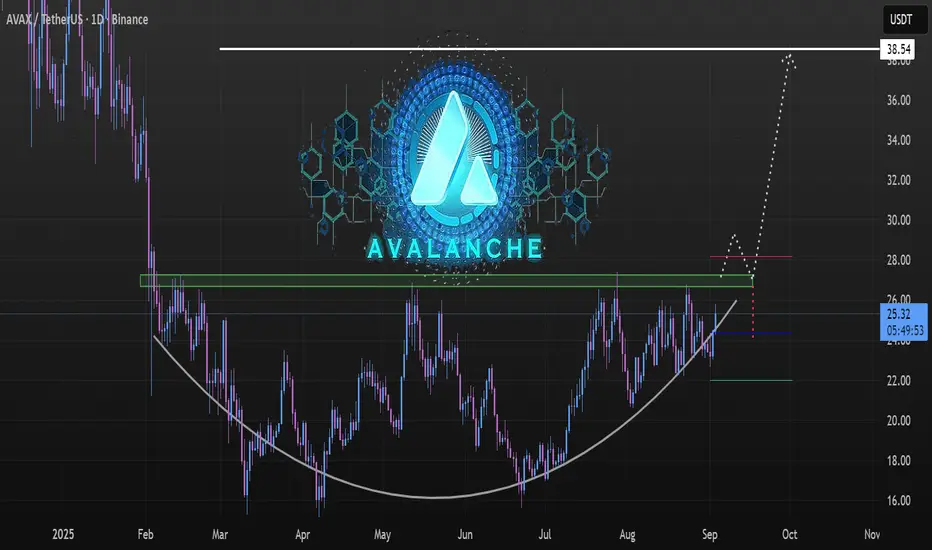
AVAX (Avalanche) 1D TF, Rounded Accumulation Phase BINANCE:AVAXUSDT Avalanche activity driven by DEXs, trading bots, whale memecoin speculation 📰
AVAX is Back in the Game, with the Alt season heating up 🌡️
At the time of charting Avax was trading above trendline support at $25.34, spotting a Positive Momentum Shift –Volume Likely to Expand, Psychological Recovery, reclaiming $25+ puts AVAX back in bullish radar after prolonged weakness.
Major Target: Sustained breakout projects to the measured move of the rounded base, aligning with 🎯$38.54, which is the chart’s major resistance and target➶ zone.
Chart Structure & Trend
Rounded Base Formation: From Aug 2025 to Sept 2025, AVAX formed a rounded bottom / cup ⊔ like structure, which often signals accumulation and a potential reversal from a bearish to a bullish phase.
Higher Lows 📈 Trendline a consistent series of higher lows, confirming strength in the uptrend.
Key Resistance Zone (Green 🟩 Band: ~$25.5–27.5): Price is consolidating at this supply zone where multiple rejections occurred earlier. This makes it the make-or-break level at the 5th time.
📈 Breakout Scenario
Trigger: A daily close above the green resistance band would confirm breakout strength.
Immediate Target: First move could extend towards the $28.50–29.00 minor resistance (red⭕ line area).
🪟Projection
Break above $27.5 → fast move to $29.
Sustained momentum → target $38.54 (≈ 52% upside from breakout).
⚠️Pullback / Risk Scenario
If rejection occurs at the green band, A deeper correction might revisit the price could retest $24.30 area (blue🔷 pivot line). but the rounded base structure remains intact unless that level fails.
“Markets don’t just price assets; they price belief, adoption, and time. For AVAX, the real question isn’t whether it can break resistance — it’s whether the ecosystem can keep compounding utility fast enough to justify the breakout. Are you watching the chart, or the chain?”
Always DYOR
Trade Safe,
See you on the other side

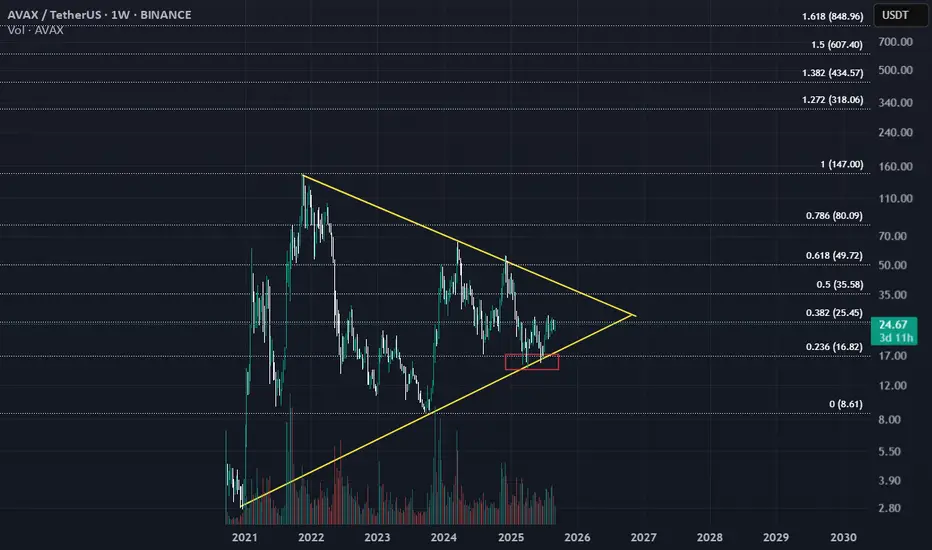
avax/usdt may be explode soon The current price of AVAX is $24.72, with a weekly high of $25.78 and a low of $22.67. The price has increased by 5.64% or $1.32 compared to the previous week's close.
The chart also displays several key technical indicators and levels:
Volume: The trading volume for the AVAX/USDT pair is shown at the bottom of the chart, with the current weekly volume at 12.03M.
Support and Resistance Levels: The chart appears to show a symmetrical triangle pattern, with the price consolidating between the support and resistance levels. The support level is around $16.82, while the resistance level is around $35.58.
Trend Lines: The chart shows along tterm triangle, indicating a potential exploding trend for the AVAX/USDT pair may be begin soon.
Note: dont forget put stop loss in each trade.
AVALANCHE - GOOD ENTRY FOR LONG SWING TRADE, 100%+AVALANCHE (AVAX) - Layer 1 blockchain, that functions as a platform for decentralized applications and custom blockchain networks. It is one of Ethereum’s rivals, aiming to unseat Ethereum as the most popular blockchain for smart contracts. It aims to do so by having a higher transaction output of up to 6,500 transactions per second while not compromising scalability.
Looking for an entry around $25 and exit around $50 on spot for a nice 2x. Its possible for price to move a bit lower in the short term depending on overall crypto market, however this is a good swing trade and any lower entry would be a better entry. You can wait for bullish volume and a catalyst if you feel its risky, or overall crypto/altcoin sentiment to increase.

AVAX Bullish Gartley IdentifiedThis Cypher harmonic shown in yellow is bullish because all the Fibonacci ratios align within textbook structure:
XA → B retrace: 0.442 (inside the valid 0.382–0.618 zone).
A → C extension: 1.138 (inside the valid 1.13–1.414 zone).
B → D retrace: 0.664 (close to the ideal 0.786 zone for completion).
These ratios confirm that the D point at ~24.0–24.2 represents a valid PRZ (Potential Reversal Zone). Price action already bounced from that zone and is holding above 24.6–24.7, which signals buyer defense and supports further upside.
🎯 Why Price Should Continue Up
The completion at D suggests the bearish swing has exhausted, and the Cypher is now entering its bullish reversal phase.
Indicators (MACD turning positive, Stoch RSI rising) confirm momentum is shifting upward.
Structure shows higher lows forming within the wedge, adding confluence.
📊 Next Price Targets (Profit Zones)
Target 1: 25.80 (0.236 Fib + wedge resistance)
First take-profit zone.
Target 2: 26.50 (mid-resistance, short-squeeze potential).
Target 3: 27.00–27.30 (strong resistance, wedge breakout target).
Stops should remain below 23.90, just under the D completion zone.
✅ Bottom Line
This Cypher is a bullish reversal pattern. With D completing near 24.0 and confirmation bounce already in play, AVAX has strong probability to climb toward 25.80 first, then 26.5–27.0 if momentum continues.

A Descending Triangle Chart Pattern in a making .. A descending triangle chart pattern in a making , if it break upwards go for long if its breaks downwards go for short visa versa always put STOPLOSS
AVAX 1D Analysis – Key Triggers Ahead💀 Hey , how's it going ? Come over here — Satoshi got something for you !
⏰ We’re analyzing AVAX on the 1-Day timeframe timeframe.
👀 In the daily timeframe of AVAX, after the drop it experienced, AVAX entered a box with a long-term range. The ceiling and floor of this box are in the area of $16 and $26. The time range of this box or its length is almost 170 days. At the ceiling of this box, there are strong seller tickers that get their sell orders activated every time the price reaches this area. To break this zone and for a good rise of AVAX, we need a very strong and high-volume momentum that causes a price jump and fills the sell orders.
💰 In the daily timeframe of AVAXBTC we can see a relatively good compression formed in this area, and with the breakout of the Bitcoin ceiling, more Bitcoin will be converted into AVAX and it can be a good confirmation for a long position and some spot buying. The area considered for the alarm zone is 0.0002286.
⚙️ Two key areas for RSI have been considered. Passing the swing limits of 61 and 40 can bring good volatility to AVAX and help it break out of this RSI compression that is seen as a box.
🕯 The area considered as the seller ticker is a strong one, and every time the price reached this area, we faced selling pressure. The size of the green candles is also larger compared to the red candles, and each time the compression area became smaller and the price is ready for a breakout and reaction (not today but next week).
🔔 The area we considered as the alarm zone for AVAX is $26, and with the breakout of this area, AVAX can move towards higher price levels. Price behavior at $26 can give us complete awareness for trading.
❤️ Disclaimer : This analysis is purely based on my personal opinion and I only trade if the stated triggers are activated .
AVAX: The Calm Before the Squeeze StormContext: Price has been retracing most of the move since the impulsive leg from Fri 22nd. I think AVAX is setting up for something big.
Perp Futures (1H)
Aggregated OI – COIN-margined: trending up heavily
Aggregated OI – Stablecoin-margined: trending down
What this means:
This divergence leans bullish. Rising coin-margined OI suggests risk-on players/strong hands are accumulating (often opening longs collateralized in AVAX). Falling stablecoin-margined OI points to retail de-risking/closing, so the drop isn’t accompanied by growing short interest. That’s a classic bottoming / squeeze setup if momentum flips.
Entry Zone (confluence)
Golden Pocket (0.618–0.65) from A→B as the base of the zone.
Confluence with the HTF Anchored VWAP (AVWAP) and the lower band of the LTF AVWAP (I kept only the HTF band on the chart for clarity).
We also have a LVN / Single Print at ~$30.
The trend-based Fib extension puts the projection needing a retrace to ~$22.80 for the math to line up—this is also the LTF 0.886 and completes a local harmonic.
Net: A lot of math + structure confluence at the blue box.
Entry Strategy
High chance we get a Swing Fail / stop-run into the lower edge of the band.
My entry = reclaim of the green line inside the blue box after the sweep (confirmation).
Could it go without the sweep? Yes—but I prefer the sweep to print divergence (RSI/CVD) before triggering.
Targets
Scale out on the way up: 0.618 → 1.0 → 1.272 → 1.618. The 1.618 aligns precisely with the $30 single print, so that’s a key take-profit / reaction level.
Invalidation
Structure: Idea is invalid on acceptance below the blue box. For me that’s a 1H close below ~$22.80 and failure to reclaim on the next candle.
Hard stop: below the sweep low of the blue box (give room for a wick; if we accept below, I’m out).
Flow tell: If coin-margined OI rolls over while stablecoin-margined OI rises (risk-off flip) into the drop, I stand aside.
If invalidated, watch the next magnets (downside 2.0/2.618 extensions or the next LVN).
Note: Losing these key levels can trigger a liquidation cascade—coin-margined longs are extra sensitive when price drops (collateral + position). Manage risk accordingly.
That’s my plan: Blue-box reclaim → ride the squeeze into $30 SP (1.618) with staged profits and tight invalidation below the box.
AVAX 4HAVAX is currently trading within a symmetrical triangle pattern, reflecting market indecision as lower highs and higher lows continue to form. This consolidation indicates that the market is preparing for a strong directional move.
Recently, price faced rejection near the upper boundary of the triangle, showing signs of seller pressure, while the rising trendline below is still acting as support. This setup suggests that the next breakout will likely define the trend.
✅ In a bullish scenario, a breakout above resistance would confirm buyer strength and could trigger a continuation of the upward move.
❌ On the bearish side, if price breaks below the ascending support, sellers may take control and drive the market back toward the bottom of the triangle, opening room for further downside.
Overall, AVAX is in a critical decision zone, and traders should be prepared for both scenarios—long entries on a confirmed breakout to the upside, or short opportunities if the lower trendline fails.

AVAX - BULLISH PENNANT CRYPTOCAP:AVAX - Setup shared few days ago around 23.00$ 📈
Current price 24.85$
80% chance to goes up for me! 🚀
I'm in 🚀

AVAX 4H – Breaking Downtrend, Will $24.5 Hold Above Demand Zone?Avalanche has broken above the downtrend resistance, with price pushing into the $24.5 area while still sitting on top of the $23–24 demand zone. This marks the first breakout attempt after multiple rejections.
If buyers hold above $24.5 and confirm the breakout, continuation toward higher levels becomes more likely. However, liquidity remains stacked below at $23.12 and $22.38, which could be swept before another leg higher.
Momentum indicators are stretched: Stoch RSI is in overbought territory, signaling possible short-term cooling, while the MACD Liquidity Tracker is beginning to turn positive.
Key levels:
– Demand Zone: $23–24
– Liquidity: $23.12, $22.38
– Breakout Test: $24.5

AVAXUSDT: Strong Buying MomentumThe AVAX chart is showing a clear bullish bias, holding firmly within an ascending triangle pattern with key resistance at the $25.6–$25.8 zone. Alongside positive macro signals, such as the Fed’s high likelihood of cutting interest rates in mid-September and renewed strength in risk-on assets, I expect AVAX to break through resistance.
The first target is projected around the $31–$32 zone, with the next target near $35.
Disclosure: I am currently holding an AVAX position with an average entry price of $22. This may influence my personal outlook on the market.

AVAX Analysis (1D)From the point where we placed the red arrow on the chart, it seems a correction has begun.
This correction appears to be a Diametric pattern, and wave E does not seem to be complete yet. It's expected that wave E will finish within the green zone.
The target could be the red box area.
A daily candle closing below the invalidation level would invalidate this analysis.
invalidation level: 10.90$
For risk management, please don't forget stop loss and capital management
When we reach the first target, save some profit and then change the stop to entry
Comment if you have any questions
Thank You

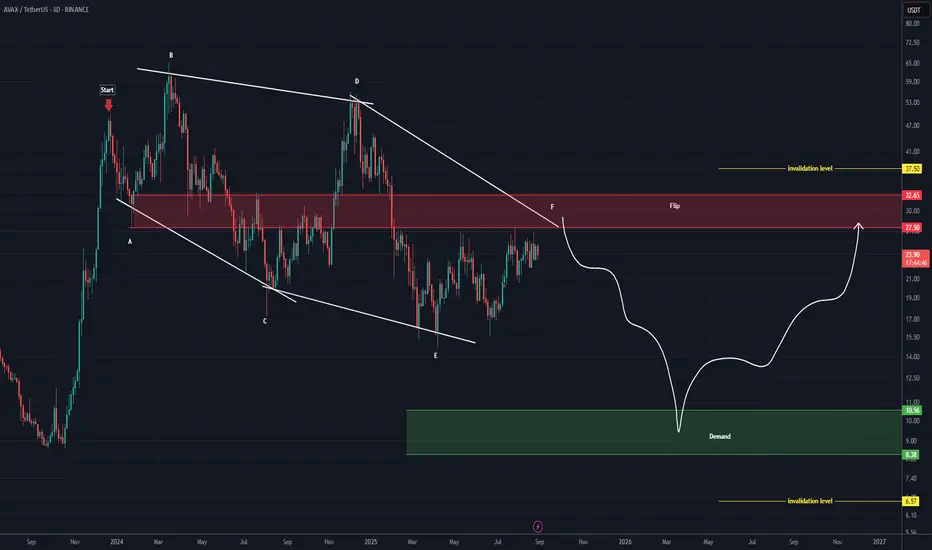
AVAX Analysis (3D)This analysis is an update of the analysis you see in the "Related publications" section
Before anything else, pay attention to the timeframe: it’s the 3-day timeframe.
The structure that AVAX is following is a large diametric, where wave F of this diametric is expected to end within the red-marked zone. After that, the price is anticipated to enter the bearish G wave.
Wave G could extend down to the main order block, which is the green-marked zone.
For both the bearish and bullish scenarios, the invalidation levels are marked on the chart. A daily candle closing above or below these levels will invalidate the respective outlook.
For risk management, please don't forget stop loss and capital management
Comment if you have any questions
Thank You
Avax/usdtAvax
Ekhnii osolt orj irehed belen bolson bna. 52-55 chuhal une tgd 1,2,3,4,5 zuraglal garna

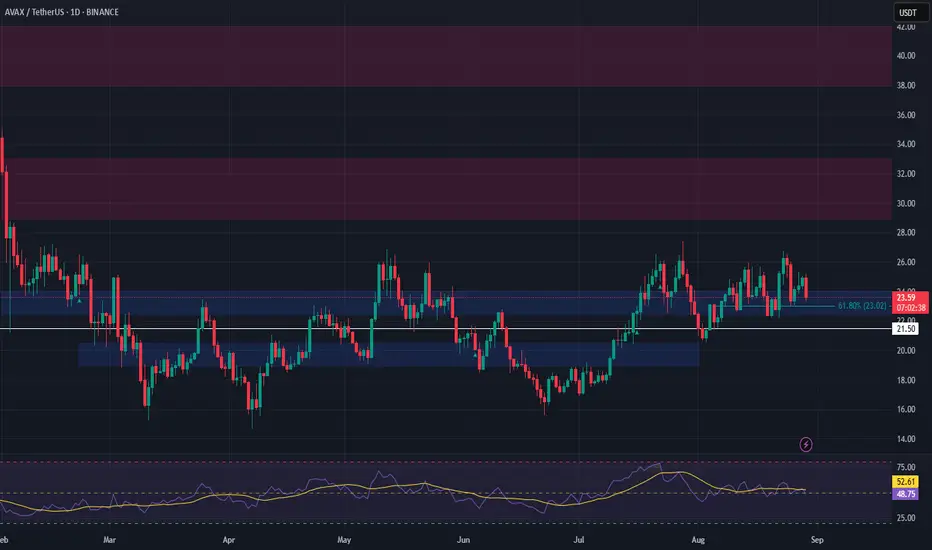
AVAX Setup – 61.8% Fib SupportAVAX is currently sitting on major support aligned with the 61.80% Fibonacci retracement, providing a high-confluence long spot opportunity.
Trade Setup:
• Entry Zone: $23.00 – $24.00
• Take Profit Targets:
🥇 $29.50 – $33.00
🥈 $38.00 – $42.00
• Stop Loss: $21.50
IT IS ALMOST $AVAX TIMEAVAX has been consolidating inside a symmetrical triangle for nearly 4 years. Dips get bought up, bullish news on every front, EW count says were ready for MACRO W3, fibs say were going to $350-$500. The breakout will stun those who arent in position, and if we do happen to get a dip I am loading more. CRYPTOCAP:AVAX is my single largest crypto position. LFG!

avax avalancheAvalanche is a layer one blockchain that functions as a platform for decentralized applications and custom blockchain networks. It is one of Ethereum’s rivals, aiming to unseat Ethereum as the most popular blockchain for smart contracts. It aims to do so by having a higher transaction output of up to 6,500 transactions per second while not compromising scalability.
