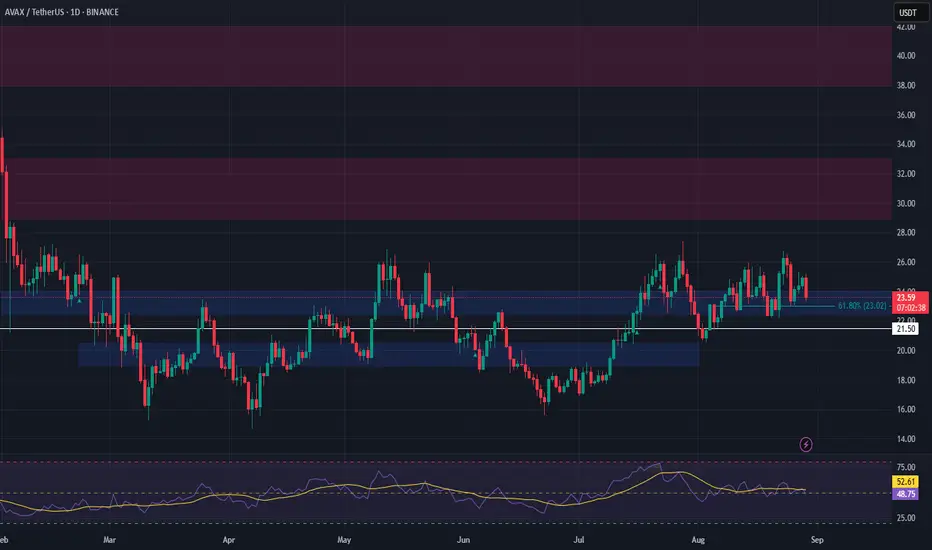
AVAX Setup – 61.8% Fib SupportAVAX is currently sitting on major support aligned with the 61.80% Fibonacci retracement, providing a high-confluence long spot opportunity.
Trade Setup:
• Entry Zone: $23.00 – $24.00
• Take Profit Targets:
🥇 $29.50 – $33.00
🥈 $38.00 – $42.00
• Stop Loss: $21.50
AVAXUST.P trade ideas
IT IS ALMOST $AVAX TIMEAVAX has been consolidating inside a symmetrical triangle for nearly 4 years. Dips get bought up, bullish news on every front, EW count says were ready for MACRO W3, fibs say were going to $350-$500. The breakout will stun those who arent in position, and if we do happen to get a dip I am loading more. CRYPTOCAP:AVAX is my single largest crypto position. LFG!

AVAX: The Calm Before the Squeeze StormContext: Price has been retracing most of the move since the impulsive leg from Fri 22nd. I think AVAX is setting up for something big.
Perp Futures (1H)
Aggregated OI – COIN-margined: trending up heavily
Aggregated OI – Stablecoin-margined: trending down
What this means:
This divergence leans bullish. Rising coin-margined OI suggests risk-on players/strong hands are accumulating (often opening longs collateralized in AVAX). Falling stablecoin-margined OI points to retail de-risking/closing, so the drop isn’t accompanied by growing short interest. That’s a classic bottoming / squeeze setup if momentum flips.
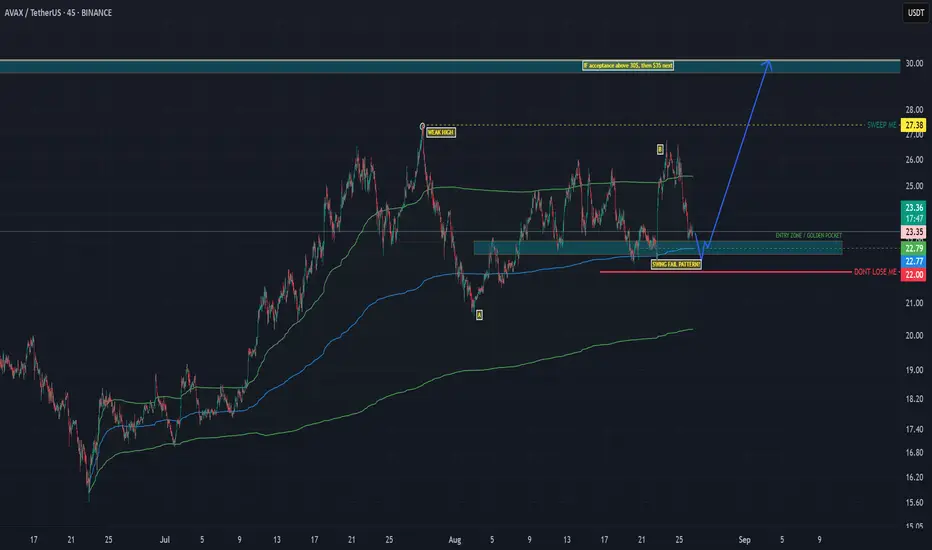
Entry Zone (confluence)
Golden Pocket (0.618–0.65) from A→B as the base of the zone.
Confluence with the HTF Anchored VWAP (AVWAP) and the lower band of the LTF AVWAP (I kept only the HTF band on the chart for clarity).
We also have a LVN / Single Print at ~$30.
The trend-based Fib extension puts the projection needing a retrace to ~$22.80 for the math to line up—this is also the LTF 0.886 and completes a local harmonic.
Net: A lot of math + structure confluence at the blue box.
Entry Strategy
High chance we get a Swing Fail / stop-run into the lower edge of the band.
My entry = reclaim of the green line inside the blue box after the sweep (confirmation).
Could it go without the sweep? Yes—but I prefer the sweep to print divergence (RSI/CVD) before triggering.
Targets
Scale out on the way up: 0.618 → 1.0 → 1.272 → 1.618. The 1.618 aligns precisely with the $30 single print, so that’s a key take-profit / reaction level.
Invalidation
Structure: Idea is invalid on acceptance below the blue box. For me that’s a 1H close below ~$22.80 and failure to reclaim on the next candle.
Hard stop: below the sweep low of the blue box (give room for a wick; if we accept below, I’m out).
Flow tell: If coin-margined OI rolls over while stablecoin-margined OI rises (risk-off flip) into the drop, I stand aside.
If invalidated, watch the next magnets (downside 2.0/2.618 extensions or the next LVN).
Note: Losing these key levels can trigger a liquidation cascade—coin-margined longs are extra sensitive when price drops (collateral + position). Manage risk accordingly.
That’s my plan: Blue-box reclaim → ride the squeeze into $30 SP (1.618) with staged profits and tight invalidation below the box.
A Descending Triangle Chart Pattern in a making .. A descending triangle chart pattern in a making , if it break upwards go for long if its breaks downwards go for short visa versa always put STOPLOSS
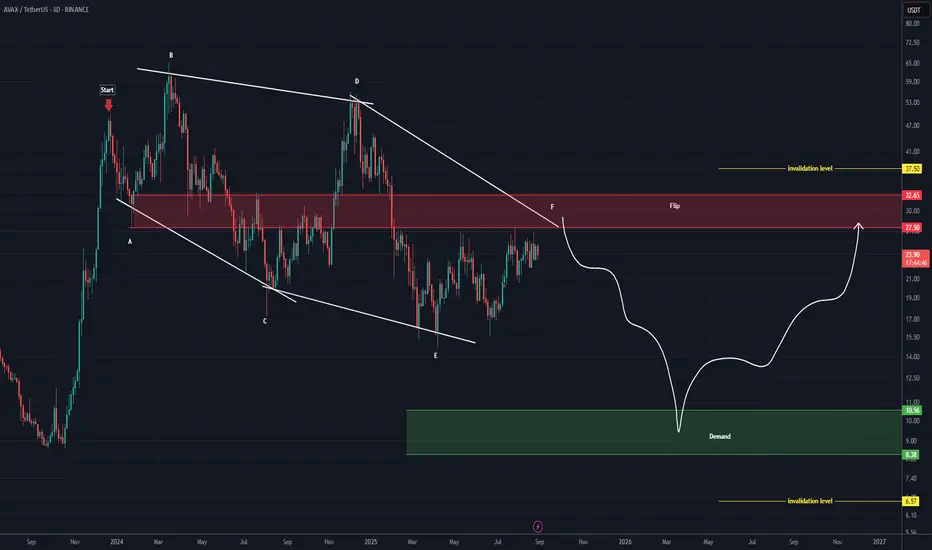
AVAX Analysis (3D)This analysis is an update of the analysis you see in the "Related publications" section
Before anything else, pay attention to the timeframe: it’s the 3-day timeframe.
The structure that AVAX is following is a large diametric, where wave F of this diametric is expected to end within the red-marked zone. After that, the price is anticipated to enter the bearish G wave.
Wave G could extend down to the main order block, which is the green-marked zone.
For both the bearish and bullish scenarios, the invalidation levels are marked on the chart. A daily candle closing above or below these levels will invalidate the respective outlook.
For risk management, please don't forget stop loss and capital management
Comment if you have any questions
Thank You
AVAX Analysis (1D)From the point where we placed the red arrow on the chart, it seems a correction has begun.
This correction appears to be a Diametric pattern, and wave E does not seem to be complete yet. It's expected that wave E will finish within the green zone.
The target could be the red box area.
A daily candle closing below the invalidation level would invalidate this analysis.
invalidation level: 10.90$
For risk management, please don't forget stop loss and capital management
When we reach the first target, save some profit and then change the stop to entry
Comment if you have any questions
Thank You

avax avalancheAvalanche is a layer one blockchain that functions as a platform for decentralized applications and custom blockchain networks. It is one of Ethereum’s rivals, aiming to unseat Ethereum as the most popular blockchain for smart contracts. It aims to do so by having a higher transaction output of up to 6,500 transactions per second while not compromising scalability.

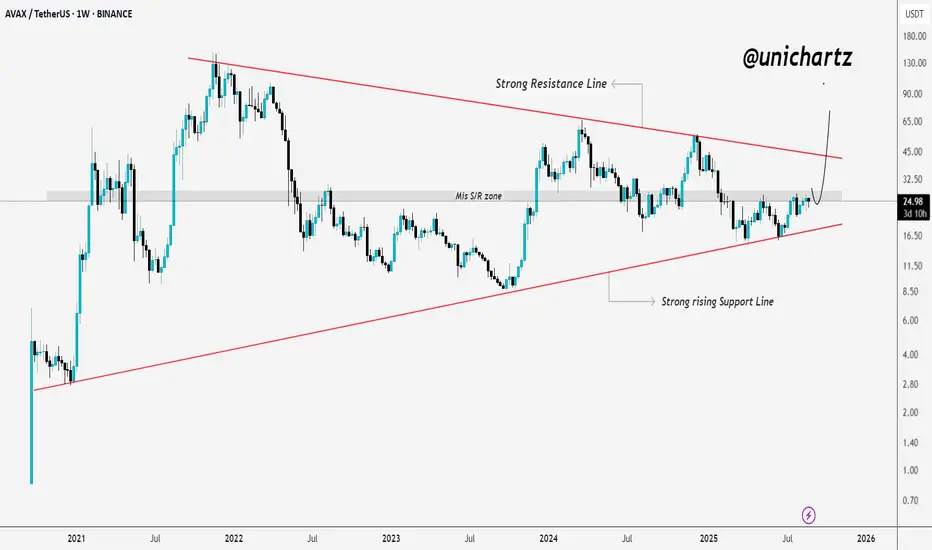
AVAX Prepping for Explosive Move – Watch the ZoneCRYPTOCAP:AVAX is showing strength on the weekly chart, approaching a key mid S/R zone that’s acted as a pivot in the past.
If bulls can break and close above this level, it could trigger strong upside momentum.
The price is currently squeezed between a rising support and a descending resistance, a typical breakout setup.
I’m waiting for a confirmed weekly close above the zone before looking for longs. If that happens, a move toward $42+ is likely.
DYOR, NFA
AVAXUSDT DailyThe chart of AVAX/USDT shows a rising channel that has been forming since March 2025. Price is moving up and down inside this channel, making lower highs and higher lows in a zig-zag pattern.
The projection suggests that after testing the upper side of the channel near $28, the price may fall back to the lower boundary around $18, and eventually break down towards $13–14.
This pattern indicates that while the market is still respecting the channel for now, the overall expectation is a bearish breakout in the medium term.
What do you think ?


AVAX: GOOD PRICE!!!Hello friends
Given the arrival of buyers and the good price growth, now that we are in a price correction, there is a good opportunity to buy in steps in the specified areas with risk and capital management and move towards the specified goals.
*Trade safely with us*

AVAX 4H – Rebound Toward TrendlineAVAX has rebounded off Fib retracement support and is now climbing back toward the descending trendline and resistance zone near $26.00.
Bullish path: A breakout above the trendline + resistance zone could shift momentum higher, opening a move toward $27.35.
Bearish path: Failure here risks another rejection, with downside targets aligning to the $23–22 Fib zone and liquidity at $20.64.
This setup sits at a decision point: either reclaim resistance and break structure, or roll back toward deeper liquidity grabs.

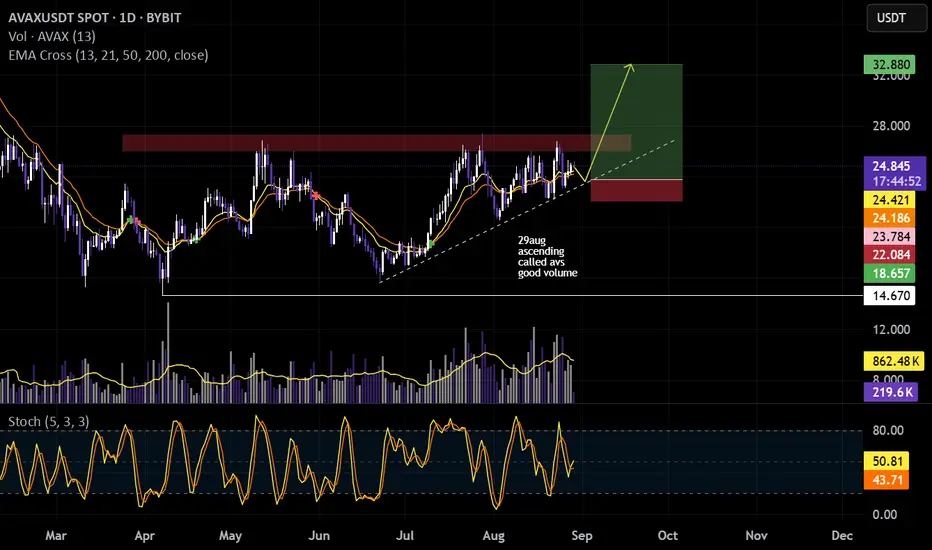
Avalanche & The Missing Bull Run PhaseWhat I noticed first about AVAX (Avalanche) was how strong prices remained after the 22-June low advance. Low prices are now gone forever... That's just the way it is.
AVAXUSDT peaked 28-July at $27 but the retrace that followed was minimum. Prices remain really strong and this is good for the bulls.
The action right now is happening close to resistance. Long-term, Avalanche has been sideways and this sideways is now happening at the upper-boundary of the range. This is also extra-bullish.
Notice how an ascending triangle developed on the chart. This same pattern is now present on hundreds of altcoins. This same pattern will lead to a positive outcome, a strong jump.
Imagine AVAXUSDT moving from $25 to $65 in one strong burst. Up and up non-stop. Think Aave or Bitcoin Cash.
That is what the chart looks like. That is what the chart is saying.
People can say the bull market is over, "Bitcoin already hit the top." Here I say that we still have to see the bull run, the most extraordinary phase of the entire cycle. Can't miss it, you have to participate.
Namaste.

AVAX T1 Incoming!
Bullish reversal confirmed from long-term support zone 🔥
Breakout from descending structure + clean higher low ➡️ momentum shift is ON 📈
Now pushing toward the first major resistance level 👀
🎯 Targets Ahead:
• $31.15 (T1 — loading...)
• $38.70
• $47.94
Time to pay attention! AVAX heating up 🔥

AVAX/USDT potential 150%++buy ZONE $24.75-$14.5
all targets are marked on the chart Fib ratio
it will follow SOLANA
fundamentally strong coin

We can see bullish stance in AVAXAVAXUSDT D
The chart shows a bullish stance, recently breaking out of consolidation. Key zones are marked where reactions may occur.
For an optimal entry, lower timeframes should be monitored

Will the Terror of 27 End for Avax?Avax is once again testing the 27 resistance. This level has been holding since March, rejecting Avax more than ten times. ( ).
Now, with tokenization becoming a hotter topic and upward pressure building across the broader crypto market, the weight on this resistance could start to grow. The consistently higher lows are another sign of rising bullish pressure. All Avax needs is a final push. Whether upcoming PPI and CPI data will help trigger the breakout remains to be seen.

Avalanche (AVAX): Signs of Upcoming Bullish MovementWe noticed a similar pattern, where each time after liquidity hunting near a local support area, we were entering into the next buyside movement, which might indicate that we are about to enter another one pretty soon.
We are looking for upward movement from this region, which would lead the RSI into overbought zones, giving us from there then an opportunity to short, but meanwhile we are longing!
Swallow Academy

AVAX 1D Trendline Support + Golden Pocket, Liquidity Above 26.80Avalanche is consolidating just above trendline support while holding the golden pocket retracement between 23.7 and 23.0. Momentum on the Stoch RSI is starting to curl up, signaling a potential bounce setup.
If buyers defend this level, price could aim for the 26.8 liquidity zone. A breakdown below 23 would expose the deeper 22.0 retracement, with major liquidity sitting at 15.6.
This is a critical level where structure and momentum align for the next move.

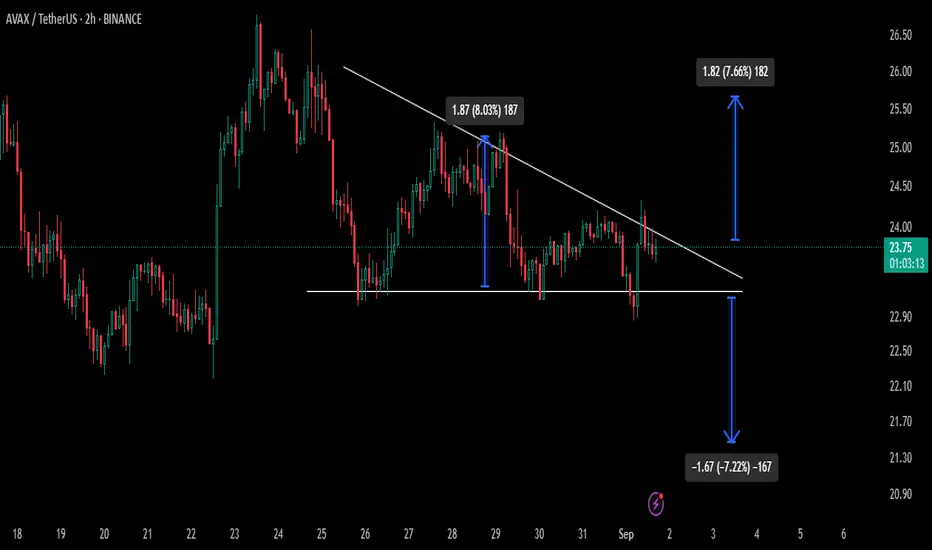
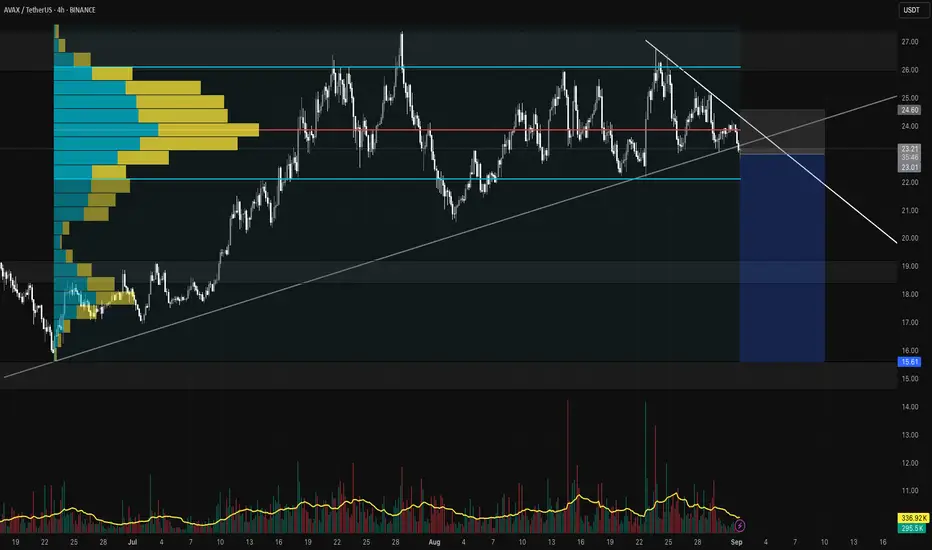
Volume Profile + Trendline Breakdown, Is AVAX Turning Bearish?Description:
AVAX is currently testing a critical trendline support around the $23 zone. Price has been consolidating within a descending triangle structure, with lower highs pressing down and a flat support zone being tested multiple times.
The Volume Profile (VPVR) shows heavy volume concentration between $23 – $25, suggesting this area has acted as a major battleground for buyers and sellers. A breakdown from here indicates that demand is weakening, opening the door for a deeper move to lower value areas.
Resistance Zones: $24.60 – $25.00 (supply overhead, capped by descending trendline)
Support Zones (Targets):
TP1: $19.20 (first key volume node / demand zone)
Final TP: $15.60 (major liquidity area & historical support)
Trade Idea:
If AVAX fails to reclaim above $23.50 – $24.00 and continues lower, a short setup could unfold toward the mentioned target zones. TP1 at $19.20 is the first demand zone to watch, while the final downside target rests near $15.60.
The Volume Profile significance here is that once price loses the high-volume support ($23 – $24), it may quickly travel toward lower-volume regions, as there is less historical trading activity to provide support.
Key Notes:
Break and close below trendline = bearish continuation.
Volume confirmation on breakdown will add conviction.
Manage risk properly, as false breakdowns are possible.
Happy Trading, Best Regards!-Harshit
Disclaimer : This is not financial advice. Please do your own analysis before entering any trade.
Avalanche seeks to retest $23.6 ┆ HolderStatBINANCE:AVAXUSDT on the 6h chart has rebounded from the $23.5 support zone, showing strength after a series of ascending triangle formations. The price action is coiling within a larger channel, with repeated rebounds confirming this level as a key base. If momentum continues, $25–27 becomes the next upside objective while $23.5 remains critical as invalidation.

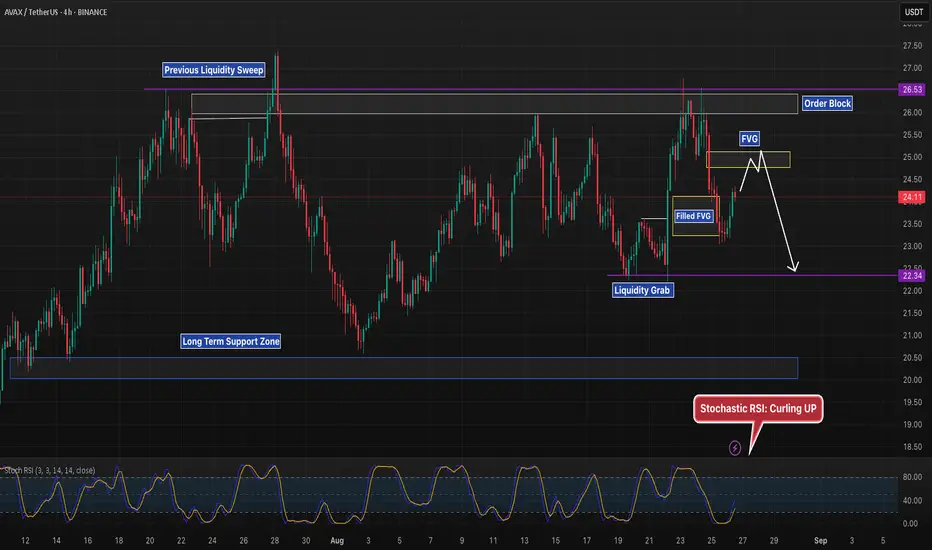
AVAX 4H – Liquidity Grab Into Support, Momentum Turning?Avalanche has completed a liquidity grab near 22.34 before bouncing, with Stoch RSI now curling up for momentum support.
Key levels on watch:
Upside: If price reclaims through the filled FVG, continuation into the next FVG and order block around 26.5 is possible.
Downside: Failure to hold could drag price back into the liquidity grab level and long-term support zone below.
The reaction from this filled FVG, paired with momentum curling, will determine whether AVAX trends higher or retests deeper support.