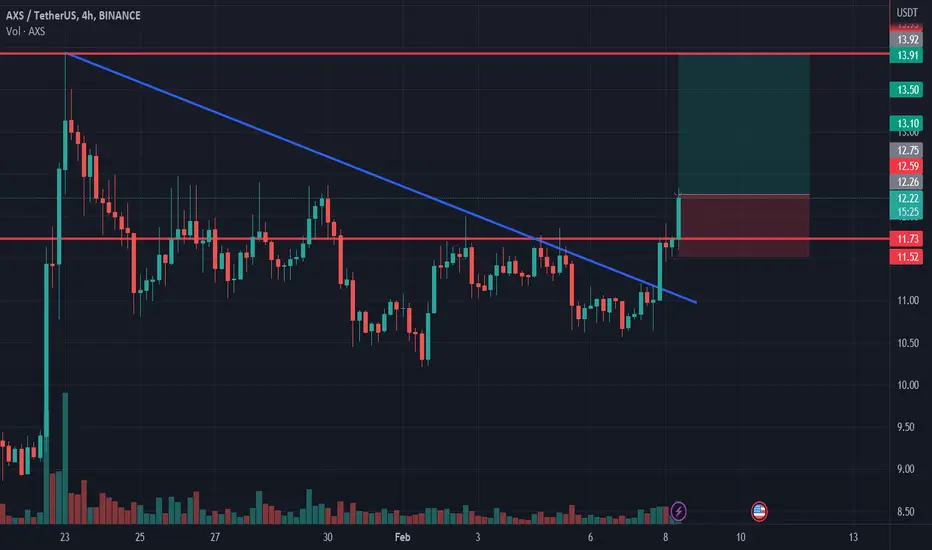
AXS LONG SETUPHi, dear traders. how are you ? Today we have a viewpoint to BUY/LONG the AXS symbol.
For risk management, please don't forget stop loss and capital management
When we reach the first target, save some profit and then change the stop to entry
Comment if you have any questions
Thank You
AXSUSDT.5S trade ideas

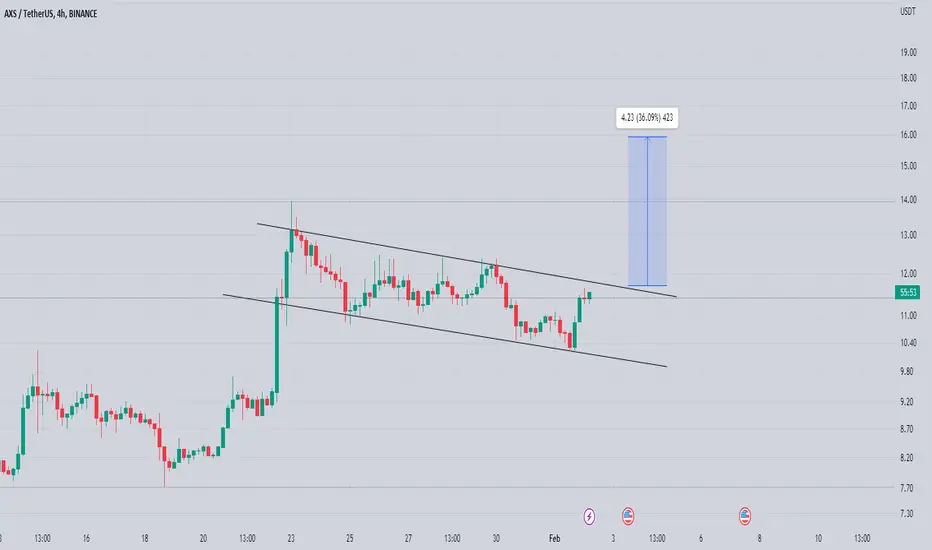
AXSUSDT is inside a bullflagAXSUSDT is inside the bull flag
A bullflag is a chart pattern that occurs in an upward trending market and is characterized by a period of consolidation or retracement within a parallel channel, creating a flag-like shape. The pattern is considered bullish as it often precedes a continuation of the uptrend.
In this case, AXSUSDT is testing the 0.618 Fibonacci level inside a bullflag formation.
The price has increased 63% since the previous idea after a clear breakout from a descending channel. Additionally, the price created an engulfing pattern on the daily support at the 10$ area, which could be a bullish signal, so According to Plancton's strategy , we can set a nice order
–––––
Keep in mind.
🟣 Purple structure -> Monthly structure.
🔴 Red structure -> Weekly structure.
🔵 Blue structure -> Daily structure.
🟡 Yellow structure -> 4h structure.
⚫️ black structure -> <= 1h structure.
–––––
Follow the Shrimp 🦐

AXS longAXS broke trough the descending trendline. Asset broke trough the resistance level. Bullish movement to resistance level at 13.9 is expected to happen.
AXSUSDT | SYMMETRICAL TRIANGLE BREAKOUTAXS after breakout has been trading in a bullish trend .
The price has been converged and trading above the triangle.
Now bulls need to hold the breakout zone.
Manage your trades accordingly.


Bullish SetupDescending Channel Is a Main Pattern Formed At The AXS Chart And I Expect a Breakout From a Trend Line In Near Future ,11$ Is My Buy Zone And 13.1$ Is a Target In Short Term

AXSUSDT…strong support#AXSUSDT
Looking at the chart, you can see that AXS has formed a strong support at the Fib61% retr.
It is a very good resistance, but need one more thing to confirm that it’s going up to 14$, what is it?

Can bulls do it?Hello every one
Today i want to share my idea with u.
On the 3-day time frame, we notice the intersection of the upper part of the descending channel with the red horizontal resistance
This intersection (yellow zone) indicate a strong resistance for the bulls to break it
Keep your eyes on it.👀
We expect a breakout to occur soon, and if this happens, we expect a strong rise of 300%
Don't forget to support us with ur like and follow me for more updates.💙
Good luck👌


Axsusdt Looks Pretty Good Here Formed Descending Broadening wedge In Daily timeframe
Seems like Axs bottomed an out d building Up for massive breakout
Incase Of successful breakout expecting 250 to 300% bulish Move

Bullish Pennant - 4h - AXSTriple bottom - 4h - AXS
Entry : 11.266
Resistance: 11.208
Target: 11.6
Position: long
BINANCE:AXSUSDT
BINANCE:AXSUSDT

Triple bottom - 15m - AXSTriple bottom - 15m - AXS
Support : 11.04
Resistance: 11.32
Position: long
BINANCE:AXSUSDT

AXSUSDT | SETUPAXS after breakout has been trading in a bullish trend .
The price has now been trading in a symmetrical triangle.
The price has bee converging.
Currently the price is trading at higher side of triangle.
Now bulls need to break above the triangle.
Manage your trades accordingly.


AXS/USDT Breakout in process Hey Traders!
Let's take a look at AXS/USDT pair here. After having a break of structure price of AXS went for a another attempt to breakout from that triangle formation. Currently we are waiting for cleaner breakout from current levels in order to have a nice bullish movement towards "weak high" zone
If you like ideas provided by our team you can show us your support by liking and commenting.
Yours Sincerely,
Swallow Team 🔱
Disclamer:
We are not financial advisors. The content that we share on this website are for educational purposes and are our own personal opinions.

Axs Forming Bulish Flag Forming Bulish Flag In h4 timeframe
Incase Of breakout Expecting 25 to 30% bulish
axsusdt breakout triangle pattern buy signal axsusdt
breakout triangle pattern buy signal break out chart pattern

AXSUSDT LONG SIGNALS!!!!!Hi, friends. Nice to meet you.
EXY's got support now because she's above the moving average.
Long RBI in the face of an important sales!

AXS/USDT - More up to come.Whichever way you look at this it seems to have broken upwards after some consolidation.
AXS has certainly been popular in the past and had a strong run up in this mini cycle.
Targeting the upper fib levels wth profit taking around the $18.8 mark

Resistance at $19.12 is the price targetAs long as the uptrend line is not broken, the uptrend will continue. Resistance at $19.12 is the price target.

AXS/USDT - (LOOKING BEARISH)axs/usd looking bearish technically
iam taking trade in axs at the price of 11.60$
chart patterns
harmonic patterns

AXS/USDT (Looking bullish)axs usdt technically looking bullish
my buy zone is 11.4$
stoploss 11.15$ - 2.4%
target 13$ - 15%

Keeping a close eye on Axie. Potential breakout comingAxie has been in a bear market since peaking in Nov 21 and is now currently testing the bear market trendline that has been a major resistance level for sometime now.
My idea is with many cryptos rallying in price its highly probable that Axie can breakout of the downward trendline its currently up against. If a breakout does occur there is a strong possibility that the next resistance zone will be tested which is at approx $19 to $24.
But beware that if price gets rejected from trendline resistance then we could see a retracement to the $8 zone or even major support (red line)
