Don't stop a trainAXS teaches us to not try and stop the train. It's trend is going down, no doubt about it. And it trends hard when it trends.
AXSUST.P trade ideas

Axie Infinity (AXS) - February 23Hello?
Traders, welcome.
If you "follow", you can always get new information quickly.
Please also click "Like".
Have a good day.
-------------------------------------
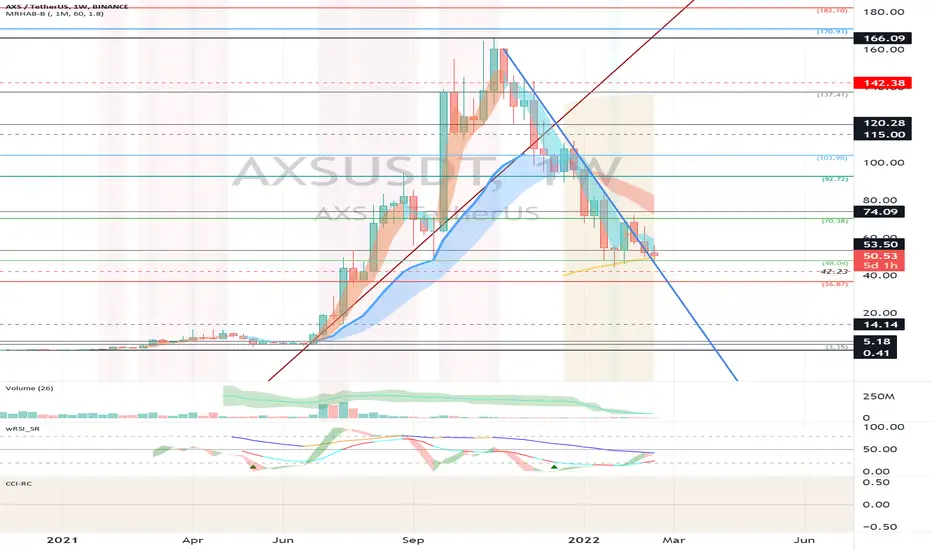
(AXSUSDT 1W Chart)
First resistance section: around 70.38
Second resistance section: 92.72-103.90
Support section: 36.87-48.04
It is important to keep the price above the 53.50 point in order to completely break out of the downtrend line.
If it goes down, you should check to see if you find support in the support zone.
(1D chart)
In the movement between February 25th - March 13th, it is necessary to check which point in the section 36.87-48.04 deviates.
If it falls below the 36.87 point, there is a possibility that it will fall near the 14.14 point, so a Stop Loss is required to preserve profit and loss.
A move above the 48.04 point is expected to lead to a move to move above the 70.38 point.
However, careful trading is required as it is expected to swing up and down to cross the M-Signal line of the 60SMA and 1W charts.
This movement is expected to occur near the 59.03 point.
-------------------------------------
(AXSBTC 1W chart)
Resistance range: 0.001906-0.002143
Support period: 0.000723-0.000960
It is important to rise above the 0.001433 point.
In particular, it should break out of the downtrend line.
Otherwise, it is expected to consolidate in the 0.000960-0.001433 section.
------------------------------------------
We recommend that you trade with your average unit price.
This is because, if the price is below your average unit price, whether the price trend is in an upward trend or a downward trend, there is a high possibility that you will not be able to get a big profit due to the psychological burden.
The center of all trading starts with the average unit price at which you start trading.
If you ignore this, you may be trading in the wrong direction.
Therefore, it is important to find a way to lower the average unit price and adjust the proportion of the investment, ultimately allowing the funds corresponding to the profits to be able to regenerate themselves.
------------------------------------------------------------ -------------------------------------------
** All indicators are lagging indicators.
Therefore, it is important to be aware that the indicator will move accordingly as price and volume move.
However, for convenience, we are talking in reverse for the interpretation of the indicator.
** The MRHAB-O and MRHAB-B indicators used in the chart are indicators of our channel that have not been released yet.
(Since it was not disclosed, you can use this chart without any restrictions by sharing this chart and copying and pasting the indicators.)
** The wRSI_SR indicator is an indicator created by adding settings and options to the existing Stochastic RSI indicator.
Therefore, the interpretation is the same as the traditional Stochastic RSI indicator. (K, D line -> R, S line)
** The OBV indicator was re-created by applying a formula to the DepthHouse Trading indicator, an indicator disclosed by oh92. (Thanks for this.)
** Support or resistance is based on the closing price of the 1D chart.
** All descriptions are for reference only and do not guarantee a profit or loss in investment.
(Short-term Stop Loss can be said to be a point where profit and loss can be preserved or additional entry can be made through split trading. It is a short-term investment perspective.)
---------------------------------
Possible long on AxieWe will likely see the volatility spike on $AXS as it is bouncing off the long-term support level and the major descending trendline is pretty close to the price right now. In case of the breakout through the trendline - bullish movement in expected to continue and reach the resistance level at 112$

AXSUSDT 4H TF IdeaAXS possible H&S pattern on 1D TF.. Possible scenario |||| (if BTC don't suck things up) lmao
DYOR

🔻 AXS short 🔻hello traders and investors.
we can open a short position if the daily candle closes below the moving average.
Disclaimer: this is not a piece of financial advice, always do your own research.


#AXSUSDT 4H Chart
Price perfectly tested the 2h demand zone from where it bounced from and is currently moving up. MACD is showing some bullish momentum, RSI is slightly below 50% and EMAs are bearish. I am still waiting for further confirmation and price needs to break above $57 and create a new higher high in order to continue with the bullish movements.

Axie Infinity shortAxie Infinity bounced off the resistance area. Asset bounced off the upper boundary of descending channel. Decline to support level at 47 is expected to happen.


Good Sign For AXS/usdt AXS showing a good u trend with good sign to go Long
Targeting 143 then 161 then 189
stoploss 1 hour close under 111 or breaking out the trend line
goodluck

AXSUSDT (Short)AXSUSDT in downward trend
Short
Entry at 54.39
Stop loss at 55.55
Take Profit at 53.08

Update on AXS/USDT LongThis is an update to a previous trade I had posted. We can now see a falling wedge being formed as consolidation from the previous leg up. I would get in while we are at the support level and long it to the targets shown in my chart.

Axs can pump from down of parallel?BINANCE:AXSUSDT
Keep eyes on it 👀🕵️👁️
Don't forget Financial management and step
by step purchasing 💹💰💵💲
Please fallow me 🙏🥺
Please leave comments 🗨️💬
Like and share with your friends 👍💑
I hope you enjoy ☺️🌈🎉🎊🎁

AXS should make a decisionThe price range of 55.4 to 55.72 is very important for AXS.
Failure below 55.4 or support above 55.72 ?
what do you think ?
comment your idea

AXSUSDTGeneral Guide:
1.) Anything above price is a resistance, anything below is support.
2.) Proceed with caution when taking a trade based off of this chart.
3.) Make a copy of it to watch it in real-time. Click the share button, then "Make it Mine"
4.) It is very risky to set limit orders, I advise you to set alarms and when it hits, check how it reacts.
5.) Watch the BTC pair closely as price will generally follow that pair.
6.) Definition of Terms:
Bearish/Bullish Order Block (OB) - Price rejects or bounces respectively.
(Monthly/Weekly/Daily) Liquidity - Where retail stop loss orders are.
pm/pw/pd/pr - Previous Month/Week/Daily/Range
VAH/VAL/POC - Value Area High/Low and Point of Control (70% of traded volume in a range)
OTE - Optimal Trade Entry
Rectangles - Liquidity Pools
Diagonals - Probably a Fib Resistance Fan, Pitchfork or Pitch fan
nPOC - Naked Point of Control
Eq - Price Equilibrium
Single Prints - Liquidity Voids

💥AXS FALLING WEDGE - TO FALL TO $45Please support this idea with a LIKE👍 if you find it useful🥳
Not a financial advice🙅🏼♂️
Right here is a falling wedge pattern with two reliable support zones on the trendline and two reliable resistance zones on the trendline.
Price just tested the inner trendline resistance zone and it’s making it way down to the lower trendline within $45 - $47.
Therefore, I expect a fall within this price range.
What do you think?
Share your opinion in the comment section✍️
Follow me stay updated about this coin and more helpful projects like this🎁
Happy Trading💰🥳🤗
