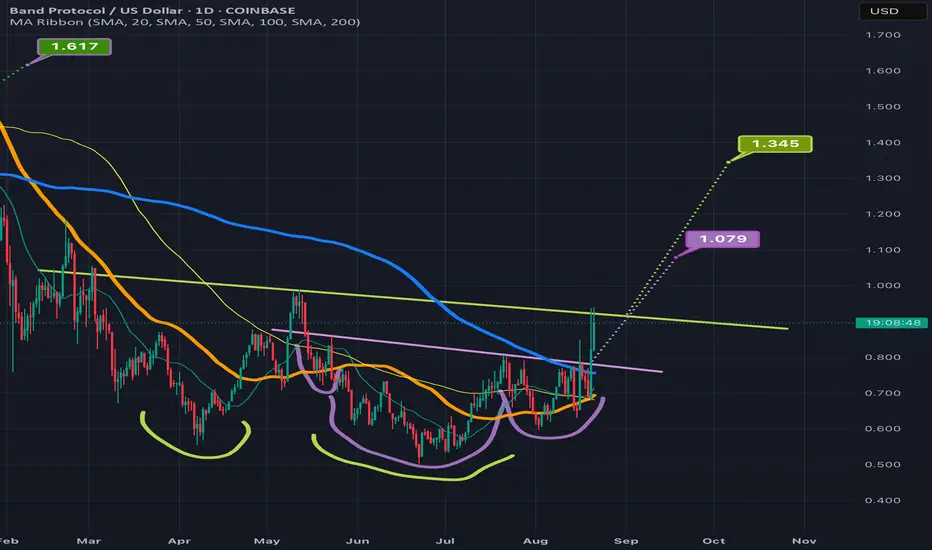
BANDUSD attempting an invh&s + double bottom breakoutBAND has been available for a significant iscount lately but the sale may be ending soon as it is now attempting both an inverse head & shoulders breakout, as well as sending wicks above the neckline of a slightly larger double bottom pattern. The double bottom pattern is in chartreuse and the inver
BAND time to reverseBAND is oversold with longterm bull divergence. I see last 3 years as accumulation range (similar one as XRP had) and expect soon bounce up toward ATH range, possible even wick to new ATH and from there we start ranging again - either for distribution or reaccumulation (for further move up).

BANDUSD - LongBuy entry at 0,7609 USD with a stop loss 0,5311 USD.
Profit taking at: 2,213 USD, 3,202 USD and 4,233 USD.

Possible Wedge $BANDPROTOCOL (1 Week)If $BANDPROTOCOL can break the wedge it is currently stuck in and repeat previous market patterns then it is possible for $BANDPROTOCOL to explode back up to the $40 to $100 range

BAND dip entry swing trade opportunity?I know it doesnt seem like much of a dip but in the ascending channel it has assumed, it is a dip to bottom of channel. I have been posting a bunch of momentum trade targets where a resisting trendline is broken and assets break out once they finally break through, but a lot of those can leave you

Band currently retesting neckline as support on invh&sNo guarantee it will hold that support but if it does, the breakout that is triggered afterwards should take us to the target shown here. *not financial advice*

Band Protocol (BAND)Band Protocol chart is simple: an impulse wave followed by a corrective wave. Recently, Band broke the downtrend line and now showing signs of reversal. Let's see what happens.

$BAND to $28?I think NASDAQ:BAND could be one of the better performing coins this next cycle. While it hasn't really made a move yet, because of the bullish narrative of ETH, I think this coin finally has it's run.
Once NASDAQ:BAND can break above the $2.65 level, it looks set for new highs.

Master class for the crypto class of '24Actually used ETC's market structure 2018-2021 to visualize what could be waiting for the crypto class of '21.


See all ideas
Summarizing what the indicators are suggesting.
Oscillators
Neutral
SellBuy
Strong sellStrong buy
Strong sellSellNeutralBuyStrong buy
Oscillators
Neutral
SellBuy
Strong sellStrong buy
Strong sellSellNeutralBuyStrong buy
Summary
Neutral
SellBuy
Strong sellStrong buy
Strong sellSellNeutralBuyStrong buy
Summary
Neutral
SellBuy
Strong sellStrong buy
Strong sellSellNeutralBuyStrong buy
Summary
Neutral
SellBuy
Strong sellStrong buy
Strong sellSellNeutralBuyStrong buy
Moving Averages
Neutral
SellBuy
Strong sellStrong buy
Strong sellSellNeutralBuyStrong buy
Moving Averages
Neutral
SellBuy
Strong sellStrong buy
Strong sellSellNeutralBuyStrong buy
Displays a symbol's price movements over previous years to identify recurring trends.