AAL Breakout, or One More Dip to ~8$?Looks like AAL is on the verge of completing a multi-year correction
American Airlines Group Inc. Shs Cert Deposito Arg Repr 0.5 Sh
No trades
475 ARS
774.66 B ARS
49.64 T ARS
About American Airlines Group, Inc.
Sector
Industry
CEO
Robert D. Isom
Website
Headquarters
Fort Worth
Founded
2013
Identifiers
2
ISINARBCOM4603W8
American Airlines Group, Inc. is a holding company, which engages in the operation of a network carrier through its principal wholly owned mainline operating subsidiary, American. The firm offers air transportation for passengers and cargo. It operates through the following geographical segments: Domestic, Latin America, Atlantic, and Pacific. The company was founded on December 9, 2013, and is headquartered in Fort Worth, TX.
Related stocks

AALTechnical Analysis:
-Accumulation with clear presence of institutional volume.
-Noticeable buying pressure in a bullish divergence on the MACD indicator.
Fundamental Analysis:
American Airlines has secured its long-term capacity growth and fleet modernization with a massive order for 440

American Airlines | AAL | Long at $13.34As the Great American Wealth Transfer happens, people are using that money to travel more (after all, few can afford to transfer that wealth into real estate). Airline data show passenger counts are increasing rapidly and with airfares expected to rise, this sector is likely to go through a long-awa

American Airlines (NASDAQ: $AAL) Tracks Spirit Bankruptcy MovesAmerican Airlines Group Inc. (NASDAQ: AAL) traded at $14.81 on December 5, gaining 3.35% as the airline enters the latest stage of Spirit Airlines’ ongoing bankruptcy. A new court filing shows American Airlines has formally submitted a notice of appearance in the Spirit Aviation bankruptcy case, req

AAL Bullish Trend Signals Opportunity on RetracementAmerican Airlines (AAL) maintains a bullish sequence from the April 4 low, supporting prospects for further upside. A 100% Fibonacci extension projects a target of $16.8, reinforcing the constructive technical outlook. The short‑term cycle from the September 30 low is unfolding as a zigzag Elliott W

AAL - American Airlines ready for take-off?Growing Revenue, chart stabilising...Is NASDAQ:AAL looking to make a move to the upside?
Our systems have identified a point of potential interest & volatility in AAL.
If price can hold above $11.50 ... Significant Bullish potential may be unlocked.
If however price falls below $11

QuantSignals V3: AAL Neutral-to-Bearish Intraday MoveAAL QuantSignals Katy 1M Prediction 2025-11-20
Prediction Type: 1-Month (Katy AI)
Current Price: $12.47
Trend: NEUTRAL
Confidence: 55%
Volatility: 42.9%
Trade Signal: SHORT
Entry: $12.47
Target: $12.42
Stop Loss: $12.66
Expected Move: -0.52%
Technical Summary:
Price near current neutral rang

The American Fall Key risk factors
Weak earnings and guidance
The company reported a third-quarter net loss of about $111 million (≈ $0.17 per share) excluding special items.
full-year adjusted EPS outlook is low (between ~$0.65 and ~$0.95) and constrained, which has analysts signalling risk.
American Airlines N

$AAL Bearish below $12 and 20 MA?The US Gov't shutdown continues to have major knock-on effects. One of them being disruption to airlines due to the Air Traffic Controllers being out of work. This adds to an overall bearishness across aviation/defence/airline stocks.
American Airlines has earnings before the open on Thursday. Look

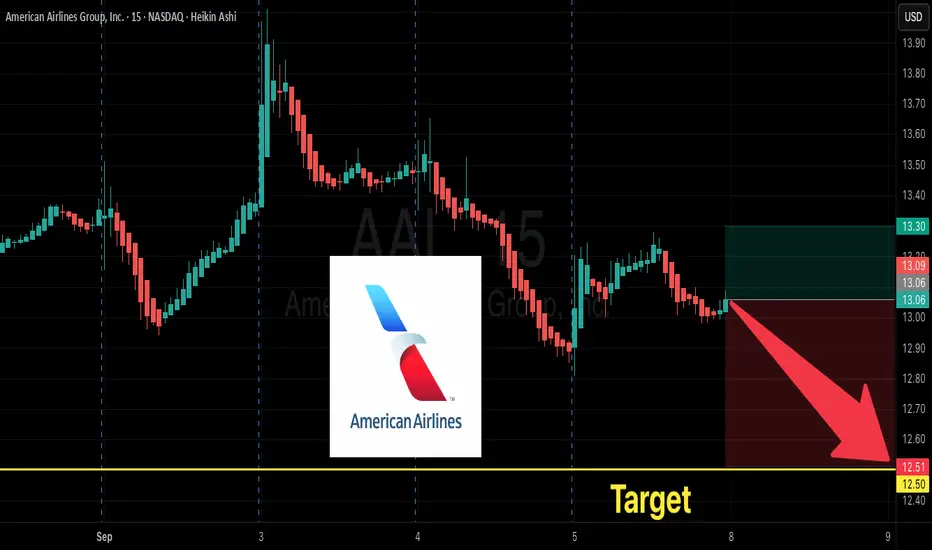
AAL Breakdown Setup — $12.50 PUT Trade Idea!
# 🐻 AAL Weekly Bearish Setup — \$12.50 PUT 🎯 (Sep 12 Expiry)
📊 **Summary**
* **Momentum:** Daily RSI 53.4 falling, Weekly RSI 64.4 falling → downside tilt.
* **Volume:** +30% on a red week → institutional distribution.
* **Options Flow:** Call/Put ratio 1.65 (bullish flow) but likely **retail/cov
See all ideas
Summarizing what the indicators are suggesting.
Oscillators
Neutral
SellBuy
Strong sellStrong buy
Strong sellSellNeutralBuyStrong buy
Oscillators
Neutral
SellBuy
Strong sellStrong buy
Strong sellSellNeutralBuyStrong buy
Summary
Neutral
SellBuy
Strong sellStrong buy
Strong sellSellNeutralBuyStrong buy
Summary
Neutral
SellBuy
Strong sellStrong buy
Strong sellSellNeutralBuyStrong buy
Summary
Neutral
SellBuy
Strong sellStrong buy
Strong sellSellNeutralBuyStrong buy
Moving Averages
Neutral
SellBuy
Strong sellStrong buy
Strong sellSellNeutralBuyStrong buy
Moving Averages
Neutral
SellBuy
Strong sellStrong buy
Strong sellSellNeutralBuyStrong buy
Displays a symbol's price movements over previous years to identify recurring trends.
USU02413AJ8
American Airlines, Inc. 8.5% 15-MAY-2029Yield to maturity
7.14%
Maturity date
May 15, 2029
US23771T32
American Airlines, Inc. 7.25% 15-FEB-2028Yield to maturity
6.48%
Maturity date
Feb 15, 2028
USU02413AH2
American Airlines, Inc. 7.25% 15-FEB-2028Yield to maturity
6.18%
Maturity date
Feb 15, 2028
AAL4867590
American Airlines, Inc. 3.5% 15-FEB-2032Yield to maturity
—
Maturity date
Feb 15, 2032
AAL5288053
American Airlines, Inc. 2.875% 11-JUN-2034Yield to maturity
—
Maturity date
Jun 11, 2034
USG0R209AB6
AAdvantage Loyalty IP Ltd. 5.75% 20-APR-2029Yield to maturity
—
Maturity date
Apr 20, 2029
AAL4327177
American Airlines, Inc. 4.1% 15-JAN-2028Yield to maturity
—
Maturity date
Jan 15, 2028
AAL4526209
American Airlines, Inc. 3.35% 15-OCT-2029Yield to maturity
—
Maturity date
Oct 15, 2029
AAL6218929
American Airlines, Inc. 4.9% 11-MAY-2038Yield to maturity
—
Maturity date
May 11, 2038
AAL4867591
American Airlines, Inc. 3.85% 15-FEB-2028Yield to maturity
—
Maturity date
Feb 15, 2028
AAL4867589
American Airlines, Inc. 3.15% 15-FEB-2032Yield to maturity
—
Maturity date
Feb 15, 2032
See all AAL bonds
Curated watchlists where AAL is featured.

