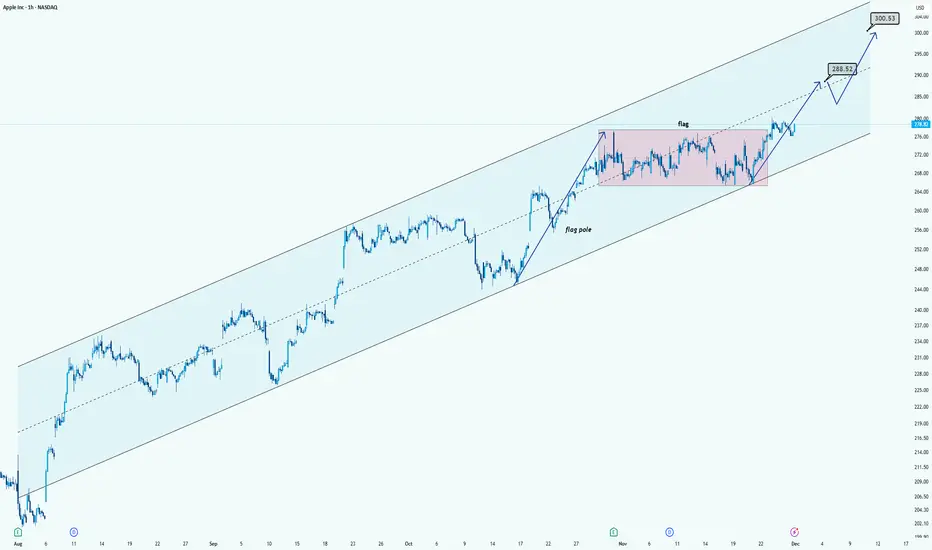
AAPL Chart AnalysisHi!
AAPL is trading inside a clean long-term ascending channel, showing a strong uptrend. Recently, the price formed a bullish flag (pink zone) after a sharp move up. The breakout above the flag signals continuation of the trend.
The chart projects two key upside levels:
$288.52 as the first tar
Key facts today
425 ARS
127.15 T ARS
472.41 T ARS
About Apple Inc
Sector
Industry
CEO
Timothy Donald Cook
Website
Headquarters
Cupertino
Founded
1976
ISIN
ARDEUT116183
FIGI
BBG000S0MPB6
Apple, Inc engages in the design, manufacture, and sale of smartphones, personal computers, tablets, wearables and accessories, and other variety of related services. It operates through the following geographical segments: Americas, Europe, Greater China, Japan, and Rest of Asia Pacific. The Americas segment includes North and South America. The Europe segment consists of European countries, as well as India, the Middle East, and Africa. The Greater China segment comprises of China, Hong Kong, and Taiwan. The Rest of Asia Pacific segment includes Australia and Asian countries. Its products and services include iPhone, Mac, iPad, AirPods, Apple TV, Apple Watch, Beats products, Apple Care, iCloud, digital content stores, streaming, and licensing services. The company was founded by Steven Paul Jobs, Ronald Gerald Wayne, and Stephen G. Wozniak in 1976 and is headquartered in Cupertino, CA.
Related stocks
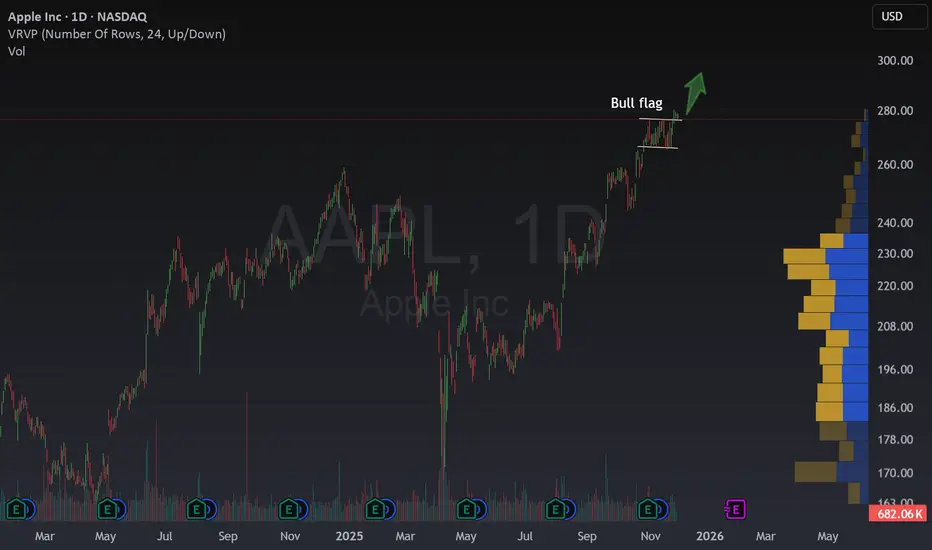
How To Trade a Bull Flag and The AAPL OpportunityHow To Trade a Bull Flag and The AAPL Opportunity
Have you ever felt stuck waiting for the perfect trade?
Apple just gave us a rare gift. After a strong rally, the price stopped and drew two parallel lines, each with two clear touches. This is what we call a bull flag. It looks simple, but it
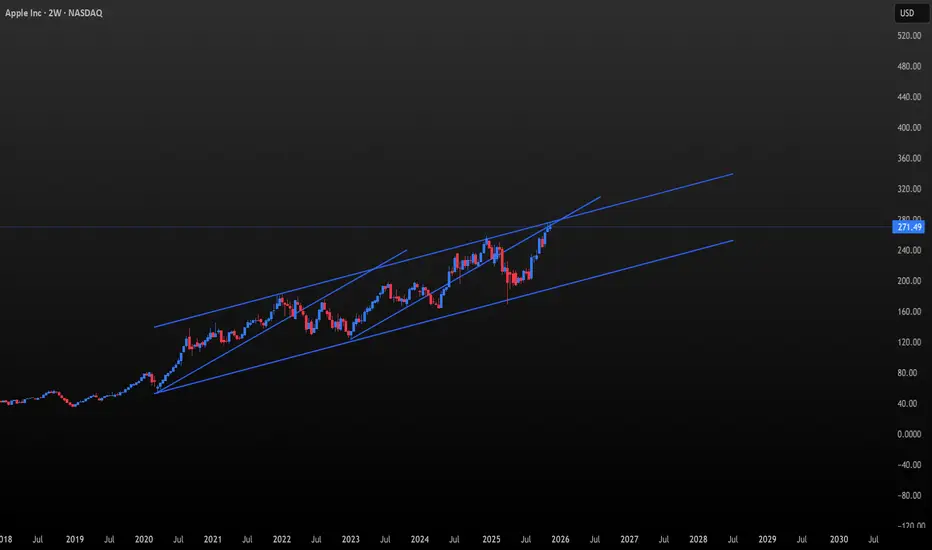
AAPL At a Critical Decision Zone! Breakout or Pullback Coming?Weekly timeframe
AAPL has been grinding steadily higher for months, forming a clean bullish structure with higher lows and higher highs. Buyers have full control on the weekly chart.
But now price is pushing directly into a long-term ascending trendline that has rejected multiple times in the past.
The Falling Apple: Apple’s Descent Into the 2026 Bear CycleApple has arrived at a rare point where Natural Law and fundamentals speak in unison.
The geometry of its long-term cycle and the internal condition of its business now deliver the same message: the arc that carried Apple through its 2020–2025 ascent has reached its structural boundary.
This is the
Apple - This stock will collapse!🥊Apple ( NASDAQ:AAPL ) is reversing right now:
🔎Analysis summary:
Starting back five years ago, Apple established a major rising channel pattern. Following this channel, Apple recently created a textbook +40% move higher. But with the current retest of resistance, we will certainly see anothe

AAPL SELLERS WILL DOMINATE THE MARKET|SHORT
AAPL SIGNAL
Trade Direction: short
Entry Level: 278.86
Target Level: 262.87
Stop Loss: 289.53
RISK PROFILE
Risk level: medium
Suggested risk: 1%
Timeframe: 6h
Disclosure: I am part of Trade Nation's Influencer program and receive a monthly fee for using their TradingView charts in my analysis.

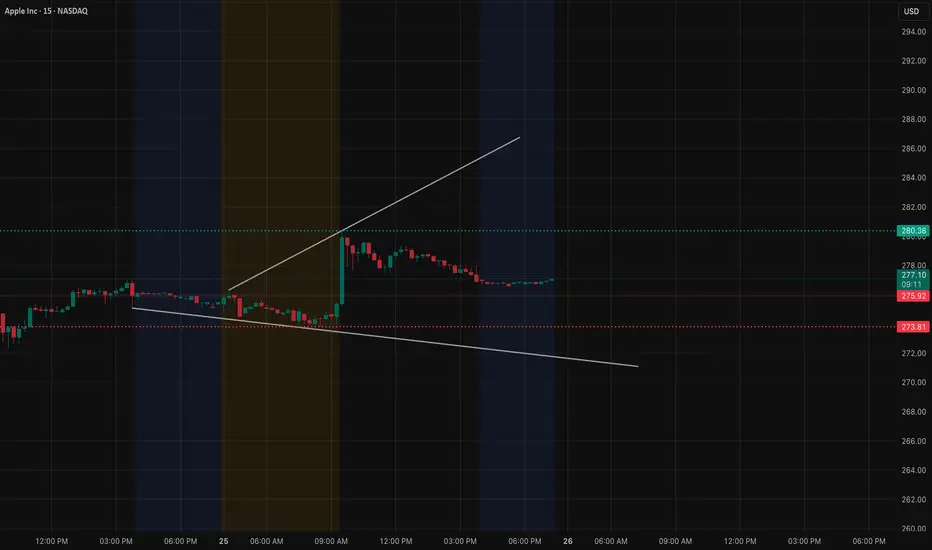
AAPL Pulled Back After the Morning Spike — TA for Nov 26AAPL Pulled Back After the Morning Spike — Here’s What I’m Watching for Nov 26
AAPL opened with a strong vertical move this morning, but after that first burst, the stock spent the rest of the day bleeding slowly back down into the mid-270s. You can see it clearly on the 15-minute chart — a sharp b
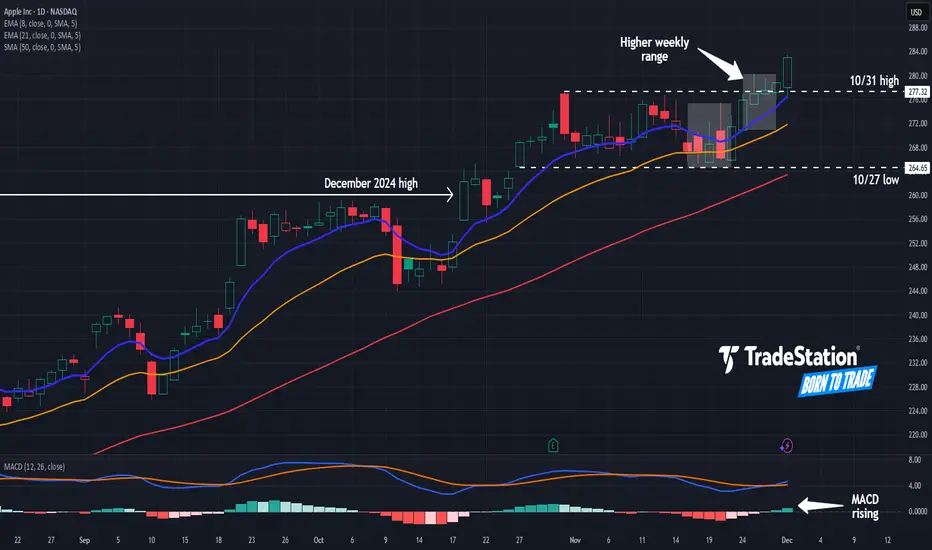
Apple May Be AcceleratingApple spent November quietly consolidating, and it may be accelerating in December.
The first pattern on today’s chart is the $260.10 level, a previous all-time high from December 2024. AAPL crossed above that price in late October and has remained there since, which could mean old resistance has b
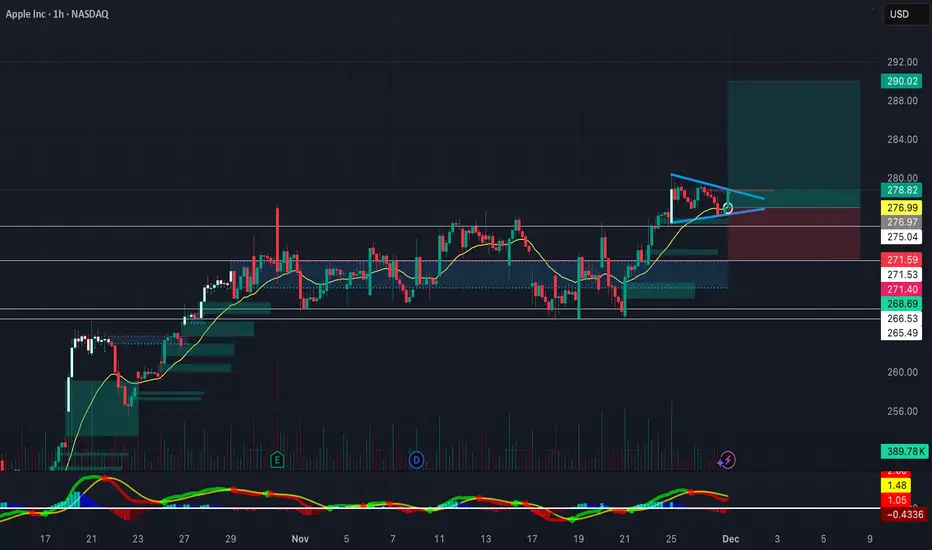
AAPL FlaggingNASDAQ:AAPL Flagging on the hourly, bouncing right off the 20-day EMA, expecting a push upwards to 280. If bulls can hold 280, looking for a move to the 286+ area. Watching this setup closely for a swing. Until then, some RSI-based supply and demand zones to keep an eye on, watching closely
APPLE The Target Is DOWN! SELL!
My dear subscribers,
This is my opinion on the APPLE next move:
The instrument tests an important psychological level 278.82
Bias - Bearish
Technical Indicators: Supper Trend gives a precise Bearish signal, while Pivot Point HL predicts price changes and potential reversals in the market.
Targ

See all ideas
Summarizing what the indicators are suggesting.
Oscillators
Neutral
SellBuy
Strong sellStrong buy
Strong sellSellNeutralBuyStrong buy
Oscillators
Neutral
SellBuy
Strong sellStrong buy
Strong sellSellNeutralBuyStrong buy
Summary
Neutral
SellBuy
Strong sellStrong buy
Strong sellSellNeutralBuyStrong buy
Summary
Neutral
SellBuy
Strong sellStrong buy
Strong sellSellNeutralBuyStrong buy
Summary
Neutral
SellBuy
Strong sellStrong buy
Strong sellSellNeutralBuyStrong buy
Moving Averages
Neutral
SellBuy
Strong sellStrong buy
Strong sellSellNeutralBuyStrong buy
Moving Averages
Neutral
SellBuy
Strong sellStrong buy
Strong sellSellNeutralBuyStrong buy
Displays a symbol's price movements over previous years to identify recurring trends.
US37833ER7
Apple Inc. 4.1% 08-AUG-2062Yield to maturity
5.38%
Maturity date
Aug 8, 2062
US37833DW7
Apple Inc. 2.65% 11-MAY-2050Yield to maturity
5.37%
Maturity date
May 11, 2050
US37833EG1
Apple Inc. 2.8% 08-FEB-2061Yield to maturity
5.37%
Maturity date
Feb 8, 2061
US37833DQ0
Apple Inc. 2.95% 11-SEP-2049Yield to maturity
5.36%
Maturity date
Sep 11, 2049
US37833EK2
Apple Inc. 2.7% 05-AUG-2051Yield to maturity
5.36%
Maturity date
Aug 5, 2051
US37833EL0
Apple Inc. 2.85% 05-AUG-2061Yield to maturity
5.35%
Maturity date
Aug 5, 2061
US37833EF3
Apple Inc. 2.65% 08-FEB-2051Yield to maturity
5.35%
Maturity date
Feb 8, 2051
APCL
Apple Inc. 3.6% 31-JUL-2042Yield to maturity
5.35%
Maturity date
Jul 31, 2042
US37833EQ9
Apple Inc. 3.95% 08-AUG-2052Yield to maturity
5.35%
Maturity date
Aug 8, 2052
US37833DD9
Apple Inc. 3.75% 12-SEP-2047Yield to maturity
5.35%
Maturity date
Sep 12, 2047
US37833CD0
Apple Inc. 3.85% 04-AUG-2046Yield to maturity
5.31%
Maturity date
Aug 4, 2046
See all AAPL bonds
Curated watchlists where AAPL is featured.


