$AAPLNASDAQ:AAPL you owe Me. Lets Get it. Big Bounce back candle is being ENGULFED by green buy candles, so 1.272, 1.414 & 1.618 are all target for this Light show.
Happy Trading, Alerts Set!
Apple Inc. Shs Cert Deposito Arg Repr 0.05 Shs
No trades
Market insights

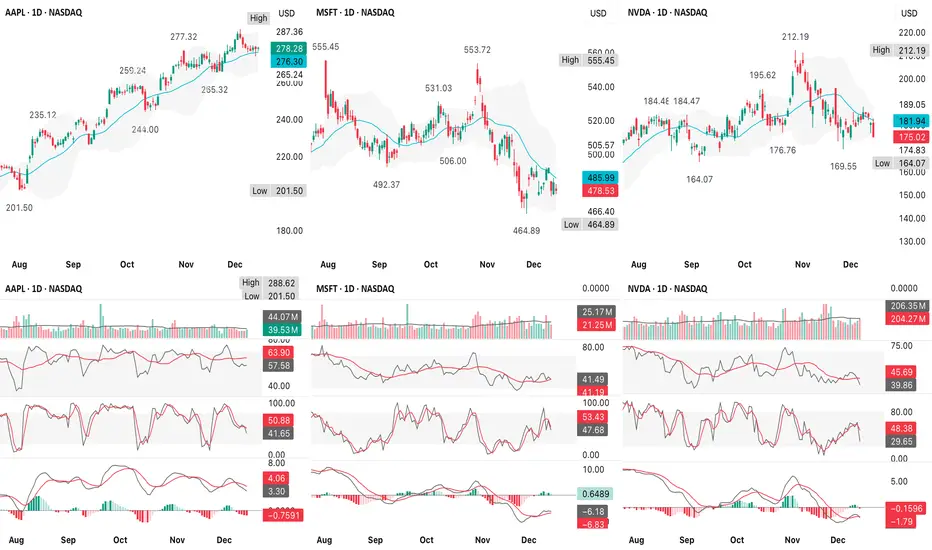
QQQ Santa Rotation?A look at the component charts lines up very cleanly with the broader QQQ direction into 2026
I am deliberately skeptical & weighting what usually leads, not what feels bullish/bearish emotionally
1. Clear leadership split or still acting well/potential leaders
AAPL
Above rising short-term MA, shallow pullback, no real momentum damage
RSI mid–upper range, MACD only mildly negative
This is not distribution behavior
GOOGL
Trend intact, pullback to rising MA, RSI still elevated
Looks like digestion, not a trend break
TSLA
Relative strength standout
Higher lows, bullish stochastic reset, MACD turning up
This is classic “risk appetite not gone” behavior
These names usually don’t hold up if a real index leg down is imminent
2. Neutral/repair mode
AMZN
Choppy range, sitting near mid-range support
Momentum soft, but not breaking down
META
Sharp correction already occurred
Now basing above recent lows; momentum trying to stabilize
Damage done, but selling pressure clearly slowing
These look more like already paid the price, not just starting to fall
3. Clear weak links
NVDA
Lower highs, weak bounce attempts, RSI sub-50
This is the most important chart psychologically
MSFT
Clean breakdown from November high
Momentum still negative, rallies sold
AVGO
Earnings gap down with volume
This is real distribution, not noise
NFLX
Continued downtrend, no strong reclaim yet
These are dragging QQQ, but note that most of this damage is already visible, not hidden
Breadth signals suggest that this is not a panic tape
Across almost all charts RSI mostly 40-55, not 30s, stochastics cycling, not pinned & MACD negative but flattening, not accelerating, so this is controlled rotation, not liquidation
If this were setting up a fast move to QQQ ~$590 immediately, you’d expect more RSIs < 35, more impulsive downside candles, & failed bounces across all mega-cap leaders
This implies for QQQ that the most probable path (highest odds) is a bounce first, then decision
Weak semis + MSFT = cap on upside
AAPL/GOOGL/TSLA = downside protection
That argues for a reflex rally (likely into $620-$625 area on QQQ)
Followed by stall/compression, not instant ATHs
Then a test of either higher low → Santa continuation or rollover to the $590s later
A lower-probability, but valid alternative is if NVDA loses its recent lows decisively & AAPL breaks its rising MA
Then the market probably hasn’t finished the reset
That’s when the $590s become much more likely
Right now, that confirmation is not present
Forget narratives - these are the objective tells
1. Does NVDA fail another bounce under its 20-50d MA?
If yes → drag continues
2. Does AAPL hold its rising MA on any dip?
If yes → index downside limited
3. Does TSLA continue to make higher lows?
Risk appetite intact if it does
4. Does AVGO stabilize instead of cascading?
Big for semis sentiment
If 2 of those 4 fail simultaneously, odds shift toward deeper downside
If 3 of 4 hold, Santa odds rise materially
This looks like a rotation-driven reset, not a market that’s done yet, but also not one about to collapse
A bounce into mid/late December is the statistically cleaner path from these charts
The real question is whether that bounce builds structure or fails quickly
Market wants to rally, but breadth is questionable & that regime typically resolves 1 of 2 ways
“Rotation Santa” (index grinds up even as laggards stay laggards)
“Breadth rug pull” (leaders finally roll & index drops fast)
If you get 3+ of these, odds tilt toward Santa succeeding even with semis weak & QQQ holds the prior swing low on the daily (no lower-low close)
AAPL/GOOGL remain above their rising short-term trend (20ish day look)
VIX is not making higher highs during down days (complacency returning)
Down days are smaller-range than the earlier selloff (volatility compression)
New lows list is not expanding while price chops (internal stabilization)
If instead you get QQQ makes a lower-low close, AAPL breaks trend & fails the reclaim within 1-2 sessions & semis keep making fresh lows, then the “bounce to ~$620-$625 fade” becomes the base case & $590s stays in play
You’re looking for structure + absorption, not fireworks into 23-27 December
Higher low(s) on the 1H/4H while daily holds support
Inside-day or breakout (tight range resolves up)
Closes near the high of day on at least 2 of those sessions
Up days on average/low volume is fine (holiday), but down days must be low volume too (no distribution)
Leadership breadth improves slightly & you don’t need semis to lead, you just need fewer new breakdowns
RSI on QQQ stabilizes above ~45-50 & slopes up
MACD histogram stops getting more negative (flattening is enough)
If you see that, the “Santa can start” signal is basically reset done = volatility compresses + leaders stop breaking + QQQ holds the low
23-27 December tells of what a failed Santa attempt looks like - this is the “looks fine… until it doesn’t” pattern
Gap up/early strength gets sold & closes mid-to-low range (2+ times)
Failure at a key reclaim level (prior breakdown level or VWAP zone) within 24-48 hours
One big trend day down that breaks the range (holiday weeks hate that & if it happens, it’s meaningful)
Semis continue to make new lows & it starts pulling down the “strong ones” (AAPL breaks trend, GOOGL loses MA, etc)
Breadth worsens while index is flat/up (classic divergence)
If that happens, the most common path is quick rejection from the bounce zone (~$620-$625 area), then a liquidation leg toward the next major support (~$590)
The 3 “reset is done” triggers that I actually use
QQQ higher low + reclaim of the prior day’s VWAP/anchored VWAP
AAPL doesn't lose its rising trend on a closing basis (or loses/reclaims within 1 day)
NVDA stops making lower lows (it can stay weak, but it just can’t keep accelerating down)
NASDAQ:QQQ NASDAQ:AAPL NASDAQ:AMZN NASDAQ:AVGO NASDAQ:GOOGL NASDAQ:META NASDAQ:MSFT NASDAQ:NFLX NASDAQ:NVDA NASDAQ:TSLA
Apple Rose 70% in Eight Months. What Its Chart Says NowApple NASDAQ:AAPL was the "Magnificent Seven" name that couldn't for more than half of 2025. Then the stock suddenly could -- rising some 70% from its $169.21 April low to a $288.62 record intraday high earlier this month. What do its chart and fundamentals say now?
Let's take a look:
Apple's Fundamental Analysis
AAPL fell 34.9% between its $260.10 December 2024 high and this year's April 8 low, then tried but ultimately failed to rebound. It peaked at $206.24 in June after a failed rally, still down 17.6% year to date.
But that was the point where Apple shares started to play catch up. They rose some 48% between their $195.21 June low and their $288.62 record high on Dec. 3.
There's been some recent profit taking since then, but can the stock's upward trend continue?
Well, famed Wedbush analyst Dan Ives (who's rated at five stars out of a possible five by TipRanks) last week reiterated the stock's "Buy" rating while increasing its price target to $350 from a previous $320. (Apple closed on Monday at $274.11, while AAPL analysts tracked by TipRanks give the stock a $298.60 average price target.)
Ives' team wrote in a research note that it boosted AAPL's target price "given our view that 2026 is going to finally be the year that Apple actually enters the AI Revolution."
"We also believe iPhone 17 sales have been trending well into year-end including in the China region as Apple continues to execute above-Street growth expectations for the December quarter, with a healthy holiday season ahead."
Ives isn't alone in his positive view. Although Apple's fiscal Q1 earnings aren't due until January's end, 20 of the 22 analysts who have revised their earnings forecasts have raised their numbers. (Two analysts lowered their projections.)
Apple's Technical Analysis
Now let's take a look at AAPL's chart going back some eight months and running through last Tuesday:
I've placed an Andrew's Pitchfork model over the AAPL chart going back to the stock's early April low.
Readers will easily see that Apple's price action from that point unto the present has almost entirely ranged between the model's central and lower trendlines.
In fact, the lower trendline is running almost congruent with the stock's 50-day Simple Moving Average (or "SMA," marked with a blue line above). That's where the professional money managers might try to play catch-up if they missed Apple's June-to-December upward move.
The swing crowd also appears to have been nibbling every time the stock tests its 21-day Exponential Moving Average (or "EMA," marked with a green line) from above.
Meanwhile, Apple's Relative Strength Index (the gray line at the chart's top) is off of its highs, but remains robust and is nowhere near being technically overbought.
However, there's some mild trouble potentially brewing -- although nothing overtly alarming just yet -- with Apple's Moving Average Convergence Divergence indicator (or "MACD," marked with black and gold lines and blue bars at the chart's bottom).
For instance, the histogram of the stock's 9-day EMA (the blue bars) is just slightly negative.
Similarly, the 12-day EMA (the black line) has just barely crossed below the 26-day EMA (gold line), but with both of those lines in positive territory. That could be a bearish signal.
An Options Option
Some options traders who are bullish have probably set up what's called a "debit-call spread" or "bull-call spread" based on the stock's current technical signals.
Those looking to reduce this trade's cost even more have likely also sold a discounted put in addition to the above spread.
All in, this strategy consists of a long call and a higher short call, along with a short out-of-the-money put (with all contracts having the same expiration).
Here's an example:
-- Long one call with a Jan. 9 expiration and a $280 strike price (i.e., a little out of the money). This cost $6.10 at recent prices.
-- Short one Jan. 9 call with a $300 strike (i.e., the stock's central trend line / rising-resistance level in the above chart) for $0.80 at recent levels.
-- Short one Jan. 9 put with a $265 strike (Apple's 50-day SMA) for about $1.95.
Net debit: $3.35 net debit.
This example results in a $3.35 outlay for a $16.65 theoretical maximum gain. However, selling a naked put like the one above exposes the investor to significant risk, as the stock could theoretically fall to zero.
If the stock is below $265 at expiration, the trader will end up long 100 Apple shares at a $268.35 net basis at a time when AAPL would be trading below $265.
(Moomoo Technologies Inc. Markets Commentator Stephen "Sarge" Guilfoyle had no position in AAPL at the time of writing this column.)
This article discusses technical analysis, other approaches, including fundamental analysis, may offer very different views. The examples provided are for illustrative purposes only and are not intended to be reflective of the results you can expect to achieve. Specific security charts used are for illustrative purposes only and are not a recommendation, offer to sell, or a solicitation of an offer to buy any security. Past investment performance does not indicate or guarantee future success. Returns will vary, and all investments carry risks, including loss of principal. This content is also not a research report and is not intended to serve as the basis for any investment decision. The information contained in this article does not purport to be a complete description of the securities, markets, or developments referred to in this material. Moomoo and its affiliates make no representation or warranty as to the article's adequacy, completeness, accuracy or timeliness for any particular purpose of the above content. Furthermore, there is no guarantee that any statements, estimates, price targets, opinions or forecasts provided herein will prove to be correct.
Options trading is risky and not appropriate for everyone. Read the Options Disclosure Document ( j.moomoo.com ) before trading. Options are complex and you may quickly lose the entire investment. Customers should consider their investment objectives and risks carefully before investing in options. Because of the importance of tax considerations to all options transactions, the customer considering options should consult their tax advisor as to how taxes affect the outcome of each options strategy. Supporting documents for any claims will be furnished upon request.
Options trading subject to eligibility requirements. Strategies available will depend on options level approved.
Maximum potential loss and profit for options are calculated based on the single leg or an entire multi-leg trade remaining intact until expiration with no option contracts being exercised or assigned. These figures do not account for a portion of a multi-leg strategy being changed or removed or the trader assuming a short or long position in the underlying stock at or before expiration. Therefore, it is possible to lose more than the theoretical max loss of a strategy.
The Analyst Ratings feature comes from TipRanks, an independent third party. The accuracy, completeness, or reliability cannot be guaranteed and should not be relied upon as a primary basis for any investment decision. The target prices are intended for informational purposes only, not recommendations, and are also not guarantees of future results.
Moomoo is a financial information and trading app offered by Moomoo Technologies Inc. In the U.S., investment products and services on Moomoo are offered by Moomoo Financial Inc., Member FINRA/SIPC.
TradingView is an independent third party not affiliated with Moomoo Financial Inc., Moomoo Technologies Inc., or its affiliates. Moomoo Financial Inc. and its affiliates do not endorse, represent or warrant the completeness and accuracy of the data and information available on the TradingView platform and are not responsible for any services provided by the third-party platform.

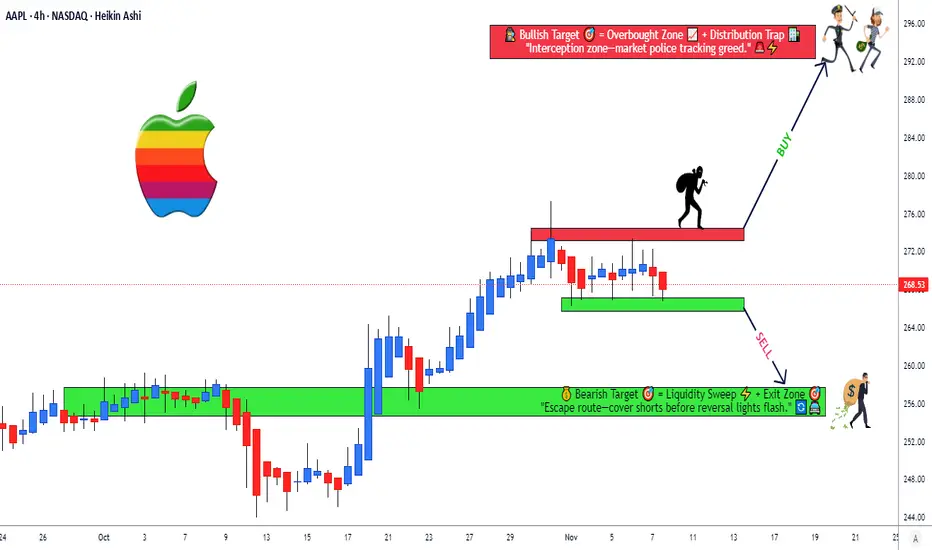
$AAPL Two-Way Plan: Sell Strength, Buy Structure🍎 ASSET OVERVIEW
Asset: NASDAQ:AAPL — Apple Inc.
Exchange: NASDAQ
Style: Swing Trade
Market Context: Extended price action near resistance with overbought signals, followed by potential mean reversion toward moving average structure.
🧠 MARKET PLAN (PROFESSIONAL + FUN VIBE)
📉 PHASE 1 — SHORT-TERM BEARISH BIAS
Price is currently overextended, sitting near a strong resistance zone with signs of buyer exhaustion.
Overbought conditions ⚠️
Resistance + liquidity trap potential
Expectation: Pullback toward the moving average
📈 PHASE 2 — STRUCTURED BULLISH PULLBACK
After the retracement, trend continuation is possible if price respects the dynamic moving average support near 267.00.
This is a two-scenario plan, not prediction — react, don’t predict.
🎯 EXECUTION LEVELS
🔴 Entry (Bearish Leg)
Sell: Current price zone (into resistance / overextension)
🟢 Buy Zone (Bullish Pullback)
Buy: Near Moving Average Support @ 267.00
🛑 RISK MANAGEMENT (ADJUSTABLE)
Bearish Stop Loss: @ 278.00
Bullish Stop Loss: @ 260.00
⚠️ Dear Ladies & Gentlemen (Thief OGs)
These stop levels are reference points only.
Risk management is personal — adjust position size and stops based on your own strategy and risk tolerance.
🎯 TARGETS
📉 Bearish Objective
Target: Near Dynamic Moving Average Support @ 267.00
📈 Bullish Continuation Objective
Target: 288.00
🚨 Strong resistance + prior overbought zone suggests partial profit booking is smart.
Market gives, market takes — protect gains.
⚠️ Dear Ladies & Gentlemen (Thief OGs)
These targets are not mandatory — manage profits at your discretion.
🔗 RELATED PAIRS & CORRELATED WATCHLIST
Keeping an eye on correlated instruments can confirm or invalidate this setup:
NASDAQ:NDX / PEPPERSTONE:NAS100 📊
Apple is a heavyweight — weakness or strength here directly impacts AAPL momentum.
SP:SPX / AMEX:SPY 🏦
Broad market risk sentiment helps confirm pullback sustainability.
NASDAQ:QQQ 🚀
Tech ETF correlation — divergence may signal early reversal or continuation.
NASDAQ:MSFT & NASDAQ:NVDA 🧠
Relative strength comparison within mega-cap tech.
🧩 KEY TAKEAWAYS
Trade the reaction, not emotions
Respect moving average dynamics
Scale wisely, protect capital
No single bias — adapt with structure
✨ “If you find value in my analysis, a 👍 and 🚀 boost is much appreciated — it helps me share more setups with the community!”
⚠️ DISCLAIMER
This is a thief-style trading strategy just for fun 🎭
Educational & entertainment purposes only — not financial advice.
Always do your own analysis and manage risk responsibly.
#AAPL #Apple #NASDAQ #SwingTrading #Pullback #MovingAverage
#PriceAction #MarketStructure #RiskManagement #TraderCommunity
#TechnicalAnalysis #Stocks #USMarkets #TradingView

Update and some thoughts on AAPLThe market is consolidating under support and getting ready for what I believe will be a larger move down. The vix is showing the opposite. AAPL may outperform to the downside.

$AAPL On the Move NASDAQ:AAPL Look just like the rest of them with the HARD rejection at -0.414 & -0.272. The Chart Explains it self for the Most Part. The Risk to Reward Ratio is Super Litty!. A whole lot to get and not too much to lose. Stay Discipline and yall will be just FINE.
Alerts Sets, Happy Trading!
TUESDAY is my Favorite day of the Week, Its random as hell.

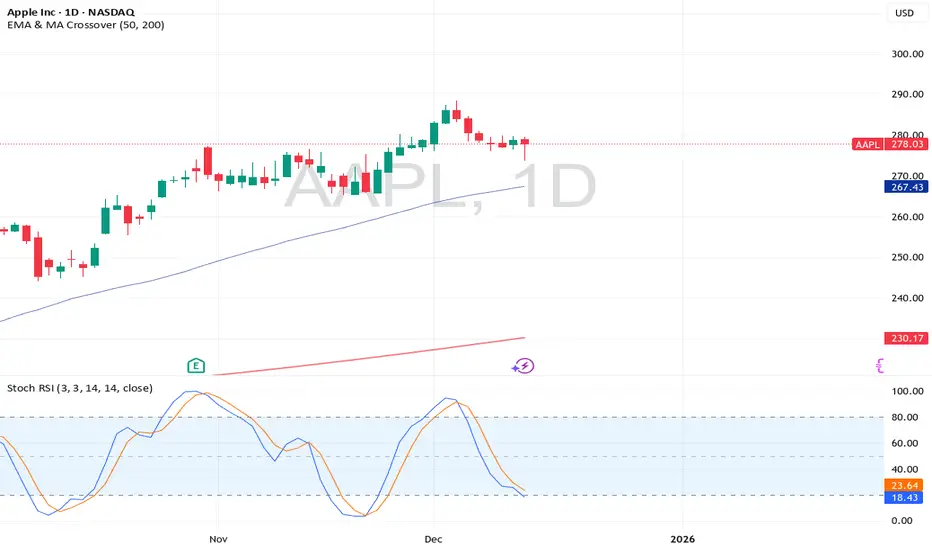
Apple_BuyApple stock is rising in 5 Elliott waves, which is currently in the 4th wave correction, which is a buying opportunity for investment
Buying number and range 240 to 250
Target 330 and with a growth percentage of 33%

Apple Inc. Enters a Bearish Phase: The Onset of a Market WinterTechnically, AAPL is at the end of its growth cycle and is about to start a downward movement. Nasdaq's chart and most other stocks also show us the same thing.

Apple Consolidates at Key Fibonacci Level: Is a Breakout Coming?Apple is sitting right under a big technical level: the 38.2% Fibonacci retracement around $279–280. This spot has been blocking price for days, and the stock keeps bouncing between this resistance and the support levels below.
Buyers have already defended the 50% ($276) and 61.8% ($273) Fib levels, which shows there’s still strength in the uptrend. But unless Apple finally pushes above $280 with conviction, it could swing back down to retest those support levels again.
In short: Apple is coiling up, and the breakout direction from here will tell us everything about the next move.

Short $AAPL, channel break = time for profit taking. Short NASDAQ:AAPL , channel break = time for profit taking.
At 37x P/E, valuation is rich.

Apple Inc. Swing Setup – Breakout or Breakdown Ahead?🍎 AAPL | Apple Inc. - Swing Trade Profit Blueprint 💰
NASDAQ: AAPL | Breakout Pattern Setup ⚡
Master the Swing Trade Game 🎯
📊 TECHNICAL OVERVIEW
Currently trading at $268.47 with strong momentum indicators aligning for a breakout scenario. Apple is positioned in a critical decision zone with defined technical levels offering professional risk/reward opportunities.
🎲 Market Structure: Tight consolidation phase with multiple confluences at key resistance and support zones.
📈 SWING TRADE SETUP - DUAL SCENARIO ANALYSIS
SCENARIO 1: BULLISH BREAKOUT 🚀
Entry Signal: Price breaks above resistance with volume confirmation
Entry Zone: Above $272.00 (Daily Close Confirmation)
Initial Target: $290.00 TP1 🎯
Extended Target: $295.00 TP2 (Ultimate Profit Zone) 🏆
Stop Loss: $264.00 (Risk Management Point) 🛑
SCENARIO 2: BEARISH BREAKDOWN 📉
Entry Signal: Price breaks below support with selling pressure
Entry Zone: Below $266.50 (Daily Close Confirmation)
Target 1: $262.00 TP1 🎯
Target 2: $256.00 TP2 (Profit Protection Zone) 🏆
Stop Loss: $276.00 (Risk Management Point) 🛑
🔍 KEY TECHNICAL FACTORS
✅ Momentum Alignment: Multiple timeframe convergence detected
✅ Volume Profile: Above average volume supporting breakout potential
✅ Support/Resistance: Well-defined levels from historical price action
✅ RSI Positioning: Neutral to strong momentum setup
✅ Moving Averages: Key dynamic support levels in play
🎯 SCENARIO CORRELATION PAIRS TO MONITOR
Primary Correlations:
🔗 NASDAQ:MSFT (Microsoft) - Tech sector strength indicator | Tech giants move together | Watch for divergence signals
🔗 NASDAQ:QQQ (Nasdaq-100 ETF) - Broader market direction | If QQQ breaks down, AAPL pressure increases | Use as macro confirmation
🔗 AMEX:VGT (Vanguard Info Tech ETF) - Sector sentiment gauge | Tech rotation plays | Confirms sector health
🔗 AMEX:IVV (iShares S&P 500 ETF) - S&P 500 correlation | Broad market support/resistance | Risk-on/risk-off indicator
🔗 AMEX:GLD (Gold) - Risk sentiment inverse correlation | Gold up = Risk-off = Tech pressure | Macro economic climate
📍 IMPORTANT REMINDERS FOR TRADERS
Your Entry Is Your Choice ✓ Only enter when YOUR checklist is complete
Your Stop Loss Is Your Decision ✓ Set it where YOU feel comfortable with risk
Your Take Profit Is Your Call ✓ Exit when your profit target is achieved or thesis breaks
Every trader's risk tolerance differs. These levels are technical reference points, not personal recommendations.
🎓 STRATEGY NOTES
✨ Best used on 1H-4H timeframes for swing trading
✨ Volume confirmation is CRITICAL before entries
✨ Wait for candle closes above/below levels - no wick trading
✨ Use this alongside your own technical analysis
✨ Market conditions can invalidate setups rapidly - stay flexible
✨ The breakout zone is where patience rewards traders
💡 CORRELATION SUMMARY
Green Lights ✅: When MSFT, QQQ, and VGT all confirm uptrend = Stronger AAPL bullish case
Yellow Caution ⚠️: When divergence appears between AAPL and QQQ = Possible reversal warning
Red Lights 🔴: When GLD spikes & IVV breaks support = Risk-off environment = Tech pressure incoming
✨ If you find value in my analysis, a 👍 and 🚀 boost is much appreciated — it helps me share more setups with the community!
AAPL CRACK!AAPL just flashed its first CRACK! of this structure.
AAPL has moved from the upper trendline to the bottom more through time than price.
In my BKC (Bare Knuckle Charting) read, the real tell isn’t the crack… It’s the miss. The previous high couldn’t even tag the upper trendline. That’s subtle, but it’s a big signal of weakening momentum.
Then came the CRACK! at the bottom, confirming it.
Lastly, we have a mini Head & Shoulders formed at the top.
APPL is growing revenues at a rate of 1–2% per quarter, while the stock has been growing at a rate of 5–6% per quarter. That extra 3–4% per quarter is pure multiple & narrative expansion — which is exactly why cracks in charts start to appear.
I urge CAUTION to Bulls!
THANK YOU for getting me to 5,000 followers! 🙏🔥
Let’s keep climbing.
If you enjoy the work:
👉 Drop a solid comment
Let’s push it to 6,000 and keep building a community grounded in truth, not hype.

The #1 Reason Apple is in A Buy Position Still...Apple is still very much a very good stock to
buy my entry was yesterday...And i
was very scared of this entry
Because i thought it will gap up.
This is what didn't happen. Even though
am humbled to witness that there is still
time to catch Apple.
This is because if you look below you will notice
that the momentum in the trade is yet
to reverse itself or crossover .
So this is an early entry
Thats why i got whipsawed..Even though
am still positive in the position
If my eyes where glued to the screen during the market
open i would have sold my position
out of fear.
This is why you have to trust your trading system
no matter what.
Maybe i trust my trading system to
the point that i don't have to look at
the screen for at-least 24 hours.
If you can position your mind
in the place where you
don't have to look at your screen
for at-least 24 hours then you know
that you have found a powerful
trading system.
So remember the point is that
on this price action we are waiting for a reversal
on the momentum
it hasn't yet happened so if you
enter now.You will be trading
a position
So expect to get whipsawed and
calculate you risk management accordingly.
Trade safe.
Rocket Boost this content
to learn more
Disclaimer: Trading is risky please learn risk management
and profit taking strategies.
Also feel free to use a simulation
trading account before you trade with real money
Apple to NVIDIAApple vs. NVIDIA Chart Analysis
Does anyone know something we don’t? This chart compares Apple to NVIDIA.
As you can see, Apple relative to NVIDIA has completed a clear five-wave structure within a descending channel.
Price has now reached the end of wave 5 at the bottom of its 11-year channel, showing a very sharp reaction along with strong divergences in both RSI and MACD on the monthly and weekly timeframes.
Based on this, price appears highly likely to rise, potentially reaching at least the channel’s upper boundary.
Potential Scenarios
This chart outlines four possible scenarios:
1.Both stocks rise, but Apple outperforms NVIDIA.
2.Both stocks decline, but Apple’s drop is more limited.
3.NVIDIA declines, but Apple rises.
4.NVIDIA consolidates, while Apple rises.
The trigger comes from RSI, which, considering the lower timeframe divergence on Chart B, provides reasonable reliability.
For additional confirmation, one can wait for a key line breakout.
Final Notes
This is my personal analysis. I’d be glad to hear your thoughts.
Follow me on TradingView to access more in-depth analyses and live stock trades.

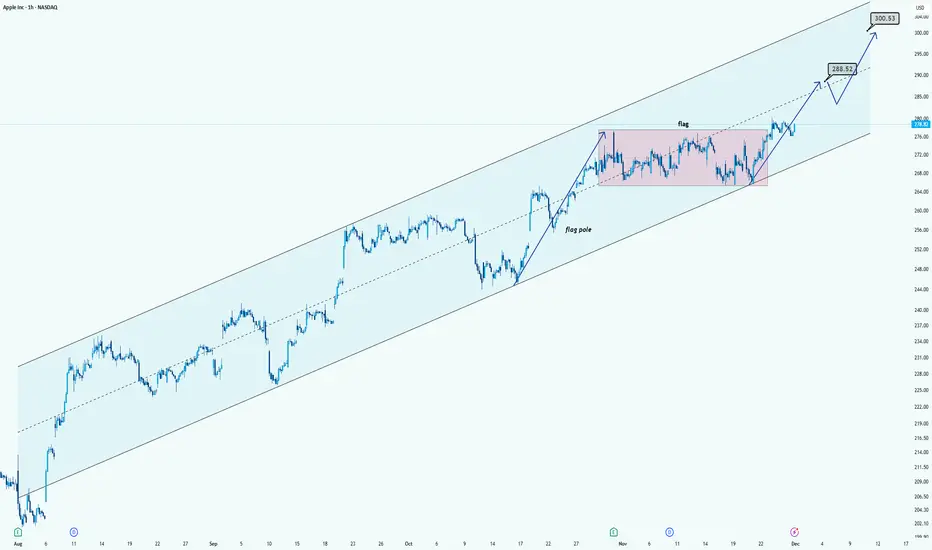
AAPL Chart AnalysisHi!
AAPL is trading inside a clean long-term ascending channel, showing a strong uptrend. Recently, the price formed a bullish flag (pink zone) after a sharp move up. The breakout above the flag signals continuation of the trend.
The chart projects two key upside levels:
$288.52 as the first target (flag breakout objective / mid-channel resistance)
$300.53 as the second target (upper channel boundary + psychological level)
As long as price stays above the flag range and respects the channel, the bullish structure remains intact.
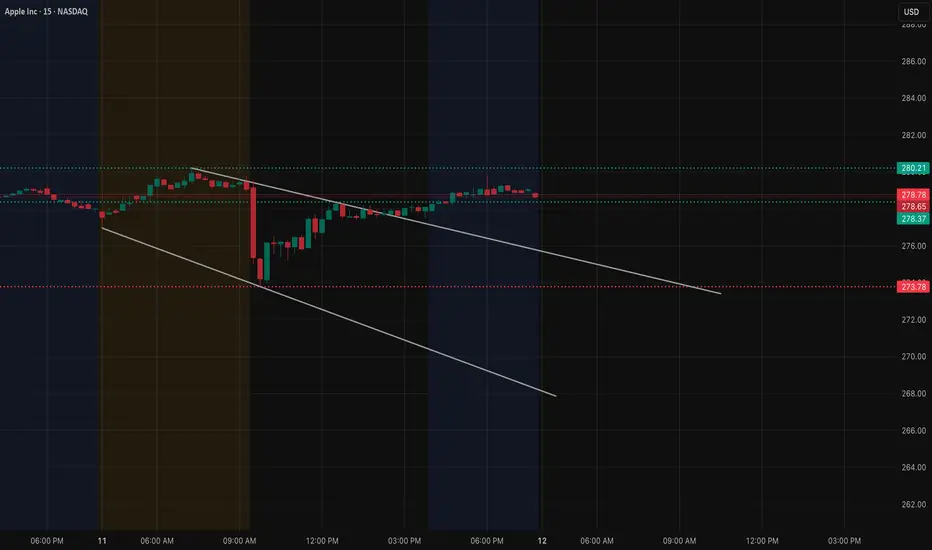
AAPL Dec 12. Testing Resistance Inside a Downward ChannelAAPL has been sliding inside a downward channel on the 15-minute timeframe ever since the sharp selloff earlier in the session. Price continues to respect the channel structure, making lower highs while holding the lower boundary as support. The most recent rally pushed AAPL back toward the mid-channel zone, but buyers have not yet shown the strength needed to break the descending trendline.
The 278.5–279 zone is the pivotal resistance. Each attempt to push above this area fades quickly, showing that sellers are defending it. Until AAPL can break this level and close above the upper channel boundary, the broader structure remains bearish.
On the downside, the lower boundary of the channel aligns with 273.5–274, which acted as the main support zone earlier in the day. If AAPL loses 276, momentum can pull price back toward this support. A breakdown below 273.5 would confirm continuation inside the descending channel.
The options landscape (GEX) aligns closely with these turning points.
The 280 level — just above the descending trendline — shows up as the strongest positive gamma resistance. When price approaches these higher gamma regions, dealer hedging tends to absorb volatility and slow the move. This explains why AAPL continues to struggle moving above the mid-channel zone and why every test into 279–280 has stalled.
Above that, the next major gamma concentrations appear around 282.5 and 285. For AAPL to reach these zones, it would need to break out of the channel structure, reclaim 279–280, and establish support. If that happens, hedging dynamics shift and upward volatility becomes more likely.
On the downside, negative gamma pockets sit around 275 and again at 273.5. These zones match the lower boundaries of the channel. If price falls below 276, dealer hedging can begin to amplify volatility instead of containing it, allowing AAPL to accelerate toward 275 and potentially 273.5.
When price structure and GEX positioning point to the same inflection points, the roadmap becomes clear:
• Holding below the descending trendline keeps the bearish structure in control
• Breaking and holding above 279–280 shifts momentum upward toward 282.5
• Dropping below 276 opens room for a retest of 275
• Losing 275 exposes the channel support around 273.5
AAPL has been coiling between resistance at the mid-channel and support near the lower boundary. Dec 12 will likely be decided by which side gives first.
This analysis is for educational purposes only and not financial advice.
AAPL – Dec 10 OutlookKey Levels Tighten as Price Compresses Inside a Falling Wedge
AAPL has been slowly compressing inside a clean falling wedge on both the 1H and 15M charts. Each bounce is getting weaker, but sellers haven’t fully broken the structure yet — they’re defending every lower-high while buyers continue holding that wedge support line. This usually doesn’t last long; wedges like this resolve with a sharp move once liquidity is taken from one side.
The 1H chart shows the wedge narrowing into a decision zone right under $278–280, which is also where the micro supply block sits. That area remains the line in the sand for bulls. If they can’t reclaim it, AAPL stays on the defensive.
On the 15M, BOS and CHoCH levels line up cleanly with where liquidity was swept earlier today. Price keeps reacting to that mid-zone demand but isn’t showing strength — more like it’s floating until a real catalyst shows up.
GEX levels confirm the idea:
$280 → Major Call Wall, heavy resistance where dealers hedge against upside breakouts.
Below, the $272–273 zone lines up with PUT support — if the wedge breaks down, that area becomes the magnet.
My view right now is simple: AAPL is coiling for its move. As long as the wedge support holds, you may still get an upside test toward $280. But if sellers crack $276 and push momentum down, the unwind toward $273 opens fast.
This is one of those setups where you just let price show its hand — no need to force anything in the middle of the wedge. Let liquidity get taken first.
Disclaimer:
This analysis is for educational purposes only and not financial advice. Trade your own plan and manage your risk.

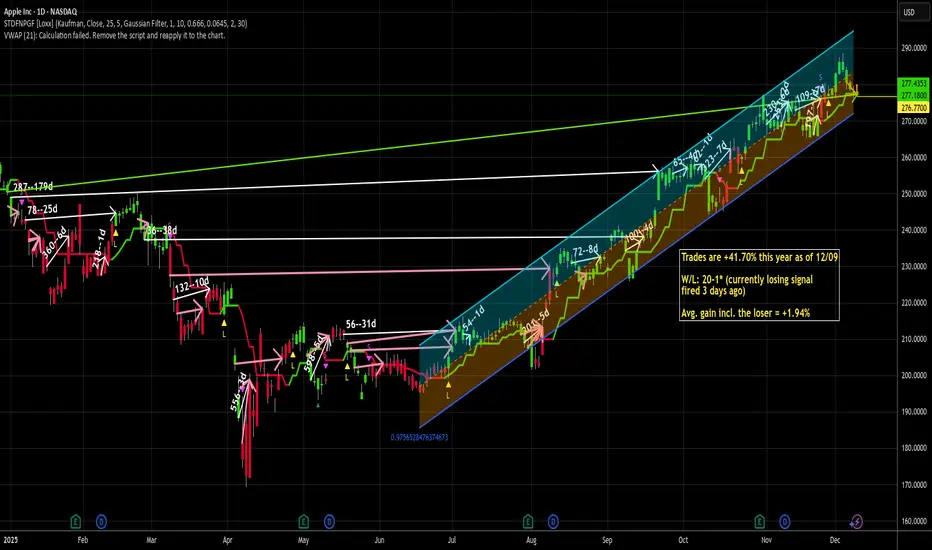
I like AAPL for uncertain times -- long at 276.77First and foremost, I like AAPL here because the system I use likes AAPL here. It actually liked it 3 days ago, but I decided to wait and I'm glad I did because I'm getting a better deal here. I jumped in just before the end of the after hours session today because I couldn't wait any longer. The Fed meeting is a wild card tomorrow, but if the market rallies on it, i'd miss out if I waited. If it dumps, it'll just take longer to make my money. That's a risk/reward that favored going long today for me. I understand, though, why some would want to wait.
Since the beginning of the year, the 20 closed trades have netted a total of +41% on a stock that is up under 11% on the year. They've produced a per lot/day return of around 12 basis points, which is 3x the long term average return of SPY.
While AAPL struggled early in the year, it has gotten its footing and since mid summer has been a freight train chugging higher and higher as shown by that pretty little regression channel. It is trading above its 20, 50 and 200d MAs as well.
An underrated feature of AAPL in my opinion (although @matthias would take the opposite position, I think) is that they have a huge pile of cash. They are holding over $100B in cash and marketable securities right now. While long term, I'd rather have that cash be used to innovate, I do not like the looks of the economy right now, and I think that AAPL's huge cash hoard gives them a cushion that a lot of other stocks don't have right now. I like that safety.
If Chairman Powell can manage to not rattle the markets tomorrow with hawkish rhetoric, and if Trump can keep his little fingers from typing out threats against Fed independence if Powell doesn't lower rates (doubtful), I think this could be a quick turnaround trade, as AAPL is already down 5 days in a row (though that's not terribly unusual for AAPL).
If the trade isn't a quick one, I am as always, not averse to adding to my position and tactically taking profits while waiting for the original lot to make its curtain call.
As always - this is intended as "edutainment" and my perspective on what I am or would be doing, not a recommendation for you to buy or sell. Act accordingly and invest at your own risk. DYOR and only make investments that make good financial sense for you in your current situation.
BTW - ignore the pink arrows on the chart, those are part of something I'm working on and it was too cumbersome to go hide them all. Also, the green arrow is simply for my use in determining YTD return of the stock quickly. Ignore that, too. Also, I mistyped in the text box on the chart and I can't fix that. The average return per trade is 1.98%, not 1.94%. Not a big difference, but I like to be accurate. Sorry for that error.
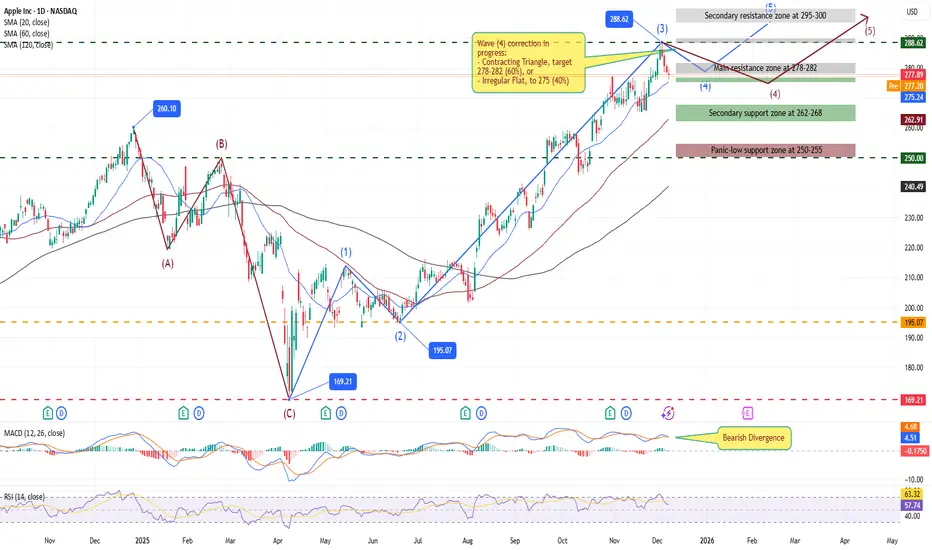
AAPL Elliott Wave Update: Wave 4 Triangle Nears Completion –$300AAPL Elliott Wave Update: Wave 4 Triangle Nears Completion – $300+ Wave 5 Targets Ahead
AAPL continues its bullish trajectory in a classic 5-wave impulse structure, originating from the April 2025 low of $169.21 following an ABC correction from late 2024 highs. This rally has delivered over 70% gains, confirming a higher-degree Wave ((5)) within the multi-year uptrend.
The impulse kicked off with Wave 1 surging to $213 (May high), followed by a shallow Wave 2 retracement to $195.07 (0.618 Fib), respecting the origin without overlap. Wave 3 then extended aggressively to $288.62 (December 3 high), measuring 1.618x Wave 1 and driving the strongest momentum since the blue-box low. Volume spiked during this extension, underscoring institutional buying.
We're now in Wave 4, a textbook sideways correction trading in the $276-282 range. Recent action suggests a Contracting Triangle (a-b-c-d-e pattern), with converging trendlines targeting a resolution near $277-282. Alternatively, an Irregular Flat could form if we probe $275 (0.382 Fib of Wave 3).
Bearish divergence on RSI (57.74) and MACD hints at waning momentum, but the 50-day SMA at $275.24 provides firm support. Critically, no overlap with Wave 1 high ($213) – a key invalidation level – keeps the structure intact.
Wave 5 targets align with Fib extensions: initial $290-293 (0.618 of Waves 1-3), standard $300-310 (1.0-1.618x). The parallel channel upper rail supports $305, fueled by AI tailwinds and upcoming Q1 earnings. Risk: Break below $270 channels a deeper pullback to $262, but VIX under 14 favors bulls.
Multi-month hold for longs above $275; add on triangle breakout with stops at $274. Structure remains bullish – Wave 5 could cap the year strong. What's your take?
Disclaimer: This analysis is for educational purposes only and is not investment advice. Please do your own research (DYOR) before making any trading decisions.
APPL Breakdown: BOS & CHoCH NASDAQ:AAPL On the H1 timeframe, the market structure has already produced a downside BOS, followed by a confirmed CHoCH. This clearly indicates that bullish momentum has ended and the market has shifted into a bearish trend.
Price has rejected from a bearish Order Block and FVG zone on the upside, highlighting strong institutional selling pressure. As long as price remains below this resistance, selling pressure is expected to remain active.
MACD also supports this analysis, with the MACD line below the signal line and the histogram in the negative zone, confirming momentum weakness and bearish continuation.
Bias:
As long as price stays below 274.00, sell continuation is expected.
Current Price / Sell: 270.78
Stop Loss: 274.00
Targets:
TP1: 265.50
TP2: 260.00
Disclaimer
This chart is for educational purposes only and does not constitute financial advice. Trading involves high risk; always conduct your own research and use proper risk management.

Long AAPLBullish trend, i think the stock is taking a brief breather before the next leg up. Volume is supporting price action in a positive manner, ichimoku is signaling strenght. Stop loss under recent support zone and below the 100 day EMA.

Apple Inc (AAPL) – 4H Uptrend Continuation with Ichimoku SupportThis 4-hour chart of Apple Inc (AAPL) shows a clear bullish trend continuation structure. Price is moving inside an ascending channel, respecting higher highs and higher lows, which confirms overall market strength.
The Ichimoku Cloud (9, 26, 52, 26) supports the bullish bias:
Price is trading above the cloud, indicating bullish momentum.
The cloud ahead is green, suggesting future trend support.
The Kijun-sen and Tenkan-sen are acting as dynamic support during pullbacks.
A well-defined support zone around 265–268 is highlighted, where price previously reacted and buyers stepped in. The chart anticipates a pullback into the support zone, followed by a bullish reversal, aligning with trend continuation logic.
The projected upside move targets Target 1 near 293.70, which aligns with prior resistance and the upper boundary of the rising channel.

Apple Inc. (AAPL) – TECH BUY TRADE SET-UP | NASDAQ | 21 DEC 2025Apple Inc. (AAPL) – TECH BUY TRADE SET-UP | NASDAQ | 21 DEC 2025 | By The Chart Alchemist
• Buy 1: 274 (current price)
• Buy 2: 272.25
• Buy 3: 270
Target Prices:
• TP1: 278 TP2: 280
• TP3: 288.5
SL (TF closing): Below 265.5 | R:R: 3.56
📢 Disclaimer: All trade signals are shared for informational purpose.
Do your own research before taking any position – No claim, No blame
