Adobe Inc.(ADBE) – Falling Wedge Breakout + Bullish Order BlockAdobe Inc. (ADBE) – Falling Wedge Breakout + Bullish Order Block
Timeframe: 4H
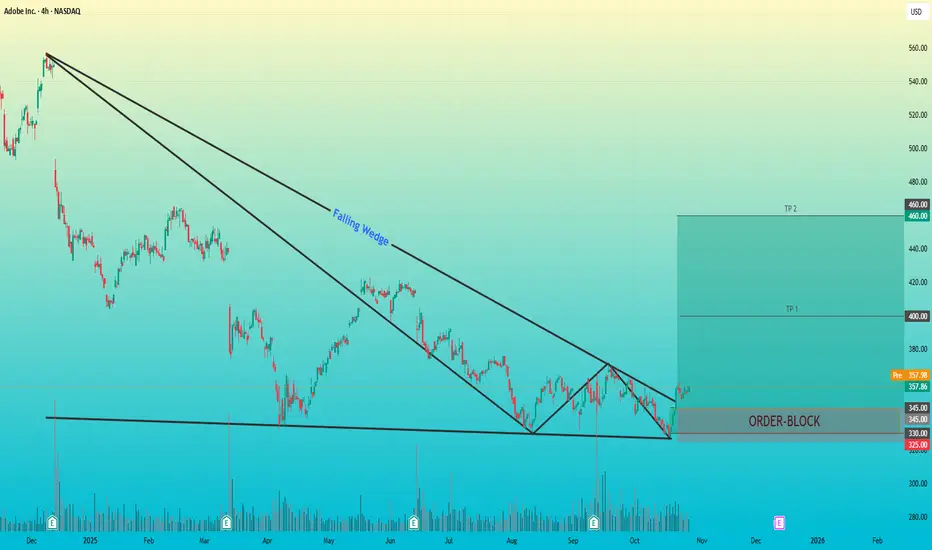
Pattern: Falling Wedge
Key Zone: Bullish Order Block (325 – 345 USD)
After an extended downtrend, Adobe formed a falling wedge pattern, signaling a potential bullish reversal.
Price recently broke the upper trendline wi
0.51 USD
4.87 B USD
18.84 B USD
About Adobe Inc.
Sector
Industry
CEO
Shantanu Narayen
Website
Headquarters
San Jose
Founded
1982
ISIN
ARBCOM460192
Adobe, Inc. is a global technology company, which engages in the provision of digital marketing and media solutions. It operates through the following segments: Digital Media, Digital Experience, and Publishing and Advertising. The Digital Media segment offers products and services that enable individuals, teams, businesses, and enterprises to create, publish, and promote content anywhere and accelerate productivity by transforming view, share, engage with and collaborate on documents and creative content. The Digital Experience segment focuses on integrated platform and set of products, services, and solutions that enable businesses to create, manage, execute, measure, monetize, and optimize customer experiences that span from analytics to commerce. The Publishing and Advertising segment includes legacy products and services that address diverse market opportunities, including eLearning solutions, technical document publishing, web conferencing, document and forms platform, web app development, high-end printing, and Adobe Advertising offerings. The company was founded by Charles M. Geschke and John E. Warnock in December 1982 and is headquartered in San Jose, CA.
Related stocks
adobe bulladobe is really looking bullish with all signs leading to a breakout .we have been skipping at the 330 levels and now is the time for a sizable breakout

Stock of the year 2026 - ADOBEAdobe seems to have completed a 4 year correction which started from Nov 2021. THe stock doesnt have momentum so don't expect immediate extraordinary returns but it will 3x in 3 years with hardly any downside.
The valuations are extremely good, and the chart setup on weekly is once in multi year op

$ADBE shying away from bullish bat?NASDAQ:ADBE has been on my watchlist for a while now waiting for price to drop to 316.
The pattern aligns almost perfectly with a Bullish Bat.
XA – Major impulsive rally (early 2023–late 2023)
AB – Retracement ≈ 0.56 XA → within the typical 0.382–0.618 zone
BC – Retraces ≈ 0.75 AB → again with

Adobe: Entering the Fourth Wave — Smart Money Distribution PhaseAdobe’s stock is entering a critical structural phase — the completion of its third global impulse and the start of the fourth corrective wave.
While the long-term uptrend remains intact, the price structure and fundamentals suggest that the most explosive growth period may already be behind us.
🧭

Adobe at major support - Target $603Adobe has been ranging for years to finally let the long term trend catch up. $603 is the target for and it will likely form support above there. Finally Adobe should break out of this range.
This is not a fast trade btw.
Good luck!

ADBE heading towards major Daily DemandADBE is showing us potencional mittigation of Major Daily Demand level (300- 275).
This level should be strong enough to give needed demand to push price towards weekly Supply levels.
Be careful of 11th Dec on E&R.
Let's talk about ADBE together

ADBE watch $356: Dual-Fibs that even the Fib-Blind see CLEARLY Adobe finally getting some love but likely ova.
Just hit a proven DoubleFib at $356.48/58
Looking for a Dip-to-Fib like $349 or $345.

ADBE Technical Analysis ADBE is currently holding at the long-term ascending channel support, and we can say it’s moving sideways between $330 and $360. It’s important to note that in previous tests of this ascending channel support, the price moved more rapidly; however, this time it seems to be taking a breather, indicat
$ADBE Bulls need $330 to holdIf ADBE cannot hold $330 which it has tested three times, and a fourth test is likely to fail, it is not promising technical signal for bulls.
See all ideas
Summarizing what the indicators are suggesting.
Oscillators
Neutral
SellBuy
Strong sellStrong buy
Strong sellSellNeutralBuyStrong buy
Oscillators
Neutral
SellBuy
Strong sellStrong buy
Strong sellSellNeutralBuyStrong buy
Summary
Neutral
SellBuy
Strong sellStrong buy
Strong sellSellNeutralBuyStrong buy
Summary
Neutral
SellBuy
Strong sellStrong buy
Strong sellSellNeutralBuyStrong buy
Summary
Neutral
SellBuy
Strong sellStrong buy
Strong sellSellNeutralBuyStrong buy
Moving Averages
Neutral
SellBuy
Strong sellStrong buy
Strong sellSellNeutralBuyStrong buy
Moving Averages
Neutral
SellBuy
Strong sellStrong buy
Strong sellSellNeutralBuyStrong buy
Displays a symbol's price movements over previous years to identify recurring trends.
ADBE5981558
Adobe Inc. 5.3% 17-JAN-2035Yield to maturity
4.52%
Maturity date
Jan 17, 2035
ADBE5784629
Adobe Inc. 4.95% 04-APR-2034Yield to maturity
4.48%
Maturity date
Apr 4, 2034
US724PAD1
Adobe Inc. 2.3% 01-FEB-2030Yield to maturity
4.05%
Maturity date
Feb 1, 2030
ADBE5981252
Adobe Inc. 4.95% 17-JAN-2030Yield to maturity
4.04%
Maturity date
Jan 17, 2030
ADBE5784440
Adobe Inc. 4.8% 04-APR-2029Yield to maturity
3.99%
Maturity date
Apr 4, 2029
US724PAC3
Adobe Inc. 2.15% 01-FEB-2027Yield to maturity
3.95%
Maturity date
Feb 1, 2027
ADBE5784439
Adobe Inc. 4.85% 04-APR-2027Yield to maturity
3.86%
Maturity date
Apr 4, 2027
ADBE5981557
Adobe Inc. 4.75% 17-JAN-2028Yield to maturity
3.84%
Maturity date
Jan 17, 2028
See all ADBED bonds
Curated watchlists where ADBED is featured.


