C3.ai, Inc. Shs Cert Deposito Arg Repr 0.2 Shs
No trades
Trade ideas


AI making bullish inverse H&SAI has completed left shoulder and head already and trading around the parallel support channel. If it is able to hold this level, I am hoping this to complete the right head and also give a breakout.
SL below parallel support channel


Inverse H&S Shoulder Pattern Based upon the volume profile, AI's stock has been in basing stage since March. An Inverse H&S has been forming since late March and the right shoulder is starting to form. According to standard technical analysis, it is only confirmed upon a break above the neckline however, the neckline is 13 points away.
I would much rather accumulate AI here considering if the pattern plays out my risk:reward is 1:5. Let me know what you think.
If you like this idea, be sure to hit the like button or follow me.

$AI wave 3 setupI said I wasn't going to take anymore plays, but this one is literally gold.
Haven't seen a setup this clean in months!
I believe that AI has finished Wave 2, and is about to start a Wave 3 impulse.
Wave 3 target = $124
Wave 5 target = unknown (don't wanna look too far into the future)

AI - Cup & Handle formed wellAI - Cup & handle formed with falling wedge , watch for break out of the wedge for long calls
Watch fib levels for target prices

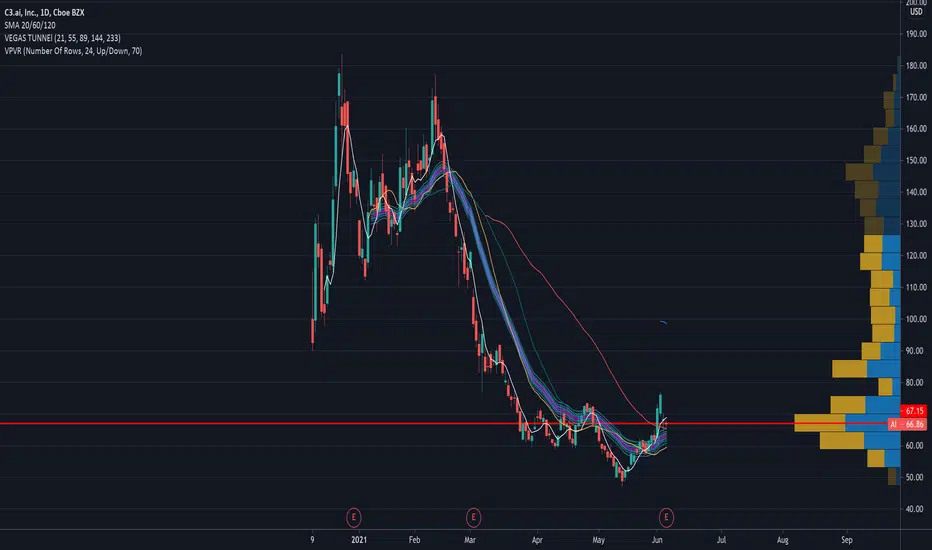
6/5 AI(1) AI has huge volumes within current range, while less above it
(2) if AI could consolidate good at current level, I believe there would be a strong run afterwards

AI Bullish Ascending TriangleAI looks to have formed an ascending triangle, it has also crossed through the 50 EMA (which can act as an area of support later), and has bullish MACD momentum as well on the daily chart.
Over the last month the stock has formed higher-lows, it looks to retest an area it failed to break, the $70 resistance level that has held for the past few months.
In order for this analysis to be valid the stock must break through the ascending triangle pattern and see a push upward.


I am holding AI until summer.Then I might have earned my losses back. I did not cut losses in time. But as you can see from my chart - I notice a divergence in volume and price action and I think we will see an upward move soon.


MarinatingTech getting cleaned up pretty good. This pattern caught my eye. This one has high volatility and good volume.

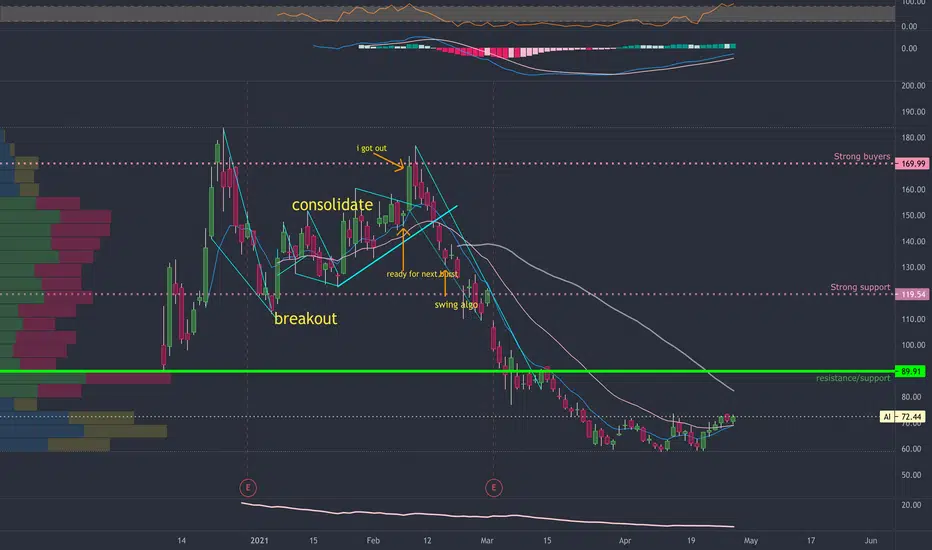
$AI - patience paysWhen the stock closes over $89.91 I will be long
The volume shelf supports its and the IPO psychology is playing out perfectly.
Could take a month or a year, either way, my alert is waiting.
new structureafter a major repricing & triple bottom...looks* like it's ready to resume bullish market participation. Barring more expiration lockups & new offerings, looking for this to regain the $100 share price by early June at the earliest


C3.ai with a perfect bottom!Just have a look at this beautiful bottom! I took a shot at C3.ai and used the bottom to invest.
