Trade ideas

Best AI stock for 2023 🤖 Recently, everyone is talking about AI.
So which companies to buy and is it worth it now?
At the moment, leader among commercial implementation of artificial intelligence is a non-public company OpenAi.
Microsoft ( NASDAQ:MSFT ) has made a big contribution to development of OpenAi - therefore its a direct beneficiary of spread of GPT chat.
📱 The rest of Big Tech shares: NVDIA, Tesla, Meta - also have a direct participation in development and popularization of AI.
That is, now AI is about the growth of Big Tech shares, which have already grown by + 50+70% since the beginning of this year!
It's a lot.
For example, Apple is generally ~4-5% of its historical maximum 😱
In context of incoming data, we see that conditions in world's economies are destroying, which means that IT sector will not be able to pull market for a long time and will go into correction. Sp500 will also go down accordingly.
And this means that the hype around AI will soon cool down ♨️
But, we would like to highlight one company that will be interesting in the medium term.
She is engaged in development and training of AI.
➖ Of the minuses, the company has no profit.
Strongly overbought by P/S ~12 (up 200% YtD).
➕ The company has no debt.
There is a very promising direction.
There is a revenue of $266 million.
Huge stock volumes starting in 2023 📊
The next report will be June 1st.
If the company makes a profit, there is a chance to grow by +50%, but then the stock will fall.
❇️ Ticker: NYSE:AI
✳️ Buy limit orders: $25, $20, $17
📈 Growth potential: up to 200% by the end of the year.
📉 Downside potential: up minus 50% by the end of summer.
Write in the comments on what other assets you want to get an analysis 🔎
If you are interested in receiving promising ideas on market, dont forget subscribe to channel! In profile you will find a lot of interesting things.

Time to see if the retracement is correctiveYellow full bull and wave 3 of 3 incoming.
Red count would represent lower lows.
For the moment, we are waiting for the clean ew structure

AI: Sell ideaSell idea on AI as you see on the chart because we have the breakout with force the vwap indicator and also the breakout of the support line by a big red candle with a large red volume.Thanks!

Flat correction in play.From what it seems, AI made a 3 wave move before dropping impulsively.
That drop doesnt look corrective so i expect following potential outcomes.
Leaning more to deeper correction. (Red pattern)
Flat corrections require 3/3 /5 patterns
It looks like
A (Flat)
B (Zig zag)
C (Impulse) (for the moment its only 1 of 5 waves.
My longs are safe with stop loss in profit. Waiting game for more resolution.

AI - worth a watchThis is a stock I've recently bought, based on the technical readings alone. Fundamentally it may not be worth a long term hold, but I do believe it's a good trade opportunity. As you can see we had a falling wedge and breakout on the weekly with weekly bullish divergence on the RSI. We are currently over the 18 on the week , so bias is up. However, we also just reached the weekly BB, so some resistance here is to be expected. If they can hold 12 dollars, this may get a bounce to at least 20 and if it really takes off, 34 and possibly 50. There's no volume but it does seem to be finishing a base here. I can't guarantee if this is an area to buy, but I do recommend this stock as a watch in 2023.

2023.6.1 Will the stock price of C3.ai weaken in three weeks?2023.6.1 Will the stock price of C3.ai weaken in three weeks?
This chart shows the weekly candle chart of C3. ai's stock from its listing at the end of 2020 until now. The graph overlays the lines between the highs and lows of the past two years, the lines between the lows and lows, and the horizontal line of the strongest pressure level closest to the current stock price! As shown in the figure, the stock price of C3.ai began to rise in early May 2023 and has been closing positive for 5 consecutive weeks. After breaking through multiple pressure levels, it showed a standard form of releasing momentum by jumping short and opening high this week! In the next three weeks, there is a high probability that the rise of C3.ai will come to an end, retreat from the starting position of bearish positions in early April of this year, and then choose a new direction to break through!

AI C3.ai Options Ahead of EarningsAnalyzing the options chain of AI prior to the earnings report this week,
I would consider purchasing the 35usd strike price Calls with
an expiration date of 2023-7-21,
for a premium of approximately $6.20.
If these options prove to be profitable prior to the earnings release, I would sell at least half of them.
Looking forward to read your opinion about it.

Another AI company popping up.....Please DYODD.
This company was a target of short seller,Kerrisdale Capital last month for alleged accounting and disclosure issues. While the recent revenue has beaten analysts estimates, one needs to dig deeper into its financial to establish if it is a worthwhile long term investment......
AI is the meme of 2023. This is $AI stock. SimpleWith only a 3 billion market cap this stock has potential to rocket from retail money. Love the ticker. This stock has already had a huge rally this year and I expect it to continue and become a new meme stock of sorts, fueled by hype for the AI sector. Target is 109, the price it reached on it's IPO day.

AI - Rising Trend Channel [MID TERM]🔹AI shows strong development within a rising trend channel in the medium long term.
🔹AI has broken a resistance level and given a positive signal for the long-term trading range.
🔹There is no resistance in the price chart and further rise is indicated.
🔹In case of a negative reaction, the stock has support at approximately 34.
🔹RSI is above 70 after a good price increase the past weeks.
🔹Overall assessed as technically positive for the medium long term.
Chart Pattern;
🔹DT - Double Top | BEARISH | 🔴
🔹DB - Double Bottom | BULLISH | 🟢
🔹HNS - Head & Shoulder | BEARISH | 🔴
🔹REC - Rectangle | 🔵
🔹iHNS - inverse head & Shoulder | BULLISH | 🟢
Verify it first and believe later.
WavePoint ❤️

$AI - Target 1 HitVery convenient, I know... NYSE:AI bullish during an AI hype. But one way or another, regardless of the recent popularity AI has garnered, the tone of the message I'd like to convey today is that the charts knew at least 2 months before the retail trading industry (and perhaps even some institutions) that this hype was a possibility.
There's never a sure thing in the markets. Never. No one holds a crystal ball, no matter how many Nobel Prizes they've won or how many lines they can draw on a chart. That's why risk management is the central piece in trading.
However, there's a point to be argued, a point which I'll always stand for: charts, supply & demand, technical analysis—they allow you to detach yourself from opinions, fundamentals, tips, and macroeconomic brainiac knowledge.
They enable you to quantify a market instance where the odds are in your favor, where you want to expose yourself to the possibility of something like what's happening with AI, happening and benefiting you greatly... all while ensuring your trading account remains alive if it does not happen.
This market serves as a good example. This 100% technical analysis-based trigger emerged 4 months ago, and yesterday Target 1 was hit.
Should you take partial profits and hedge against the possibility of a reversal? Or trail the confirmed uptrend? Let your risk aversion profile guide you.
Cheers,
Tenacious Tribe - Backtested, Quantified Trading Strategies

AI Gamma SqueezeBasic Fib Extension levels take AI towards 63. This can be achieved if/ when it breaks above 50 level (Last option strike series) Gamma Squeeze will take place. Remember GME?

$AI on fire! Will the AI bubble Burst?NYSE:AI been on fire and had a monster day today on big news don't expect these prices to last I would take profits.

AI - Can it complete 3 White Soldiers?AI formed a mid-term bottom with its last 3-month candle closure that engulfed 4 previous candles - a very strong statement. Currently it has the potential to form 3 white soldiers on this 3-month timeframe. If this does play out, the min target is 250/300. Anything can happen with the current candle that will close in 1 month, but the projections are on the chart and represent a replication of the last bullish engulfing candle. GLTA!

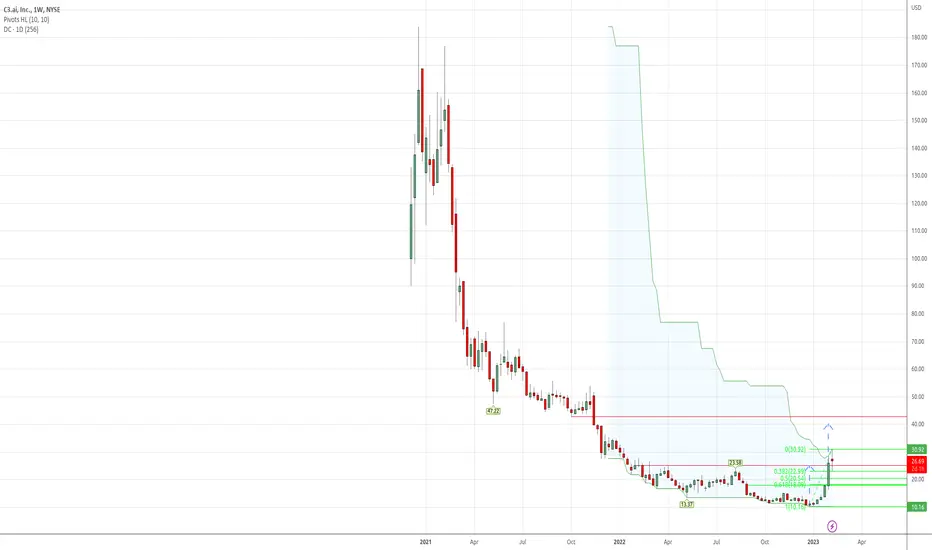
C3.ai Long here is some lines to bounce ofHere is some lines of resistance and support that we are bouncing around of.

AI, coming to lifeIf you find this info inspiring/helpful, please consider a boost and follow! Any questions or comments, please leave a comment! Also, check out the links in my signature to get to know me better!
In since $21.
Taking some off here and looking for a retrace to add.
At some previous consolidation now,
break this and $42 is the next congested area.
Hype can send this, hype has sent many things...that eventually came crashing down...
Cheers!

AI,10d+/-50.54%falling cycle -50.54% more than 10 days.
==================================================================================
This data is analyzed by robots. Analyze historical trends based on The Adam Theory of Markets (20 moving averages/60 moving averages/120 moving averages/240 moving averages) and estimate the trend in the next 10 days. The white line is the robot's expected price, and the upper and lower horizontal line stop loss and stop profit prices have no financial basis. The results are for reference only.

$AINYSE:AI
If overall, trend continues to be up in coming weeks.
Entry : Watching weekly pivot (WP), ANCHORED VWAP (black line @ 27's$), weekly support 1 (WR1).
Targets : White fib extensions, WR1 , WR2, WR3
35.42$ long trigger

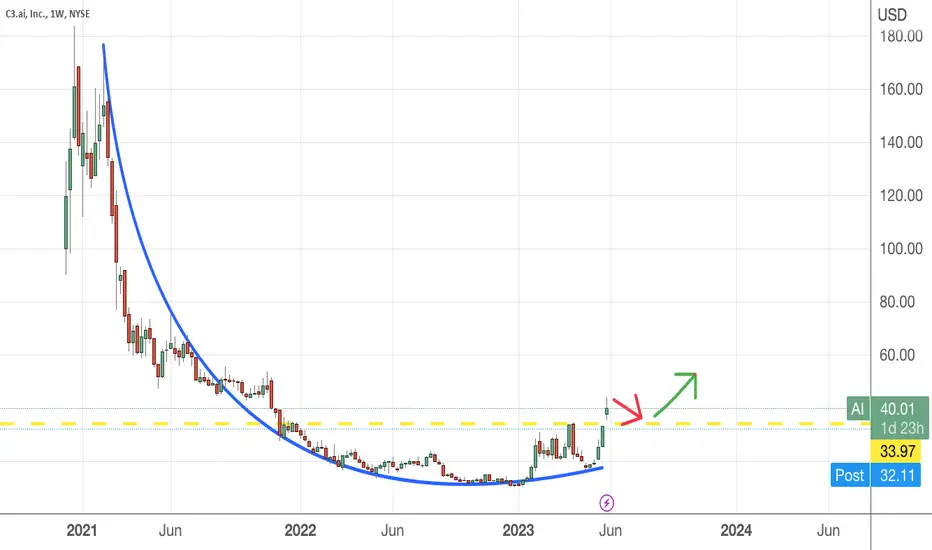
C3 Continue is bullish trend27th May 2023
Target remain at $42 IPO price.
Will continue to fly with current AI trend.
Even with short seller firm report/statement on C3.ai, it can't pressure down the price.
Hope Kerrisdale capital who short sell this stock got squeeze badly :)
Potential Bullish Run on the Back of AI Chip NewsIntroduction:
C3.ai, an enterprise AI software company, has recently been catching attention with a new low in its price action after reaching all-time highs. With the AI sector heating up and a historical precedent in Nvidia's ( NASDAQ:NVDA ) stock soaring after AI chip news, we might be in for an interesting ride with C3.ai ( NYSE:AI ).
Analysis:
1. Company Overview:
C3.ai provides SaaS applications for deploying large-scale AI applications, and its recent financial performance shows some growth in revenues but an increasing net loss. The company has a solid financial position with a high current ratio and no long-term debt.
2. Recent Performance & Financial Metrics:
Although the company's net loss increased by 53% to $203.9M, it still managed to increase its revenues by 8% to $194.4M for the nine months ended January 31, 2023. It is also notable that the company has strong gross margins at 70.5%, although the net profit margin is negative at -98.4%.
3. Potential NYSE:GME -like Bull Run:
The recent lows after reaching all-time highs provide an interesting set-up. Drawing parallels with Nvidia's stock surge after AI chip news, we could witness another bull run in $AI. These instances are rare but can provide significant returns if correctly timed.
4. Trading Strategy:
Here is a potential trading plan:
Entry Point: Current Price at $27.85
Stop Loss: $25.00
First Take Profit Level: $36.00
For those interested in options trading, it's worth noting that the contracts are still relatively cheap.
Conclusion:
While C3.ai has been under some financial pressure, its involvement in the growing AI sector could lead to significant future upside. Given the historical context of Nvidia's stock performance after AI chip news, it's worthwhile to keep a close eye on $AI. Remember, these trading plans carry risk, and it's essential to manage your risk correctly.
Note: This analysis is for informational purposes only and does not constitute investment advice. Always conduct your own research and consult a professional advisor before making investment decisions.

New HighWe'd got a new weekly high and have retraced 38 % whereafter new strength has emerged. As we had a rounding bottom since August there may be good space ahead for a rise.
Long Run. Life is a marathonLooks like the bottom is in. 80% sure that the bottom is in.
Impulsive looking structure of the lows.
Bear algo is still not beaten in linear scale.
Will wait a bit longer to see if the impulse is done.
Further Elliott wave and market geometry are explained in details on the video that i published.
Have a lovely day <3
