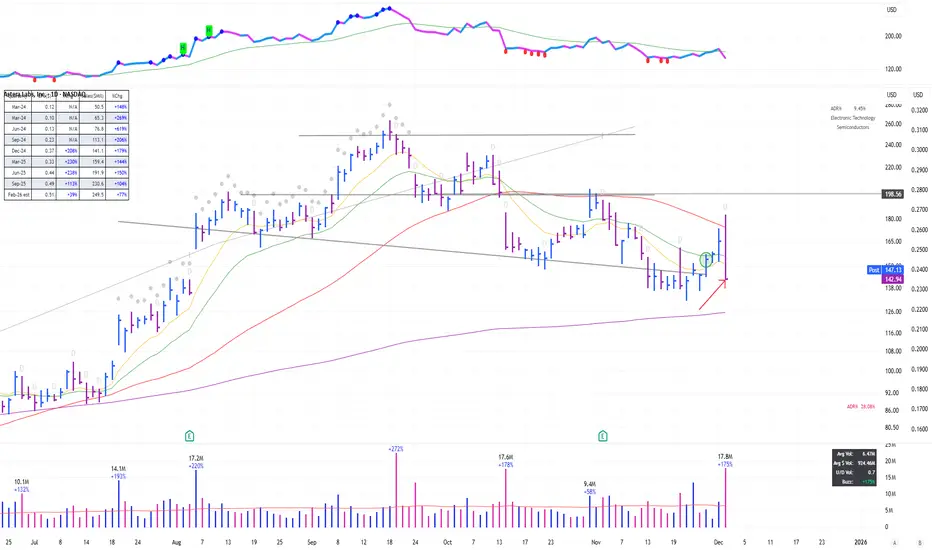
Trading Journal $ALAB Bought as it was showing relative strength while the market was coming off its lows. However, the 20% reversal from the high on heavy volume suggests it’s likely to find some support around the 200 MA now...
Trade ideas
$ALAB just tapped the Golden 618 fibALAB heavily into AI reported very strong earnings and is down $130 and just tapped the 618 golden Fibonacci level support

Strong Momentum With balanced ReturnsIt shows a more Robust BTST setup which cleaner breakout, confirmations across technical indicators Astera Labs,Inc is a promising candidate for BTST / INTRADAY

ALAB: more downside potentialAs long as the price remains below the 181 local resistance and 205 mid-term resistance, I’m watching for a continuation of downside momentum, with a potential re-test of the February breakout area around 115 and the broader macro support near 100.
Chart:
Previously:
• On macro bottoming (May 1): see the chart inside
www.tradingview.com
• On upside potential (Jun 24):
www.tradingview.com
• On resistance zone and potential extension (Jul 21):
www.tradingview.com
• On potential resistance (Aug 5) — the zone price broke through, invalidating the prior pullback hypothesis:
www.tradingview.com

$ALAB | Macro Tailwind Meets Technical Precision NASDAQ:ALAB | Macro Tailwind Meets Technical Precision ⚙️📈
AI infrastructure is still in expansion mode — hyperscalers are throwing billions at data-center connectivity, and Astera Labs ( NASDAQ:ALAB ) sits right at the center of that storm. The stock just bounced cleanly from the 0.5–0.618 retracement ($148–$176) and looks ready to re-enter its growth trajectory.
Macro Edge
AI CapEx wave → sustained server/rack demand
PCIe 6 & smart-fabric connectivity = new bottleneck solution
U.S. fiscal/tech incentives still pouring into semiconductor infrastructure
Catalysts
🚀 PCIe 6 portfolio ramp-up + “Scorpio” switch rollout in 2026
💰 Earnings/guidance beats driving analyst upgrades
🧠 Institutional flows building as AI-connectivity theme matures
Targets (Fibonacci Expansion)
1.382 → $349.81
1.618 → $402.99
2.0 → $491.62
VolanX DSS flags ~70% breakout probability over the next quarter if momentum sustains above $200.
⚙️ WaverVanir | VolanX DSS – Adaptive AI Market Intelligence
Not financial advice.

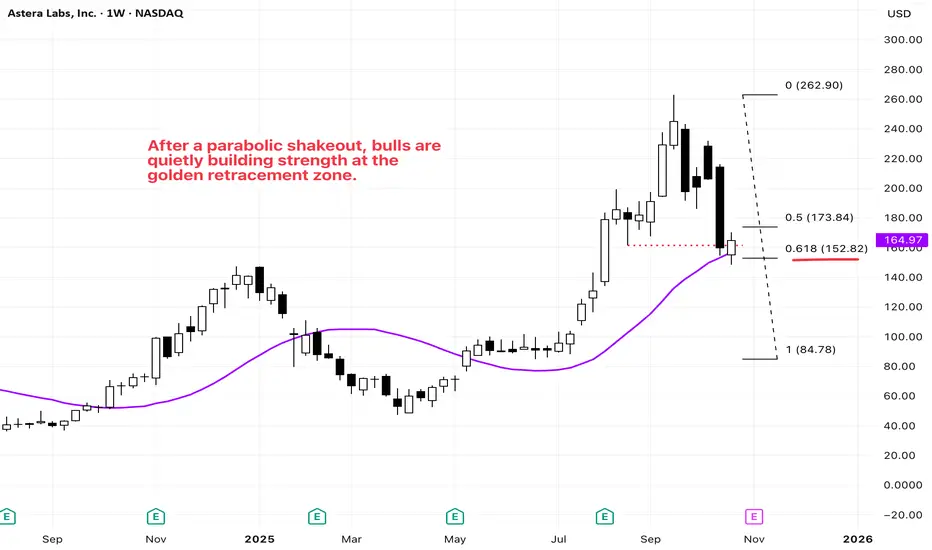
NASDAQ: ALAB — Holding the Golden Zone After a Parabolic DropALAB shows a structure similar to RDDT(see my previous idea) — a newly listed growth stock that gained strong momentum after breaking above its weekly SMA 20 in mid-May.
After reaching an all-time high, the stock started to pull back in late September.
Recently, a sharp parabolic drop drove the price down toward a confluence of supports:
* the previous swing low around $160(red dotted line),
* the weekly SMA 20 (purple),
* and the Fibonacci 0.618 retracement level of the recent rally.
This week’s candle closed bullishly, reclaiming the $160 area and confirming strong demand at this golden zone. The sharp sell-off likely flushed out retail stop orders, providing the base for a potential next leg up.
Overall, this area offers an attractive risk-to-reward setup, with technical supports aligning across multiple timeframes.
ALAB Looking for price to sell off into the Equal lows at 160$ and potentially fill the gap from 145ish to 160$ range. Looking for a break of structure or typical liquidity grab with bullish intent to re-enter longs to 260.

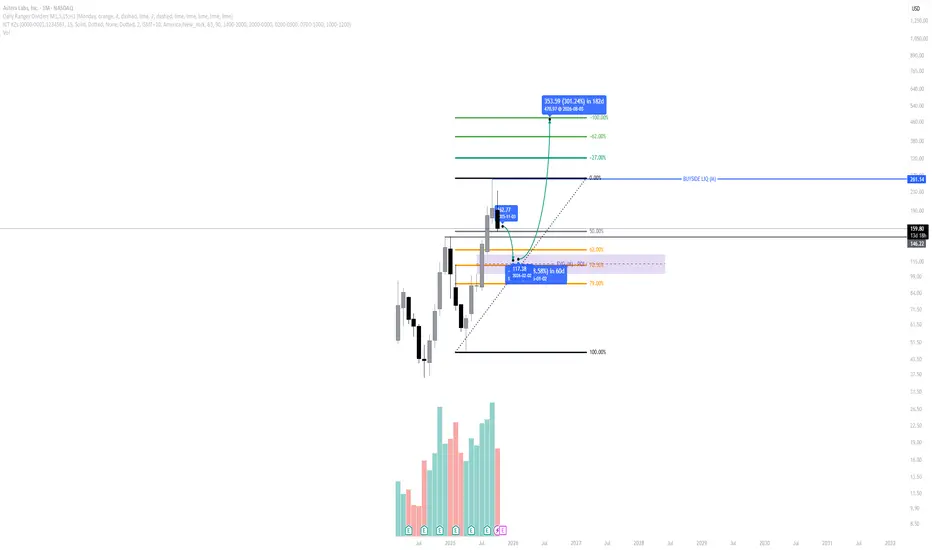
ALAB Cooling Down Before the Next AI Breakout? FVG Entry LoadingAstera Labs (NASDAQ: ALAB) is showing a clean higher-timeframe structure, consistently forming higher highs and higher lows, confirming a bullish long-term trend. However, the recent monthly candle shows potential for a short-term retracement, aligning with ICT principles for a re-entry opportunity.
Market Structure:
Price continues to respect its bullish framework, printing clear higher highs each impulse and leaving behind well-defined fair value gaps (FVGs) on the monthly chart.
The most recent swing suggests a possible retracement phase as the market seeks balance before another expansion leg.
Premium / Discount Context (OTE Zone):
Using the Fibonacci retracement from the last impulse, the Optimal Trade Entry (OTE) range sits between $122–$99, overlapping with the monthly FVG. This zone aligns perfectly with the 62–79% retracement region — the ideal “smart money” buy zone.
Liquidity Draw:
The buyside liquidity sits around $261, serving as the next major target. If the discount zone holds, the price could deliver a measured move toward $153 first, then a potential continuation toward $352 (long-term projection).
Volume Profile:
Increasing volume throughout prior impulses supports accumulation — indicating strong institutional participation on each retracement leg.
🎯 Outlook
Expect further downside into the FVG/OTE range ($122–$99) before a potential bullish reversal toward the $153–$261 liquidity levels.
If momentum confirms in this range, it could represent one of the best high-probability re-entry zones for 2025.
AS ALWAYS DYOR!
$ALAB – Impulse Complete or Just a Deep Wave-4?After a massive 5-wave run from $47 → $262 , Astera Labs (ALAB) is showing the first real signs of exhaustion.
The key question now: is this a larger ABC correction , or just a Wave-4 pause before a final push higher?
Structure
Price turned lower after rejecting the upper channel resistance.
The decline looks impulsive , with expanding volume — more typical of a Wave-A than a shallow pullback.
Momentum
RSI collapsed to around 34 , showing strong downside momentum. Wave-4 corrections usually stall near 40–45, so this leans bearish.
MACD turned negative and diverging — consistent with the start of a broader correction.
Key Levels
$175–$185 → Resistance area for a potential Wave-B bounce
$135–$140 → 0.382 Fib – first meaningful support
$111 → 0.5 Fib – midpoint target for Wave-C
$90 → 0.618 Fib – ideal capitulation zone and long-term buy area
Scenarios
🟢 Bullish (40%) – Wave-4 before Wave-5
Consolidation above $135 and RSI basing near 35–40 could trigger a rebound.
Confirmation comes on a break and close above $185 → potential Wave-5 rally toward $320–$350 .
🔴 Bearish (60%) – Larger ABC correction
Failure to hold $135 → next leg down toward $110–$90 (Wave-C) .
Would reset the structure before a new long-term impulse begins.
Summary
Momentum and structure currently favor a larger ABC correction rather than a shallow Wave-4.
Expect a short-term bounce (Wave-B), followed by a potential retest of the $110–$90 zone later this cycle.
A new bullish phase likely begins once RSI forms bullish divergence and price starts reclaiming higher highs.
Outlook
Short-term: bearish pressure / corrective phase
Medium-term: base expected Q1–Q2 2026
Long-term: bullish continuation once correction completes
What’s your take: early stages of Wave-C, or will buyers defend the 0.382?

The best trade is the one where you can’t lose anymore.ALAB is up +122%. 🚀
Most traders would still be asking: Do I hold? Do I sell?
But here’s the beauty of risk management: once a position doubles, you don’t have to play that game anymore.
I pull out my original capital.
What’s left running is pure profit.
Risk = zero.
Upside = unlimited.
From this moment forward, the market is paying me to hold.
Even if ALAB crashes to zero tomorrow, I’ve already won.
This is how you transform trades from stressful bets into risk-free holds.
Not by predicting the future… but by structuring the trade so the downside disappears.
That’s how you play this game for the long run.
What would you do?
👉 Hold 100% indefinitely?
👉 Bank 100% and walk away?
Drop your choice in the comments — I want to see how you think.
👉 Follow for more setups & insights into trading with precision, not prediction.

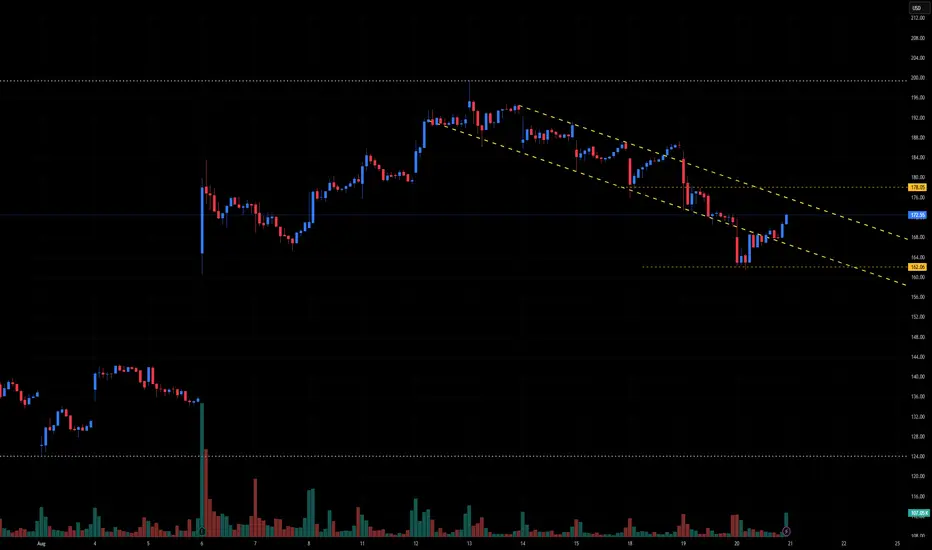
ALAB Technical Outlook – Descending Channel in Play📉 ALAB Technical Outlook – Descending Channel in Play
Ticker: ALAB
Timeframe: (30m candles shown)
🔍 Current Setup
ALAB is trading inside a falling channel (downtrend channel) marked by parallel descending resistance and support lines. Price has recently bounced from the lower boundary near 164–166, but remains capped by overhead resistance at the channel top near 178.
This setup suggests traders are watching for either:
A channel breakout to the upside (bullish reversal).
A continuation of the downtrend if resistance holds.
📊 Breakout Levels
🚀 Upside (Bullish Scenario)
Trigger: Close above 178.00–179.00 (channel resistance).
Intermediate Targets:
184.00–185.00 → Prior reaction high
192.00 → Channel midpoint supply
Measured Move Target: ~197–200 (equal to channel height projection).
🔻 Downside (Bearish Scenario)
Trigger: Close below 164.00–162.00 (channel support).
Intermediate Supports:
156.00 → Previous pivot zone
150.00 → Round number support
Measured Move Target: ~145 (channel height projection).
📈 Volume Analysis
Note the surge in volume on the most recent bounce off support.
Rising volume at channel edges often precedes breakouts. If this buying strength continues, bulls may attempt to reclaim 178+ for a trend reversal.
⚖️ Probability Bias
Bears remain in control while price trades inside the descending channel.
However, the volume spike off support suggests bulls are testing momentum.
A breakout above 178 could mark a trend reversal, but failure there would likely result in another leg lower toward 162.
✅ Takeaway
The battle is clear:
Bullish Break > 178: Targets 184 → 192 → 197–200
Bearish Break < 164–162: Targets 156 → 150 → 145
Until then, expect continued channel trading with resistance near 178 and support near 164.
ALAB $304 After Consolidation Around $180 Resistance/SupportALAB had a big rise today into $180 resistance. This should be an area where a small pullback occurs or a further rise and then pullback into what will be $180 support. (Personally I'm leaning towards pullback above $180 rather than below)
Keep an eye on the major trendline as if ALAB gets too far away it will eventually want back to that trendline.
$304 is the next target. All Information Technology / Computer stocks are in the middle of the a big uptrend so this one has room to run.

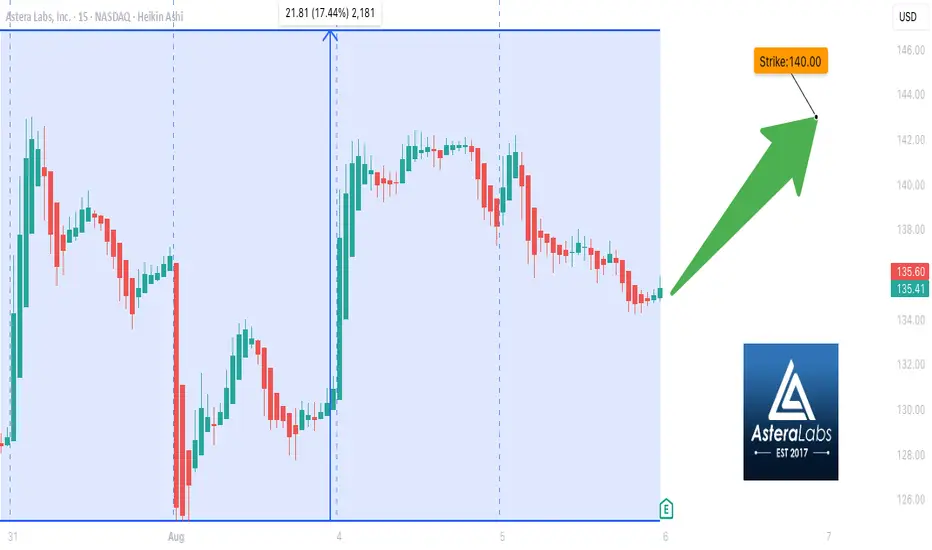
ALAB Earnings Play: High-Conviction Call Option Setup!
## 🚀 ALAB Earnings Play: High-Conviction Call Option Setup!
**Astera Labs (ALAB)** reports **Friday BMO (Aug 8)** – eyes on breakout potential.
---
### ⚡️ Bullish Thesis:
* 📈 **TTM Revenue Growth:** +144.3%
* 💰 **Gross Margin:** 75.8%
* 🧠 **AI + Cloud Tailwinds** fueling semiconductor strength
* 💥 **Beat Rate:** 5/5 last quarters | Avg surprise: +137.5%
* 📊 **Bullish Options Flow:** Heavy call interest @ \$140 & \$145
* 🔥 **Momentum:** Trading near ATH, outperforming sector
---
### 📉 Weak Spots to Watch:
* ⚠️ EPS Growth expected to dip -12.2%
* ⚖️ Negative EBITDA margin (-3.7%) suggests cost pressure
* 📉 Light volume into earnings could slow post-report follow-through
---
### 💡 Trade Idea:
**🎯 ALAB \$140 CALL**
* 💵 Entry Price: \$7.00
* 📆 Expiry: Aug 8, 2025
* 🎯 Profit Target: \$21.00 (200%)
* 🛑 Stop Loss: \$3.50
* 🕒 Entry: Pre-earnings close (Aug 7)
---
### 🔍 Risk-Reward Snapshot:
* ✅ Favorable macro + sector context
* ✅ 3:1+ reward ratio
* 🚨 Watch \$134.00 support zone
* ⏱ Exit within 2 hours post-earnings if no move
---
**📈 Bullish Confidence: 75%**
Breakout traders are watching \$142.23 — a blowout print could push it toward \$150+.
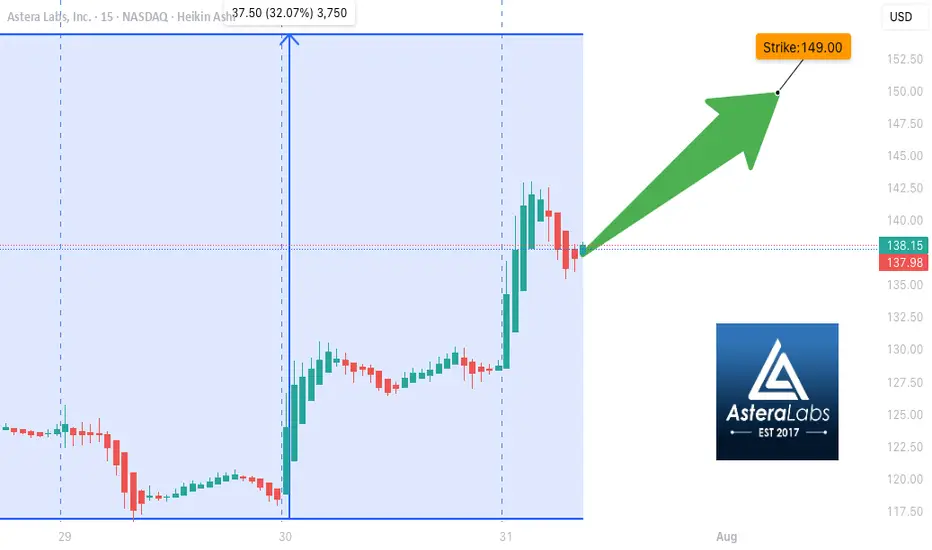
ALAB WEEKLY TRADE IDEA (2025-07-31)
### 🚨 ALAB WEEKLY TRADE IDEA (2025-07-31)
🧠 **Smart Money Snapshot**
→ RSI: **76+** = Strong Momentum
→ Call/Put Ratio: **2.19** = Bullish Bias
→ Volume: 📉 **0.6x last week** = Momentum may fade
→ Gamma Risk: ⚠️ High = Expect **fireworks**
---
📈 **TRADE SETUP**
💥 Ticker: **\ NASDAQ:ALAB **
🟢 Strategy: **Buy Call**
🎯 Strike: **\$149.00**
💰 Entry: **\$0.65**
🎯 Target: **\$0.97** (50%+)
🛑 Stop: **\$0.39**
📆 Expiry: **Aug 1 (1DTE)**
📊 Confidence: **75%**
---
⚠️ **Risk Note:**
1DTE = 💣 High gamma = **big reward / big risk**
🧯 Size small. Exit fast. Ride momentum.
---
📌 Trade posted: **2025-07-31 @ 10:58 AM ET**
\#ALAB #OptionsTrading #WeeklyPlay #GammaSqueeze #MomentumTrade #TradingViewViral
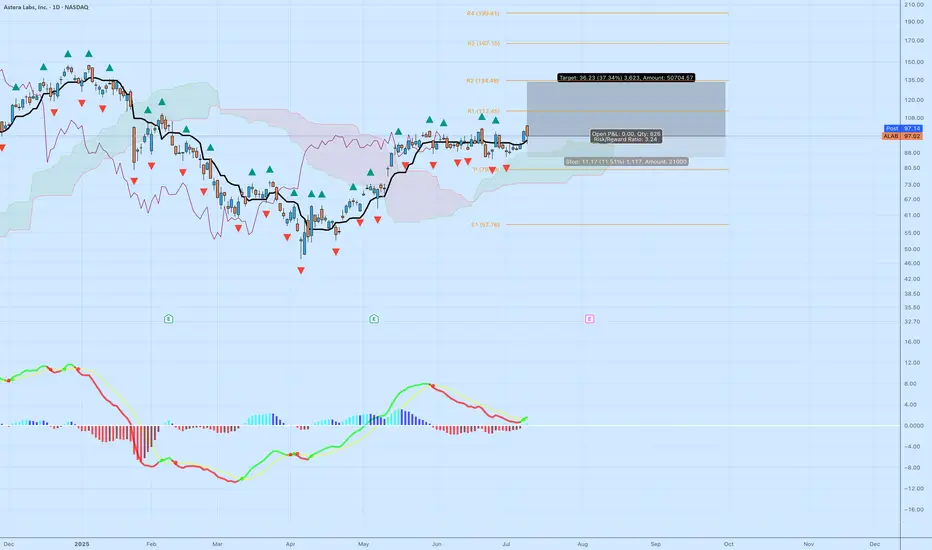
ALAB: High-Quality Breakout With Strong Structure and 3.2 R/RAstera Labs ( NASDAQ:ALAB ) just delivered a clean technical breakout above multi-week resistance, paired with bullish confirmation from momentum and Ichimoku structure. This isn’t a hype trade — this is what a textbook continuation breakout looks like.
📊 Key Technical Breakdown
Base Breakout
After weeks of tight consolidation, NASDAQ:ALAB just broke above horizontal resistance at ~$95. The breakout candle is strong, with above-average range and a decisive close.
Ichimoku Cloud
Price is well above the cloud — this confirms bullish trend.
The Kijun (black line) is sloping upward, and the cloud is thick and rising.
Pullbacks toward $88–90 could act as support if the breakout retests.
MACD Reversal
The MACD has flipped green, signaling a momentum shift.
Histogram is expanding upward again, showing renewed buying pressure.
This is happening as price reclaims the top of the recent range — a great alignment.
🎯 Trade Specs
Entry: $97.02
Target: $133.25 (+37.34%)
Stop: $85.32 (–11.51%)
Risk/Reward: 3.24 — solid skew for a growth name
Context: Strong prior trend, healthy consolidation, and now continuation. This isn’t a bottom-pick — it’s trend-following at a breakout moment.
🧠 Why This Trade Works
Structure: You’re not chasing green candles. This breakout comes after a long base and clears prior congestion.
Asymmetry: A 3.2+ R/R setup means you can be wrong more than half the time and still come out ahead — if you stick to your stops.
Momentum Alignment: Momentum and price are moving together — never fade a breakout with confirmation from both price action and indicators.
📌 Tip for Readers:
If you’re new to swing trading, study how this base formed and what conditions led to the breakout. The goal isn’t prediction — it’s positioning at the right moments with risk defined.
Will ALAB Finallyt Breakout?NASDAQ:ALAB has had several breakout attempts to no avail? Is now the time? Keep an eye on it, on the verge up starting an uptrend.... I hope I did not jinx it.
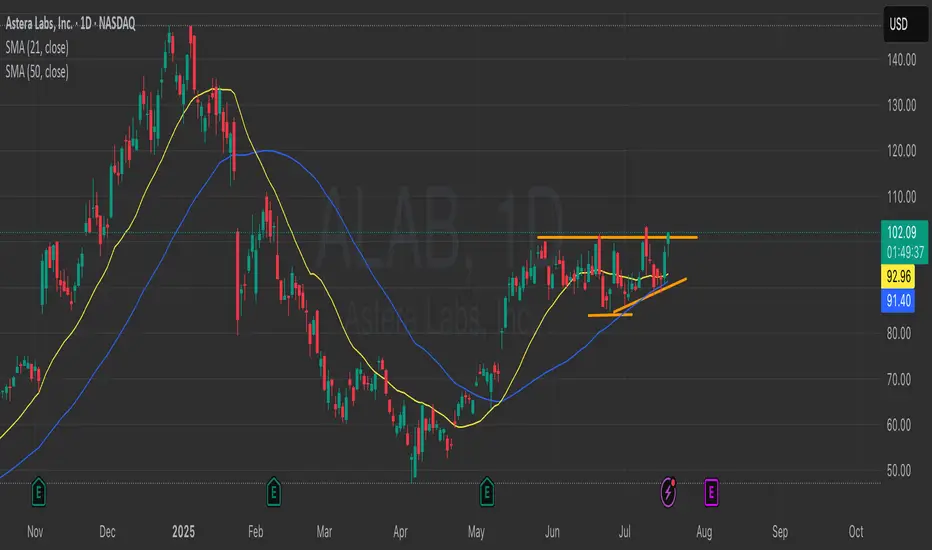
$ALAB Forming a Megaphone PatternNASDAQ:ALAB has seen a lot of volatility as of late. I took a position in it and was stopped out for a loss due to that volatility.
I may be too fixated on this name, but I want to get involved as I think it has a chance to run to previous highs. I thought it had formed a cup with handle pattern, and I got involved on Wed. June 18th only to get stopped on Monday, Jun 23rd. I have been watching it since.
Now it appears it is forming a megaphone pattern. These patterns usually resolve in the direction of the last trend. In this case that trend was up. I like too that the 50 DMA (red) is in an uptrend. I have an alert set on the upper trendline resistance area. Should that trigger, I will look for a good risk reward entry.
If you like this idea, please make it your own and follow your trading plan. Remember, it is your money at risk.
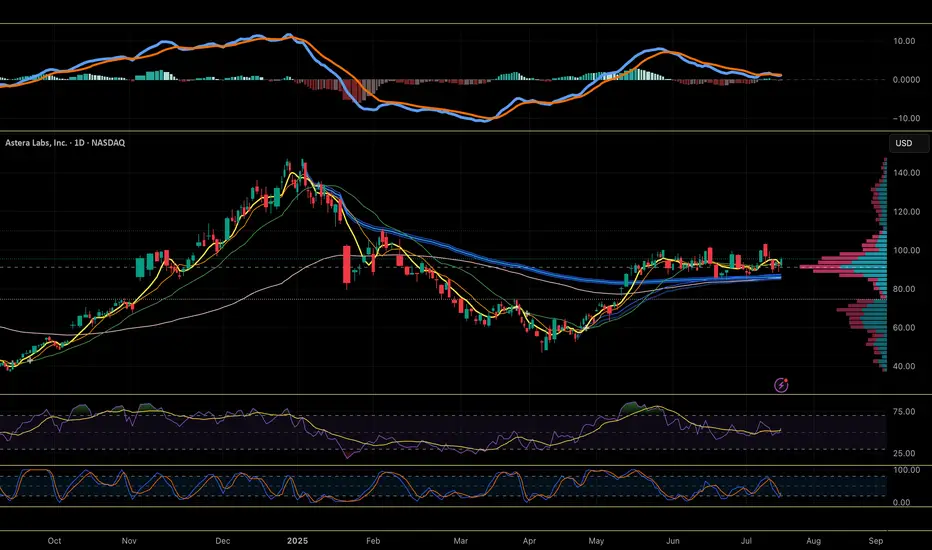
$ALAB coiled over AVWAP pinchNASDAQ:ALAB has been coiling in a tight range since May, when it vaulted over the AVWAP from the January high. Now above the AVWAP pinch from that Jan high and April low, consolidating above key moving averages, the stock looks ready to launch soon of the volume shelf at ~$90-92
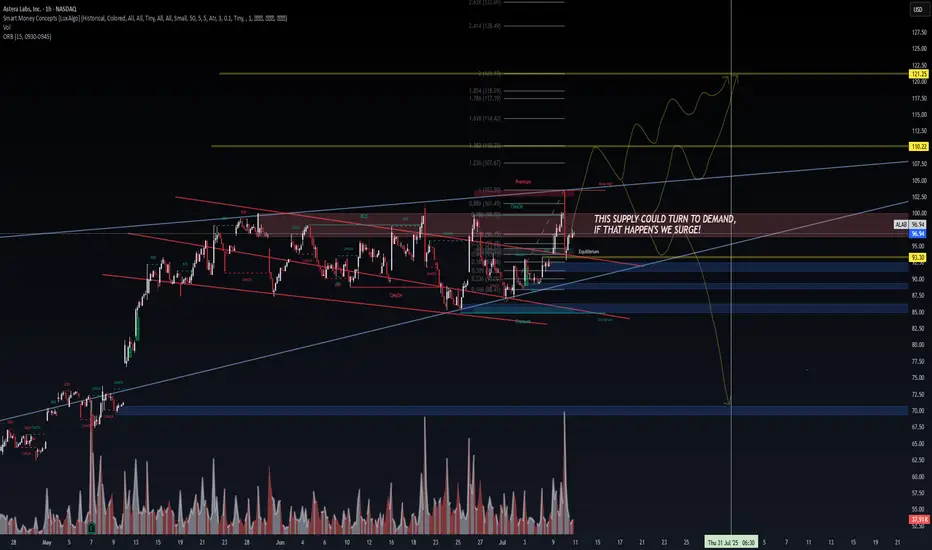
ALAB | Smart Money Compression → Breakout Threat🔭 ALAB | Smart Money Compression → Breakout Threat
Posted by: VolanX Quant Systems | July 10, 2025
We're at a critical inflection point on $ALAB.
The previous supply zone (highlighted in red) is under pressure — one more CHoCH + BOS and it may flip to DEMAND. If that happens, we don’t trickle...
We surge.
🧠 VolanX DSS Notes:
SMC Structure: Multiple CHoCHs + recent BOS confirm internal strength
Volume spike confirms interest at this price level
0.886 Fib rejection zone tagged @ ~$101.49
Equilibrium sits near $95 — ideal backtest zone
Bullish path = target range $110.22 → $122.50
Bearish scenario only resumes below $93.30, where supply holds and volume fades
“This supply could turn to demand — if that happens, we surge!”
🛠️ Risk Layering:
Entry: $96.50–$97.00
Risk: Close below $93.30 invalidates thesis
Reward: Multi-leg rally toward golden pocket + extended fibs
📉 If demand fails to hold, expect retracement into deep discount zones between $72–$77.
🧬 LSTM-backed directional bias: UP (70% confidence)
📊 Options flow is light but positive risk sentiment observed
#SmartMoneyConcepts #ALAB #VolanX #OrderBlock #CHoCH #BreakOfStructure #QuantTrading #SupplyDemand #FibonacciLevels #LSTM #LiquidityZones #WaveAnalysis #TradingView #InstitutionalFlow #DSS
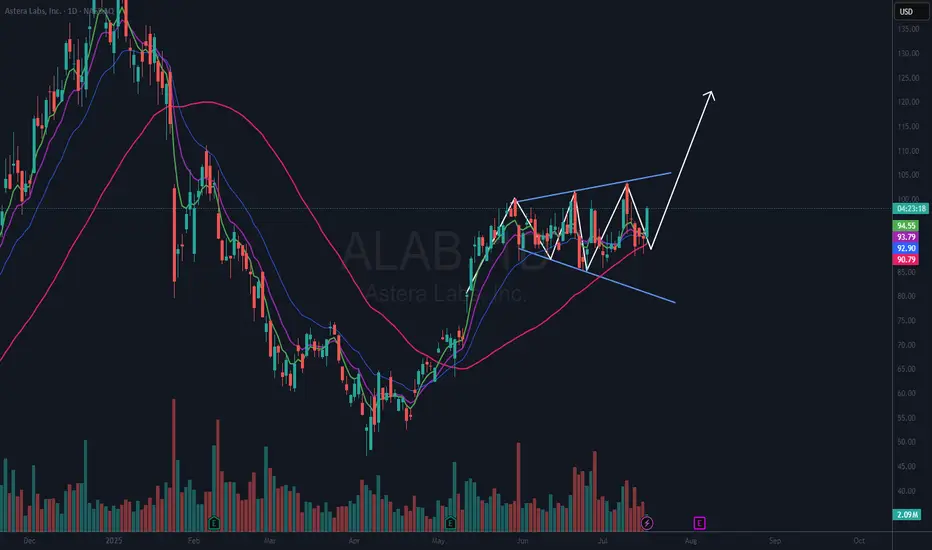
Astera labs breaking outNASDAQ:ALAB is breaking out today out of this symmetric triangle, could be a big mover...
Semi sector has been strong and ALAB has been lagging quite a bit, let it catch up

ALAB Off to the racesGreat to finally see ALAB start to kick in. After a few down days, it is starting to participate in the SEMI bull run.

Is ALAB starting to show some life?ALAB has had a terrible few days... mahy be starting to perk up... bright future

ALAB - EASY SHOT UPGood Morning,
Hope all is well. As you can see ALAB has built some momentum on the news of strategic partnerships for AI technologies with NVIDIA. The next resistance is easily broken, with this momentum there is no reason for ALAB to not hit above 140$.
ENJOY!
