AMZN Options Alert: High-Potential Swing PlayInstrument: AMZN
Signal Type: Swing Trade
Direction: BUY CALLS (though note Katy AI predicts short-term bearish bias)
Confidence: Medium (65%)
Strike Focus: $220
Entry Price: $2.36 – $2.40
Target 1: $4.72 (≈100% gain)
Target 2: $7.08 (≈200% gain)
Stop Loss: $1.18 (≈50% loss)
Expiry: 17 days (2025-12
Amazon.com, Inc. Shs Cert Deposito Arg Repr 0.00694444 Sh
No trades
Key facts today
0.040 USD
52.62 B USD
566.64 B USD
About Amazon.com, Inc.
Sector
Industry
CEO
Andrew R. Jassy
Website
Headquarters
Seattle
Founded
1994
ISIN
ARBCOM460176
Amazon.com, Inc. is a multinational technology company, which engages in the provision of online retail shopping services. It operates through the following segments: North America, International, and Amazon Web Services (AWS). The North America segment offers retail sale of consumer products, including from sellers, advertising, and subscriptions services through North America-focused online and physical stores. The International segment focuses on retail sale of consumer products, including from sellers, advertising, and subscription services through internationally-focused online stores. The AWS segment is composed of global sales of compute, storage, database, and other services for start-ups, enterprises, government agencies, and academic institutions. The company was founded by Jeffrey P. Bezos in July 1994 and is headquartered in Seattle, WA.
Related stocks

AMAZON 's new Bear Cycle targets $125. And it can make you rich.Amazon Inc. (AMZN) has been trading within a massive 24-year Channel Up ever since its October 2001 bottom of the Dotcom crash. This pattern, as you can see, has been following a very distinct structure with its 1M MA100 (green trend-line) being the major Support level (and providing the most effici

AMZN : What’s Taking Shape?Amazon’s recent recovery has developed into an interesting emerging structure. After the sharp drop and strong rebound, price is now building a potential continuation pattern. Momentum suggests the market may still be preparing for another upward leg once this consolidation phase completes. With the

AMZN Bullish Flag & Breakout Setup?Amazon (AMZN) is trending higher on the daily chart after a strong rally off the mid-October low, confirmed by a bullish Break of Structure and price holding above the rising 60-day and 120-day moving averages. Price is now consolidating in a classic bull flag beneath resistance, with key demand anc

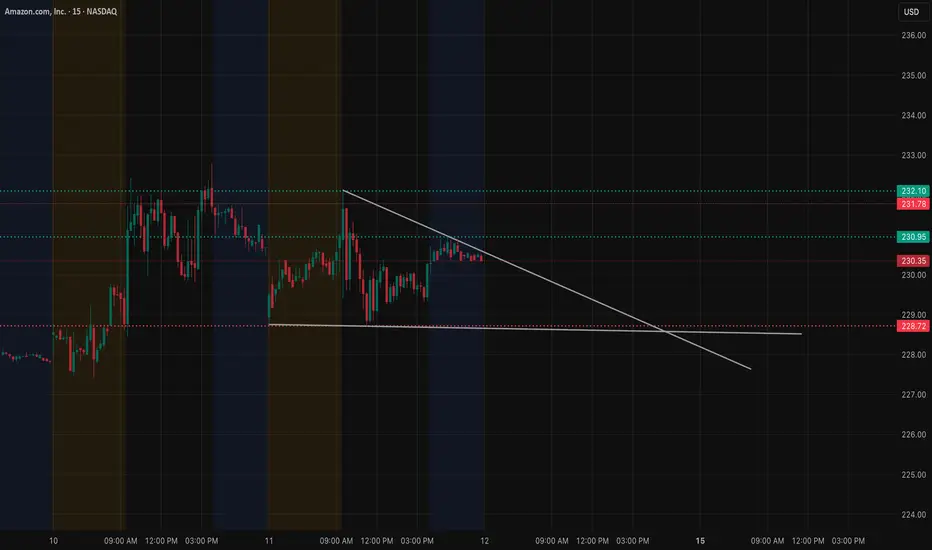
AMZN Dec 12 Compressing Under a Key Trendline. Will it break?AMZN has been trading in a contracting structure on the 15-minute timeframe, respecting a downward trendline that has repeatedly rejected price. Each attempt to push through the 230.50–231 zone has been met with selling, keeping AMZN stuck under this tightening resistance. The price action has forme
AMZN at a Critical Zone for Dec. 15. Could Decide the Next Move?AMZN doesn’t look strong going into Dec. 15. It’s not collapsing, but it also doesn’t show the kind of buying pressure you’d expect if a real bounce was coming.
After the breakdown from the prior range, price tried to stabilize, but every push higher has been slow and overlapping. That usually tells


AMZN — Dec 10 Outlook | Tight Coil Under Resistance & GEX Shows the Real Battle
1H Structure
AMZN has been grinding inside a clear descending structure, capped by the falling trendline around $229–$230. Every bounce is getting weaker, and price is still sitting underneath the main breakdown zone from earlier in the week

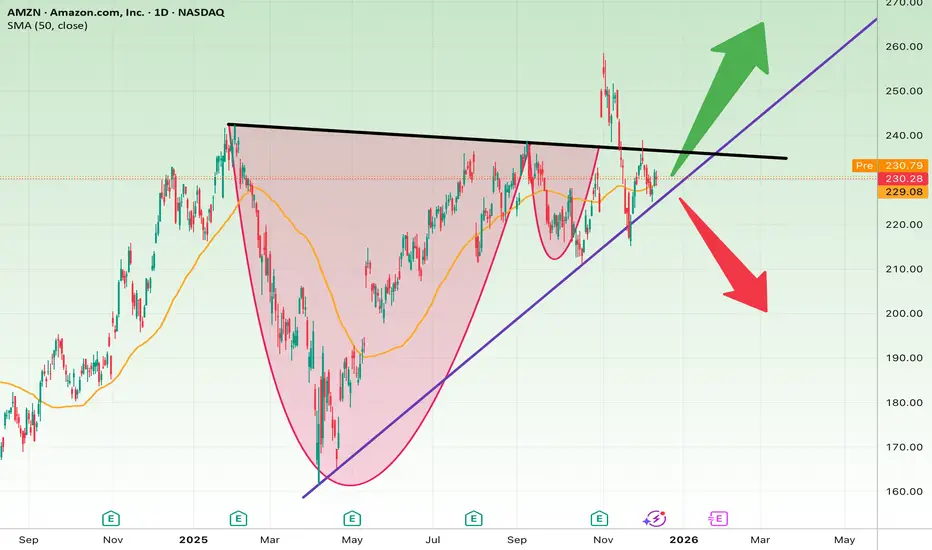
Amazon at a Major Decision Point (Breakout or Breakdown?)The chart shows a very important setup:
• A completed Cup & Handle pattern
• A strong ascending trendline still intact
• A long-term descending resistance line
Price is compressing between the trendline and resistance → major decision point.
Bullish Scenario
If AMZN closes above $235:
• Targ
Quant siganls V3 AMZN Weekly Calls: Katy AI Sees Bullish MoveAMZN Weekly Options Trade Overview
Direction: BUY CALLS
Strike: $220
Entry Price: $11.00–$11.38
Target 1: $16.70–$16.80 (≈50% gain)
Target 2: $19.55 (≈75% gain)
Stop Loss: $8.15–$8.40 (≈25% loss)
Expiry: 2025-12-12 (Friday)
Position Size: 2–2.5% of portfolio
Confidence: 58–65%
Trend: Bulli

See all ideas
Summarizing what the indicators are suggesting.
Oscillators
Neutral
SellBuy
Strong sellStrong buy
Strong sellSellNeutralBuyStrong buy
Oscillators
Neutral
SellBuy
Strong sellStrong buy
Strong sellSellNeutralBuyStrong buy
Summary
Neutral
SellBuy
Strong sellStrong buy
Strong sellSellNeutralBuyStrong buy
Summary
Neutral
SellBuy
Strong sellStrong buy
Strong sellSellNeutralBuyStrong buy
Summary
Neutral
SellBuy
Strong sellStrong buy
Strong sellSellNeutralBuyStrong buy
Moving Averages
Neutral
SellBuy
Strong sellStrong buy
Strong sellSellNeutralBuyStrong buy
Moving Averages
Neutral
SellBuy
Strong sellStrong buy
Strong sellSellNeutralBuyStrong buy
Displays a symbol's price movements over previous years to identify recurring trends.
AMZN6237342
Amazon.com, Inc. 5.55% 20-NOV-2065Yield to maturity
5.71%
Maturity date
Nov 20, 2065
US23135CK0
Amazon.com, Inc. 4.1% 13-APR-2062Yield to maturity
5.62%
Maturity date
Apr 13, 2062
US23135CC8
Amazon.com, Inc. 3.25% 12-MAY-2061Yield to maturity
5.61%
Maturity date
May 12, 2061
AMZN6237344
Amazon.com, Inc. 5.45% 20-NOV-2055Yield to maturity
5.58%
Maturity date
Nov 20, 2055
US23135BT2
Amazon.com, Inc. 2.5% 03-JUN-2050Yield to maturity
5.57%
Maturity date
Jun 3, 2050
US23135CJ3
Amazon.com, Inc. 3.95% 13-APR-2052Yield to maturity
5.55%
Maturity date
Apr 13, 2052
AMZN4531868
Amazon.com, Inc. 4.25% 22-AUG-2057Yield to maturity
5.54%
Maturity date
Aug 22, 2057
AMZN4996701
Amazon.com, Inc. 2.7% 03-JUN-2060Yield to maturity
5.52%
Maturity date
Jun 3, 2060
AMZN5182959
Amazon.com, Inc. 3.1% 12-MAY-2051Yield to maturity
5.51%
Maturity date
May 12, 2051
AMZN4531866
Amazon.com, Inc. 4.05% 22-AUG-2047Yield to maturity
5.47%
Maturity date
Aug 22, 2047
US23135AQ9
Amazon.com, Inc. 4.95% 05-DEC-2044Yield to maturity
5.25%
Maturity date
Dec 5, 2044
See all AMZND bonds
Curated watchlists where AMZND is featured.


