Amazon (AMZN) Shares Jump Over 4%Amazon (AMZN) Shares Jump Over 4%
Amazon (AMZN) shares were among the top gainers in the equity markets yesterday, rising more than 4% and closing above $235 for the first time since February 2025.
The rally was fuelled by reports that Kuiper – Amazon’s project aimed at providing internet access via a network of low-Earth orbit satellites – has signed a partnership agreement with JetBlue. From 2027, this will allow free Wi-Fi to be offered on board selected aircraft. As a result, Amazon’s project is emerging as a new competitor to Elon Musk’s Starlink.
Technical Analysis of Amazon (AMZN) Chart
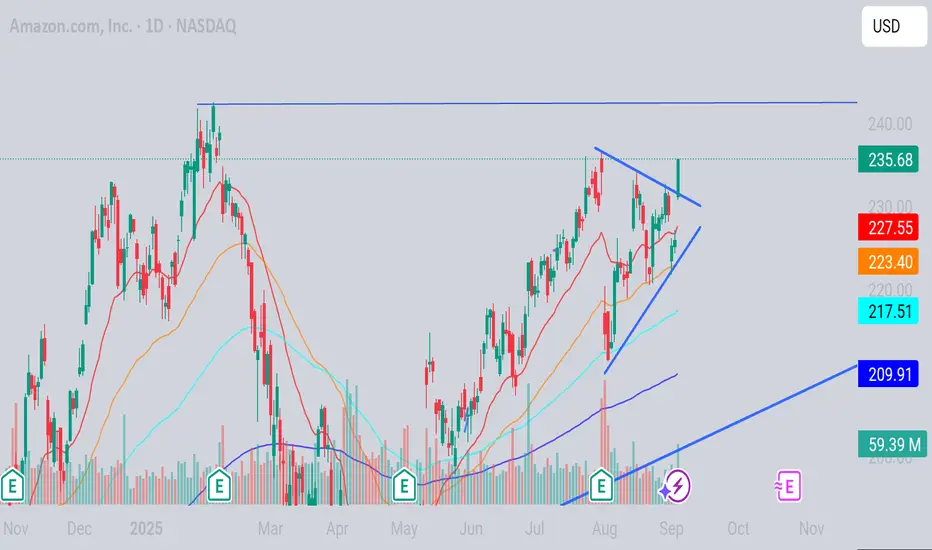
Since August, AMZN’s price fluctuations have been forming a bullish structure of higher highs and higher lows (0-A-B-C-D-E-F).
These and other key turning points provide the basis for constructing an upward channel (shown in blue), with the following implications:
→ in the near term, the price could surpass the previous high at point E, extending the bullish structure;
→ the channel median has proved to be an important support level – it held the price during the early August decline and continued to play this role throughout the month.
It is worth noting that AMZN’s upward momentum within the channel is unfolding step by step, making it possible to draw intermediate resistance lines R0, R1, and R2. In this context:
→ they can be viewed as examples of a bullish flag chart pattern;
→ yesterday’s rally with a bullish gap may signal the start of a new growth phase towards the next resistance at R3.
However, on this path, hurdles could come from:
→ the upper boundary of the blue channel;
→ the $230 level, around which a bearish head and shoulders pattern formed in February, marking this year’s high;
→ the psychological level of $250.
This article represents the opinion of the Companies operating under the FXOpen brand only. It is not to be construed as an offer, solicitation, or recommendation with respect to products and services provided by the Companies operating under the FXOpen brand, nor is it to be considered financial advice.
AMZND trade ideas

Global Venture Capital & Startups1. Understanding Startups
1.1 Definition
A startup is a young, innovative company designed to grow rapidly, often leveraging technology to disrupt existing industries or create new markets. Unlike traditional businesses that may prioritize steady, incremental growth, startups seek scalability and exponential growth.
1.2 Key Characteristics of Startups
Innovation: Offering new products, services, or business models.
Scalability: Potential to serve millions of customers quickly.
High Risk, High Reward: Success can lead to unicorns (valued over $1 billion), while many fail within the first five years.
Funding Dependence: Require external capital since revenues are usually limited in the early stages.
1.3 Examples of Iconic Startups
Google, Amazon, and Facebook – once startups, now trillion-dollar enterprises.
Flipkart, Ola, and Zomato – Indian startups that transformed local economies.
Nubank (Brazil) – a fintech disrupting banking in Latin America.
2. The Venture Capital Model
2.1 What is Venture Capital?
Venture capital is a type of private equity financing provided by VC firms or funds to startups and early-stage companies that are believed to have high growth potential. Investors provide funding in exchange for equity (ownership shares).
2.2 The VC Process
Fundraising: VC firms raise money from limited partners (LPs) like pension funds, wealthy individuals, sovereign wealth funds, and corporations.
Investment: VCs invest in startups at different stages (seed, early-stage, growth, late-stage).
Mentorship & Support: Beyond money, VCs provide expertise, industry connections, and strategic guidance.
Exit: VCs seek returns via IPOs, acquisitions, or secondary sales of shares.
2.3 Stages of VC Funding
Pre-seed & Seed: Idea or prototype stage, high risk.
Series A: Proving product-market fit, scaling operations.
Series B & C: Expanding market share, international growth.
Late-Stage / Pre-IPO: Preparing for public listing or acquisition.
2.4 Venture Capital Economics
High Risk: Most startups fail; VCs rely on a few “home runs” to deliver returns.
Portfolio Approach: A VC fund invests in 20–30 startups, expecting 2–3 to generate massive returns.
Time Horizon: Returns typically realized in 7–10 years.
3. Evolution of Global Venture Capital
3.1 Early Origins
The concept of risk capital dates back centuries, with European merchants funding voyages.
Modern venture capital emerged in the U.S. post-World War II, with firms like ARDC backing companies such as Digital Equipment Corporation.
3.2 Silicon Valley Model
In the 1970s–90s, Silicon Valley became the global hub of VC, giving rise to Apple, Intel, Cisco, Google, and Yahoo.
The U.S. institutionalized venture capital as a structured asset class, inspiring global replication.
3.3 Global Expansion
China: VC boomed in the 2000s with Alibaba, Tencent, and ByteDance.
India: VC growth accelerated post-2010, with Flipkart, Paytm, and Byju’s.
Europe & Israel: Strong ecosystems for deep tech, cybersecurity, and biotech.
Latin America & Africa: Emerging markets with fintech and e-commerce focus.
4. Regional Venture Capital Ecosystems
4.1 United States
Largest and most mature VC market.
Strong universities (Stanford, MIT), corporate innovation, and risk-taking culture.
Home to iconic VC firms: Sequoia Capital, Andreessen Horowitz, Accel.
Hot sectors: AI, biotech, clean energy, SaaS.
4.2 China
Government-backed VC funds play a big role.
Rapid scaling due to large domestic market.
Leading in e-commerce, AI, electric vehicles, and fintech.
Key firms: Hillhouse Capital, IDG Capital.
4.3 India
One of the fastest-growing startup ecosystems.
Sectors: fintech, edtech, e-commerce, mobility.
Unicorns: Flipkart, Byju’s, PhonePe, Zomato.
Global VCs like Tiger Global, SoftBank, and Sequoia India drive growth.
4.4 Europe
Strong research base, but fragmented markets slow scaling.
Focus on green tech, health tech, and B2B SaaS.
London, Berlin, and Paris are key hubs.
4.5 Israel
Known as the “Startup Nation.”
Focus on cybersecurity, defense tech, and AI.
Heavy collaboration between startups, universities, and defense sector.
4.6 Latin America & Africa
Growing VC ecosystems with fintech leading the charge.
Examples: Nubank (Brazil), Flutterwave (Nigeria), M-Pesa (Kenya).
Global VCs increasingly investing due to large unbanked populations.
5. Startup Sectors Attracting VC Capital
5.1 Technology & Software
Cloud computing, SaaS, AI, and machine learning dominate VC funding.
5.2 Fintech
Mobile banking, payment platforms, cryptocurrency, blockchain-based services.
Examples: Stripe (US), Paytm (India), Revolut (UK).
5.3 HealthTech & Biotech
Telemedicine, genetic testing, biotech research, drug discovery.
Pandemic accelerated VC investment.
5.4 Green Tech & Sustainability
Clean energy, EVs, climate tech.
Example: Tesla, Northvolt.
5.5 Consumer Internet & E-Commerce
Still a dominant sector in emerging markets.
Examples: Amazon, Flipkart, Shopee, MercadoLibre.
6. Challenges in Global VC & Startups
6.1 High Failure Rates
Around 90% of startups fail due to lack of market demand, poor business models, or mismanagement.
6.2 Overvaluation & Funding Bubbles
Intense competition sometimes inflates valuations beyond fundamentals.
Example: WeWork’s failed IPO in 2019 exposed flaws in the system.
6.3 Geographic Inequality
VC funding is concentrated in select hubs (Silicon Valley, Beijing, Bengaluru), while smaller regions struggle.
6.4 Regulatory & Political Risks
Data privacy laws, antitrust scrutiny, and geopolitical tensions affect startup growth.
6.5 Exit Challenges
IPO markets may fluctuate; acquisitions depend on larger companies’ appetite.
7. Social & Economic Impact of Startups
7.1 Job Creation
Startups generate millions of jobs, particularly in emerging markets.
7.2 Innovation Driver
Disrupt traditional industries (Uber vs. taxis, Airbnb vs. hotels).
7.3 Global Connectivity
Platforms like Zoom, Slack, and WhatsApp revolutionized communication.
7.4 Financial Inclusion
Fintech startups expand access to banking for underserved populations.
7.5 Risks of Inequality
Tech concentration can widen wealth gaps and regional divides.
8. Future of Global VC & Startups
8.1 Rise of AI-First Startups
AI expected to dominate every sector from healthcare to education.
8.2 ESG & Impact Investing
More capital flowing to climate tech, renewable energy, and social enterprises.
8.3 Decentralization & Web3
Blockchain and decentralized finance (DeFi) creating new opportunities.
8.4 Globalization of VC
Cross-border investments increasing, with U.S. and Chinese VCs funding in Africa, LATAM, and SE Asia.
8.5 Corporate Venture Capital (CVC)
Large corporations setting up VC arms (Google Ventures, Intel Capital, Reliance Ventures).
Conclusion
The global venture capital and startup ecosystem is one of the most dynamic forces shaping the modern economy. Startups bring forth disruptive innovation, challenge traditional industries, and create wealth and jobs on an unprecedented scale. Venture capital, in turn, provides the financial and strategic backing needed to fuel this engine of innovation.
However, the ecosystem is not without risks: high failure rates, valuation bubbles, and inequality pose real challenges. Despite these, the trajectory of global VC and startups points toward continued growth, deeper globalization, and stronger integration with pressing global challenges such as climate change, healthcare, and financial inclusion.
The next decade promises a world where venture capital not only funds billion-dollar companies but also helps solve billion-people problems.

$AMZN has its turn at reclaiming ATHHuge gap up for AMZN today on good news. Finally broke out and looking to test all time highs again. I would love to see it push further on Friday to end the week but I also wouldn't doubt it of it came back to retest support first. Swings play are better here
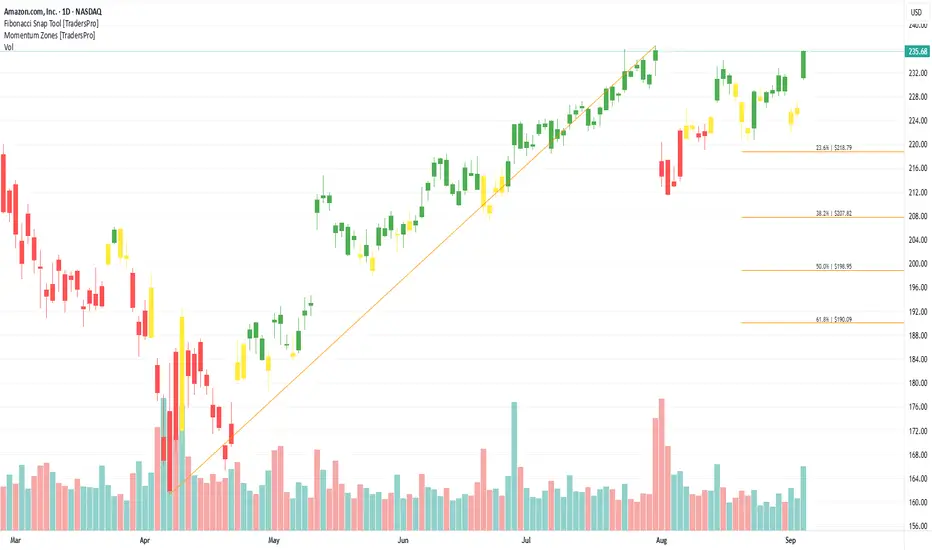
Amazon.com, Inc. (AMZN) Gains on AWS Cloud ExpansionAmazon.com, Inc. (AMZN) is a global leader in e-commerce and cloud computing, best known for its massive online marketplace and its AWS cloud platform. The company also operates in digital streaming, logistics, and AI-powered technology solutions. Amazon’s growth is fueled by the continued shift to online shopping, the rapid expansion of AWS, and investments in logistics, automation, and emerging technologies that keep it at the forefront of global innovation.
On the chart, a confirmation bar with rising volume shows bullish momentum. The price has entered the momentum zone after moving above the .236 Fibonacci level. Traders can set a trailing stop just below this Fibonacci line using the Fibonacci snap tool, helping protect gains while leaving room for more upside potential.
$AMZN Going for ATH BreakNASDAQ:AMZN going for ATH break, daily bands are finally starting to expand. Also bullish flow came in yesterday. 10/17/25 240C @ 5.90 $2.1M

Rocket Booster Strategy – 3 Steps + Amazon (AMZN) 🚀 Amazon (AMZN) – Multi-Timeframe Technical Setup
Daily Chart:
On the daily chart, the technical summary shows a neutral rating. Both the oscillators and moving averages are neutral. Digging deeper, the MACD is signaling a sell, hinting at short-term hesitation.
Weekly Chart:
Shifting to the weekly chart, the oscillator rating also appears neutral initially. However, examining momentum reveals a pullback forming—the exact setup we want to spot for a potential continuation. Bingo!
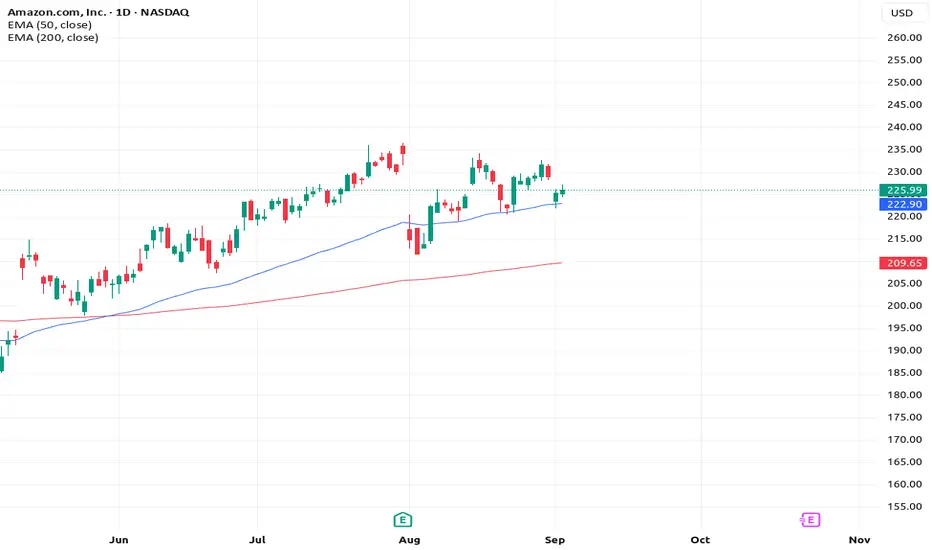
Monthly Chart:
On the monthly chart, the long-term picture is bullish. Moving averages show a strong buy, with price comfortably above the 50 EMA and 200 EMA. Add in a gap up, and Amazon looks ready for a potential upward surge.
🚀 Rocket Booster Strategy – 3 Steps
Daily Chart – Spot Neutral or Short-Term Weakness:
Look for neutral technical summary or short-term sell signals like MACD to identify hesitation in the short-term trend.
Weekly Chart – Identify Momentum Pullback:
Examine weekly momentum indicators to find pullbacks—this is where you prepare for a continuation in the trend.
Monthly Chart – Confirm Long-Term Strength:
Check moving averages (50 EMA & 200 EMA). Price above these with gap-ups signals strong long-term bullish alignment—the “rocket booster” for your trade.
This combination of short-term caution, medium-term pullback, and long-term strength is the essence of the Rocket Booster Strategy.
Rocket Boost This Content To Learn More.
⚠️ Disclaimer
This article is for educational purposes only. Always use a simulation (paper) trading account to test strategies before trading live. Apply proper risk management and profit-taking strategies to protect capital.
AMZN Options Flow Explodes! $230 Call Trade Idea”
# 🚀 AMZN Weekly Options Trade Idea (2025-09-03)
### 📊 Market Recap
* **Daily RSI**: 47.9 ⬇️ (bearish tilt)
* **Weekly RSI**: 57.1 ⬇️ (losing momentum)
* **Volume**: 0.9x 📉 (weak vs prior week)
* **Options Flow**: 💎 Strongly bullish (C/P = 3.30)
* **VIX**: ✅ Favorable (16–17)
👉 **Models Split:**
* 🐻 DeepSeek → \$225 PUT idea (bearish).
* 🐂 Grok + Llama → \$230 CALL (moderate bullish).
* ⚖️ Gemini + Claude → **NO TRADE** (risk > reward).
---
### ✅ Consensus Trade Setup (Flow-Weighted Lean)
```json
{
"instrument": "AMZN",
"direction": "call",
"strike": 230.0,
"expiry": "2025-09-05",
"entry_price": 0.43,
"profit_target": 0.86,
"stop_loss": 0.26,
"size": 1,
"confidence": 0.62,
"entry_timing": "open"
}
```
---
### 🎯 Trade Plan
* 📌 **Strike**: \$230 CALL (Sep 5)
* 💵 **Entry**: 0.43 (ask @ open)
* 🎯 **Target**: 0.86 (+100%)
* 🛑 **Stop**: 0.26 (–40%)
* ⏰ **Max Hold**: Exit by Thu EOD (avoid Fri gamma risk)
* ⚖️ **Size**: 1 contract (small, <2% equity)
* 📈 **Confidence**: 62% (flow-driven edge, weak technicals)
---
⚠️ **Risks**
* Daily + weekly RSI trending down = 🐻 momentum risk
* Weak institutional volume confirmation 📉
* Heavy call flow could be **retail noise / covered calls** 😬
* 2 DTE → **theta burn + gamma whip risk** ⚡
---
Economic Risks in Global Trading1. Understanding Economic Risks in Global Trade
Definition
Economic risks are uncertainties related to financial losses or reduced profitability due to changes in economic conditions at domestic or international levels. In global trade, these risks can emerge from:
Exchange rate volatility
Inflationary pressures
Interest rate changes
Economic recessions or booms
Global demand and supply shocks
Balance of payments crises
Why They Matter in Global Trade
Businesses deal with multiple currencies. A sudden depreciation can wipe out profits.
International supply chains make companies vulnerable to inflation and disruptions.
Economic downturns in one region spill over into others, shrinking global demand.
Governments adjust monetary and fiscal policies, impacting trade competitiveness.
Thus, understanding economic risks is crucial for firms and policymakers.
2. Types of Economic Risks in Global Trading
2.1 Currency (Exchange Rate) Risk
One of the most common economic risks is exchange rate volatility. Since global trade is often settled in foreign currencies (primarily US dollars, euros, yen, etc.), fluctuations in exchange rates can directly impact profitability.
Exporter’s perspective: If an Indian company exports goods to the US and invoices in dollars, a sudden appreciation of the rupee against the dollar means it will receive less revenue in rupee terms.
Importer’s perspective: An importer who must pay in foreign currency faces higher costs if their domestic currency depreciates.
Real Example: During the 2013 “Taper Tantrum,” the Indian rupee depreciated sharply against the dollar, increasing import costs for oil and electronics.
2.2 Inflation Risk
Inflation erodes purchasing power and increases the cost of goods. In global trade, high inflation in one country can:
Reduce competitiveness of exports (as goods become more expensive).
Increase import demand (as domestic products lose appeal).
Hurt multinational corporations operating in high-inflation economies.
Case Example: Argentina has faced chronic inflation above 50%, making its exports expensive while discouraging foreign investments.
2.3 Interest Rate Risk
Interest rates affect borrowing costs and investment decisions. Central banks worldwide adjust rates to control inflation or stimulate growth. These changes influence global trade through:
Cost of capital for exporters/importers.
Shifts in currency values (as higher interest rates attract foreign investment).
Reduced consumer demand when borrowing costs rise.
Example: The US Federal Reserve’s aggressive interest rate hikes in 2022 strengthened the dollar, hurting emerging markets by making their debt servicing costlier and exports less competitive.
2.4 Economic Recession and Growth Risk
The health of global economies directly impacts trade volumes.
Recession reduces consumer demand, lowers imports, and shrinks export markets.
Booms stimulate cross-border trade and investment.
Example: The 2008 Global Financial Crisis reduced global trade by nearly 12% in 2009, the steepest drop since World War II.
2.5 Credit and Payment Risk
When businesses trade internationally, they face the risk of buyers defaulting or being unable to make payments due to financial crises, insolvency, or capital controls.
Illustration: During the Asian Financial Crisis (1997–98), many firms in Southeast Asia defaulted on foreign trade payments, causing ripple effects across supply chains.
2.6 Supply Chain and Cost Risk
Global supply chains are highly interconnected. Economic risks can emerge from:
Rising raw material prices.
Freight and shipping cost surges.
Energy price volatility.
Example: The COVID-19 pandemic exposed global supply chain vulnerabilities, with container shortages and freight costs skyrocketing.
2.7 Sovereign and Country Risk
Economic instability at the national level—debt crises, currency collapse, or fiscal mismanagement—can affect international traders.
Example: Sri Lanka’s economic crisis in 2022 led to shortages of foreign reserves, making it difficult to pay for imports like fuel and medicines.
2.8 Commodity Price Risk
For economies dependent on commodity exports (oil, gas, metals, agriculture), global price swings are a major risk.
Oil price collapse in 2014 severely affected Venezuela and Nigeria.
Rising energy costs in 2022 hit European industries heavily.
2.9 Balance of Payments Risk
Persistent trade deficits or current account imbalances can weaken a country’s currency and erode investor confidence, impacting trade flows.
3. Causes of Economic Risks in Global Trading
3.1 Globalization and Interconnectedness
While globalization boosts trade, it also spreads risks faster. A crisis in one region (like the US housing bubble in 2008) quickly spreads worldwide.
3.2 Policy and Regulatory Shifts
Changes in monetary policy, tariffs, or trade agreements alter the economic landscape for businesses.
3.3 Geopolitical Tensions
Wars, sanctions, and political instability cause economic disruptions, particularly in energy and commodity markets.
3.4 Market Speculation and Volatility
Speculative trading in currencies, commodities, and financial markets often amplifies price swings, creating instability.
3.5 Structural Economic Weaknesses
Countries with high debt, low reserves, or over-dependence on certain exports face greater economic risks.
4. Impacts of Economic Risks on Global Trade
4.1 On Businesses
Reduced profitability due to currency fluctuations.
Uncertainty in pricing and contracts.
Delays or losses in payments.
Higher operational costs.
4.2 On Governments
Pressure on foreign exchange reserves.
Difficulty in managing inflation and debt.
Social unrest if trade disruptions cause shortages of essential goods.
4.3 On Consumers
Higher prices for imported goods.
Limited availability of products during crises.
Reduced employment opportunities due to business slowdowns.
4.4 On Global Financial Markets
Capital flight from emerging markets during crises.
Sharp fluctuations in stock and bond markets.
Increased demand for safe-haven assets like gold and US treasuries.
5. Real-World Case Studies
Case 1: Global Financial Crisis (2008)
Triggered by the US housing bubble and banking collapse, this crisis spread worldwide, reducing trade volumes drastically. Export-driven economies like China, Germany, and Japan faced sharp slowdowns.
Case 2: COVID-19 Pandemic (2020–21)
Lockdowns disrupted supply chains, consumer demand collapsed, and global trade volumes shrank by 5.3% in 2020. At the same time, inflation surged due to supply shortages.
Case 3: Russia-Ukraine War (2022)
The war caused energy prices to surge, disrupted wheat exports, and increased global inflation, hurting import-dependent nations.
6. Strategies to Manage Economic Risks
6.1 Currency Risk Management
Hedging using futures, options, and swaps.
Invoicing in domestic currency.
Natural hedging (matching revenues and costs in the same currency).
6.2 Inflation and Interest Rate Risk Control
Diversifying sourcing and supply chains.
Adjusting pricing strategies.
Accessing low-cost financing in stable economies.
6.3 Credit Risk Mitigation
Using letters of credit and export credit insurance.
Conducting due diligence on trade partners.
6.4 Supply Chain Risk Management
Building multiple supplier networks.
Holding strategic inventories.
Using digital tools for supply chain monitoring.
6.5 Government and Policy Measures
Creating trade stabilization funds.
Maintaining adequate foreign exchange reserves.
Negotiating bilateral/multilateral trade agreements.
7. The Future of Economic Risks in Global Trade
Looking ahead, the nature of risks will evolve with changing global dynamics:
De-globalization trends (reshoring, regional supply chains).
Digital currencies and blockchain reducing some payment risks but creating new ones.
Climate change influencing commodity prices and trade routes.
AI-driven markets adding volatility but also improving risk prediction.
Conclusion
Economic risks are an unavoidable part of global trading. While they pose significant challenges—currency volatility, inflation, recessions, commodity shocks—they also encourage innovation in risk management and financial instruments. Businesses and governments that anticipate, adapt, and diversify are better equipped to navigate the turbulent waters of international trade.
Global trade thrives on opportunities but survives on resilience. By recognizing economic risks and building robust strategies, the world economy can continue to benefit from interconnectedness while minimizing vulnerabilities.
Catch the Short on AmazonHello I am the Cafe Trader.
Today we are again looking at AMZN.
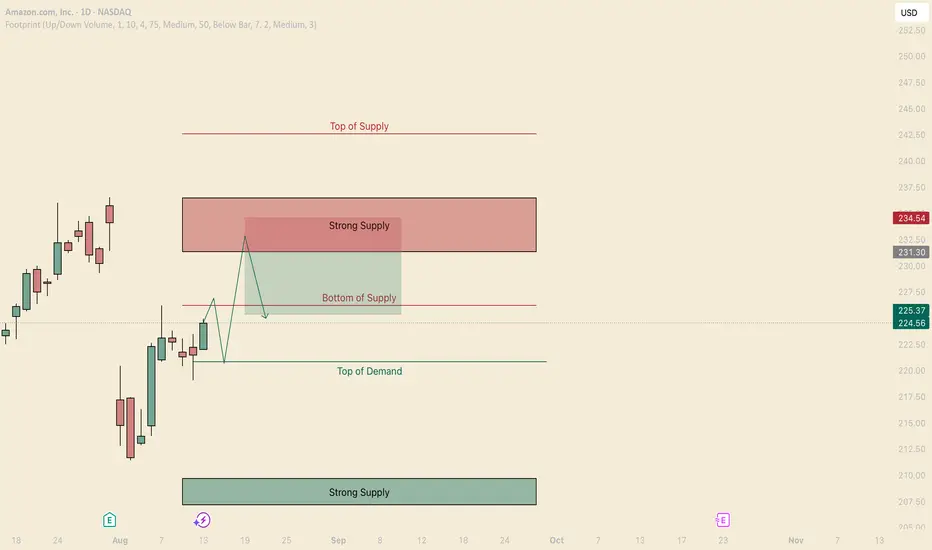
We are in the middle of a range. Buyers are currently in control in the short term, but I am expecting a Hot reaction off that strong supply level. This can be especially suitable for a quick options flip (same day, or overnight hold).
Short Setup
Entry: $231.30 (Bottom of Strong Supply)
Stop: $234.50 (Top of Strong Supply)
TP: $225.30 (2R target)
Notes: Looking for a hard rejection out of supply. If we do not close inside the strong supply zone, this would be bearish. you may have to be patient intraday on this one.
If we do get a really strong reaction and actually take out the new buyers trying to step in, This will not look good for AMZN as a whole, and we could expect it to break those previous lows (eventually tapping into strong supply)
Hope everyone does well, and happy trading!
@thecafetrader
$AMZN — Triangle WatchNASDAQ:AMZN — Triangle Watch
Price is tightening on the right side of a base:
– Symmetrical triangle forming
– Holding above 50d & 200d MAs
– Breakout attempt faded (not ready yet)
– Volume light during coil, constructive
Still holding w/ trailing stop. Watching $234–236 for breakout confirmation on strong volume.
#SwingTrading #TechnicalAnalysis

ResistanceAMZN is facing resistance from a downward trendline and resistance at 233$, if price does not overcome these levels price may possibly retreat to the 227$ or 225$ price area.

AMZN Swing Trade Setup | $235C Targeting 100%+ This Week# 🔥 AMZN Weekly Options Setup (Aug 29 Expiry) 🚀📈
📊 **Consensus from Multi-Model Analysis**
* ✅ Daily RSI rising (Bullish)
* ⚖️ Weekly RSI falling (Neutral)
* 🏦 Institutional Flow: **Strong Call Skew (C/P 3.61)**
* 📉 Volume: Contracting (risk flag)
* 📉 VIX: Low → Favors Call Buying
---
## 📌 Trade Setup
🎯 **Instrument**: AMZN Weekly Call
💵 **Strike**: \$235
📅 **Expiry**: 2025-08-29
💰 **Entry**: \$0.82 (open)
🛑 **Stop Loss**: \$0.41 (-50%)
🎯 **Target 1**: \$1.07 (+30%)
🎯 **Target 2**: \$1.64 (+100%)
📏 **Size**: 1 Contract (risk ≤3%)
⏰ **Hold Window**: Mon → Thu (Exit before Friday Gamma)
📈 **Confidence**: 66%
---
## 🚨 Key Risks
⚠️ Low weekly volume = weak follow-through risk
⚠️ Theta burn accelerates after Wed → exit by Thu
⚠️ VIX spike (>18) = invalidate setup
---
## 🧾 Quick Trade Card
* **Bias**: Moderate Weekly Bullish
* **Edge**: Institutional call flow + Daily RSI momentum
* **Caveat**: Weak weekly volume, fading RSI
---
### 🚀 Viral Hashtags
\#AMZN #OptionsTrading #SwingTrade #UnusualOptionsActivity #StocksToWatch #TradingSetup
Amazon Chart CheckOn the weekly chart, Amazon looks like it’s starting to tire a bit. Price is struggling just under that January high near 24,252.
Looking at the Ichimoku Cloud:
• In mid-2023, price broke strongly above the cloud and bounced cleanly higher after retests.
• More recently (spring 2025), we had a decent correction but bounced again.
• Now, instead of bouncing hard, price is just sitting on top of the cloud — feels weaker than before.
On the daily chart:
• The 200-day moving average has been a line in the sand since May. Several successful tests and bounces.
• Currently, price is hugging the daily cloud.
• If we see erosion near 219–220(top of the cloud), a quick dip back to the 200-day MA (~21,280) is very possible.
• A close below that could signal a potential top forming.
⚠️ For me, this uptrend feels a little tired — worth keeping an eye on and possibly tightening stops if you’re in the trade.
Disclaimer:
The information posted on Trading View is for informative purposes and is not intended to constitute advice in any form, including but not limited to investment, accounting, tax, legal or regulatory advice. The information therefore has no regard to the specific investment objectives, financial situation or particular needs of any specific recipient. Opinions expressed are our current opinions as of the date appearing on Trading View only. All illustrations, forecasts or hypothetical data are for illustrative purposes only. The Society of Technical Analysts Ltd does not make representation that the information provided is appropriate for use in all jurisdictions or by all Investors or other potential Investors. Parties are therefore responsible for compliance with applicable local laws and regulations. The Society of Technical Analysts will not be held liable for any loss or damage resulting directly or indirectly from the use of any information on this site.

$AMZN Bear Case Study... NASDAQ:AMZN BEAR CASE THREAD 🧵
Amazon's weekly chart reveals a critical technical breakdown. After failing to sustain momentum above key resistance at $223, price is now forming what appears to be a double top pattern.
The downtrend line from recent highs is firmly intact with accelerating downside momentum on multiple timeframes. RSI showing weakness without reaching overbought territory - bearish divergence forming.
With parabolic SAR now flipped bearish on the 4H chart and stochastic signaling overbought conditions, downside targets include $215 and potentially $200 if selling intensifies.
Earnings optimism priced in, but macro headwinds mounting. Position accordingly. #Bearish #technicalanalysis

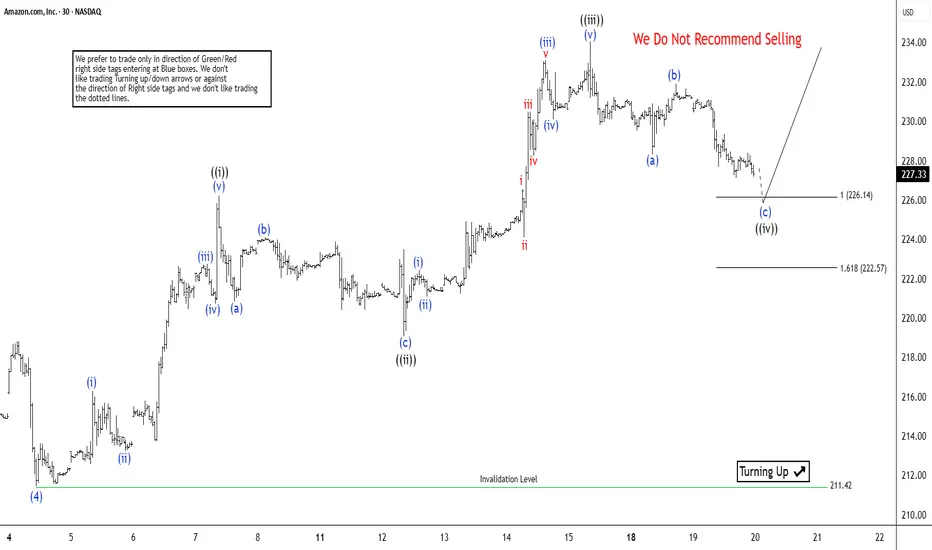
Amazon (AMZN) Approaches Cycle Peak Post-August 2025 LowAmazon (AMZN) continues its cycle from the August 2025 low, unfolding as a five-wave impulse in the Elliott Wave framework. From that low, wave (i) peaked at $216.30, followed by a shallow pullback in wave (ii) to $213.25. The stock then surged in wave (iii) to $222.75, with a brief dip in wave (iv) concluding at $220.71. The final leg, wave (v), reached $226.22, completing wave ((i)) in a higher degree. A correction in wave ((ii)) followed, bottoming at $219.05.
After this pullback, the stock resumed its ascent in wave ((iii)). Wave (i) of this sequence hit $222.43, with wave (ii) retracing to $221.07. A strong advance in wave (iii) pushed the price to $233.11, followed by a dip in wave (iv) to $230.10. The final wave (v) concluded at $234.08, marking the end of wave ((iii)). Currently, wave ((iv)) is unfolding as a zigzag Elliott Wave structure. From the wave ((iii)) peak, wave (a) declined to $228.33, and wave (b) rallied to $231.91. Wave (c) of ((iv)) is expected to drive prices lower, targeting the extreme zone of $222.57–$226.14, based on the 100%–161.8% Fibonacci extension of wave (a). As long as the pivot low at $211.42 holds, the pullback should find support in a 3, 7, or 11 swing, setting the stage for further upside. This analysis highlights Amazon’s structured ascent and near-term corrective potential.
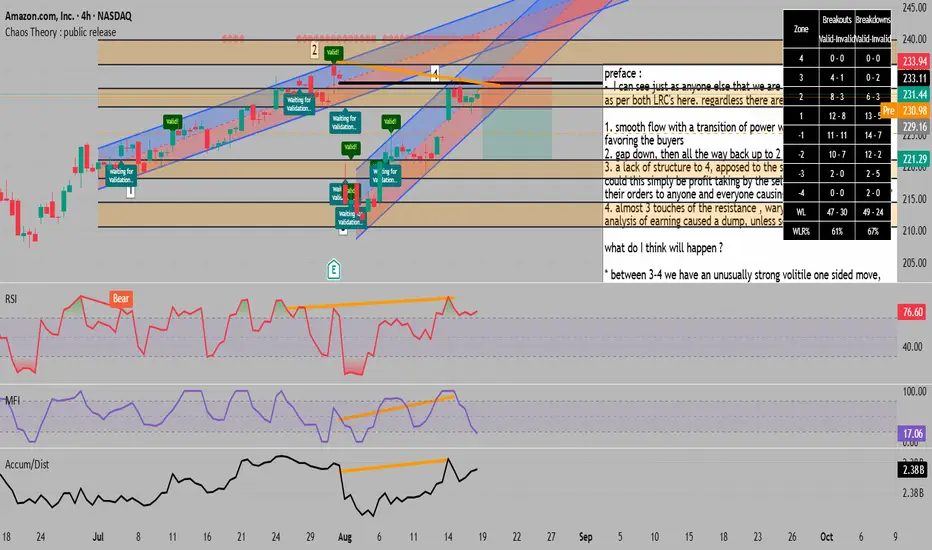
potential pullback predicted due to one sided uptrend = BUY preface :
- I can see just as anyone else that we are angled upward ,
as per both LRC's here. regardless there are some points to note
1. smooth flow with a transition of power without much imbalance,
favoring the buyers
2. gap down, then all the way back up to 2
3. a lack of structure to 4, apposed to the smooth flow from 1-2,
could this simply be profit taking by the sellers at two, offloading
their orders to anyone and everyone causing massive spikes back to 4?
4. almost 3 touches of the resistance , wary buyers as per the
analysis of earning caused a dump, unless something changed?
what do I think will happen ?
* between 3-4 we have an unusually strong volitile one sided move,
normally these are followed by a smooth trend the opposing direction,
I could envision price coming back down to 3, or maybe at least 3-4
midpoint. it is taking too much libery to even hint at a turnaround ,
a pullback on the other hand.... possible, especially with this volitlity.
* RSI , MFI and Accumulation distribution all have hidden divergence,
as well as all being oversold, I dont care much about oversold, during
high volitility movements the overbought and sold are pretty much useless,
* over the past 2,500 bars, if price closes below a zone, we have a 67%
chance it follows through to the other end , you can manually verify
by reducing the lookback period. these are great odds!
AMZN Losing Momentum? Put Flow on the Table
# 🛒 AMZN Weekly Options Setup (8/18 – 8/22)
📉 **Consensus: Neutral → Cautious Bearish**
* 🔻 RSI trending down (daily + weekly)
* 📉 Weak volume = no strong institutional conviction
* ⚖️ 4/5 AI models → **NO TRADE**
* 🐻 Only **DeepSeek** calls for puts → bearish divergence
---
## 🎯 Trade Setup (Aggressive Play)
* **Instrument**: AMZN
* **Direction**: PUT (SHORT)
* **Strike**: \$225.00
* **Expiry**: 2025-08-22
* **Entry**: \$0.82
* **Profit Target**: \$0.98 (scalp style)
* **Stop Loss**: \$0.50
* **Confidence**: 65% (only because DeepSeek flagged momentum divergence)
* **Timing**: Enter at open → monitor closely (don’t baghold into Friday ⚠️).
---
## 📈 Breakeven @ Expiry
👉 \$224.18 (Strike – Premium)
AMZN must **close < \$224.18 by 8/22** to finish ITM.
But plan = **exit early on IV / momentum pop**, not expiry hold.
---
## 🧠 Key Risks
* Theta burn 🔥 (short expiry puts bleed fast)
* Market news swings (AMZN often reacts to macro headlines)
* Lack of volume → potential for chop instead of follow-through
---
# ⚡ AMZN 225P WEEKLY PLAY ⚡
🎯 In: \$0.82 → Out: \$0.98
🛑 Stop: \$0.50
📅 Exp: 8/22
📈 Bias: Weak, but playing the downside momentum divergence 📉

AMZN: Bullish Technical Setup Points to $240 TargetCurrent Price: $231.03
Direction: LONG
Targets:
- T1 = $236.50
- T2 = $240.00
Stop Levels:
- S1 = $228.00
- S2 = $225.00
**Wisdom of Professional Traders:**
This analysis synthesizes insights from thousands of professional traders and market experts, leveraging collective intelligence to pinpoint high-probability trade opportunities in AMZN. The wisdom of crowds principle suggests that consolidating expert knowledge can highlight actionable patterns with reduced biases.
**Key Insights:**
AMZN is currently demonstrating strong bullish momentum following a breakout above its 50-day moving average. Traders have noted robust demand in AMZN tied to the company’s dominance in e-commerce as well as accelerating growth in its Amazon Web Services (AWS) division. This technical breakout aligns with a period of relative strength in tech stocks overall, making AMZN well-positioned to push higher in the near term.
Another standout factor supporting bullish sentiment is institutional buying activity, which appears to have significantly increased alongside positive earnings expectations. Analysts point to AMZN’s ability to outperform across its business segments during macroeconomic uncertainties. Furthermore, volume profiles indicate that rising accumulation is taking place, reflecting growing confidence among professional investors.
**Recent Performance:**
In the last two weeks, AMZN has climbed approximately 4%, moving from the $221 range to its current price of $231.03. The stock has successfully achieved a higher high after bouncing from key support levels near $220. Additionally, relative strength index (RSI) metrics suggest AMZN remains in bullish territory, with no overbought signals at the current stage. This price action indicates continuing upward momentum backed by solid fundamentals.
**Expert Analysis:**
Technical analysts stress that sustaining prices above $230 represents a significant psychological threshold for AMZN to take aim at $236 and $240 levels. The moving average convergence divergence (MACD) indicator has turned positive, signaling momentum reinforcement. Moreover, Bollinger Bands suggest room for wider upward price moves, as AMZN has remained on the upper side of volatility thresholds but far from breakout extremes.
On the fundamental side, industry experts remain optimistic about AMZN’s ability to drive growth, particularly as AWS continues to expand its customer base across lucrative cloud segments. Revenue forecasts show resilience despite wider market concerns, further bolstering bullish sentiment around the equity.
**News Impact:**
Recent news about AMZN’s push to revolutionize supply chain efficiencies with AI-driven technology has injected optimism into the stock’s outlook. Additionally, improved operational strategies in key international markets have supported confidence in future profitability. Attention around these developments is drawing positive sentiment from institutional investors, further strengthening AMZN's near-term trajectory.
**Trading Recommendation:**
AMZN offers a compelling LONG opportunity at these levels, supported by technical and fundamental evidence. The stock is well-positioned to rally towards its next resistance level of $236.50, while the upside could extend to $240.00 under favorable conditions. Stop placements at $228 and $225 provide ample risk control to safeguard against reversal scenarios. Traders should remain watchful of external events that could impact overall tech sentiment but capitalize on AMZN’s bullish structure.
Do you want to save hours every week?
Amazon.com Inc. (AMZN) – Bullish SetupAMZN closed at $231.03 and is showing strength after bouncing from the support zone around $207 – $213. The weekly chart indicates buyers are regaining control, supported by increasing volume and positive momentum indicators.
🎯 Targets:
• First target: $243
• Second target: $260
Stop-loss: Weekly close below $213.
The 3 Step Rocket Booster "Once you master this strategy ..."When you watch this video i want you to think of the
the 3 step rocket booster strategy.
Once you master this strategy then it will
be easy for you understand the other indicators
and how they work.
This video is very very advanced and i dont expect you to understand
unless you are a trading expert.
But the point am trying to make to you
is that everything is connected.
Even understanding one strategy is better than
understanding not even one.
understanding one strategy is the building block.
So in this video am taking you through
the building blocks of trading.
My strategy is very advanced but i want to show you
that even in this advanced strategy
the Rocket booster strategy
is a building block.
So watch this video to learn more now.
Rocket boost this content to learn more.
Disclaimer:Trading is risky please learn risk management and profit taking strategies also feel
free to use a simulation trading account
before you trade with real money.

AMZN - LONG Swing Entry PlanNASDAQ:AMZN - LONG Swing Entry Plan
Entry Zone 1: $220.00 – $217.00
→ Open initial position targeting +8% from entry level.
Entry Zone 2: $212.00 – $209.00
→ If price dips further, average down with a second equal-sized entry.
→ New target becomes +8% from the average of Entry 1 and Entry 2.
Edit Zone : $192.00 – $190.00
→ If reached, enter with double the initial size to lower the overall cost basis.
→ Profit target remains +8% from the new average across all three entries.
Risk Management:
Stop Loss:
Risk is capped at 12% below the average entry price (calculated across all executed positions including the Edit Zone).
Position Sizing Approach:
Entry 1: 1x
Entry 2: 1x
Edit Zone: 2x
→ Total exposure: 4x
→ Weighted average determines final TP and SL calculations.
______________________________________
Legal Disclaimer
The information provided in this content is intended for educational and informational purposes only and does not constitute financial, investment, or legal advice or recommendations of any kind. The provider of this content assumes no legal or financial responsibility for any investment decisions made based on this information. Users are strongly advised to conduct their own due diligence and consult with licensed financial advisors before making any financial or investment decisions.
Sharia Compliance Disclaimer: The provider makes no guarantees that the stocks or financial instruments mentioned herein comply with Islamic (Sharia) principles. It is the user’s responsibility to verify Sharia compliance, and consultation with a qualified Sharia advisor is strongly recommended before making any investment decisions

Don’t Miss: AMZN Call Opportunity at $242.50! 🚀 AMZN Swing Alert – 2025-08-15 🚀
**Sentiment:** Moderate Bullish
**Setup:** Call Option Trade
---
## 📈 Market Snapshot
* **Daily RSI:** 61.5 → Strong bullish momentum
* **5 & 10-Day Trend:** +3.68% / +7.52% → Confirmed upside
* **Volume:** Avg (1.0x) → Lacks strong institutional confirmation
* **Call/Put Ratio:** 1.00 → Neutral sentiment
* **VIX:** 14.84 → Low volatility, ideal for controlled swings
---
## ⚖️ Consensus & Conflicts
**Agreement:**
* Bullish momentum recognized across multiple models
* Favorable market conditions for swings
* Weak volume highlighted as a risk
**Disagreement:**
* Some models (Claude/Anthropic) advise caution, suggesting no immediate trade
* Confidence varies: DeepSeek favors a stronger bullish call, others remain cautious
---
## 🎯 Trade Setup – AMZN CALL
**Entry Condition:** At market open
**Strike:** \$242.50
**Expiration:** 2025-08-29
**Entry Price:** \$0.85
**Confidence:** 75%
**Profit Target:** \$2.13 (150% gain)
**Stop Loss:** \$0.50 (30% of premium)
**Key Risks:**
* Weak volume may reduce momentum sustainability
* Market shifts require active monitoring
---
## 📝 TRADE DETAILS (JSON)
```json
{
"instrument": "AMZN",
"direction": "call",
"strike": 242.5,
"expiry": "2025-08-29",
"confidence": 0.75,
"profit_target": 2.13,
"stop_loss": 0.50,
"size": 1,
"entry_price": 0.85,
"entry_timing": "open",
"signal_publish_time": "2025-08-15 11:56:23 UTC-04:00"
}
```
---
## 📊 Quick Reference – TradingView Ready
🎯 **Instrument:** AMZN
🔀 **Direction:** CALL (Long)
💵 **Entry Price:** \$0.85
📈 **Profit Target:** \$2.13
🛑 **Stop Loss:** \$0.50
📅 **Expiry:** 2025-08-29
📏 **Size:** 1 contract
⏰ **Entry Timing:** Market Open
🕒 **Signal Time:** 2025-08-15 11:56 EDT
---
### Suggested Viral Title & Tags:
**🔥 AMZN Swing Alert: Call Setup Ready – Strike \$242.50 🚀**
\#AMZN #SwingTrade #OptionsTrading #Bullish #CallOption #Momentum #TradeSetup #TechnicalAnalysis #StockAlerts #Finance #TradingSignals #MarketWatch #LongTrade

Amzn CallsLooking from Monthly perspective in alignment with the weekly and H4 pd array execution idea. Partials taken, risk free for the rest and in BE.
